The inverse head-and-shoulders pattern is a technical analysis formation that signals a potential bullish reversal in stock prices.
It is formed by three low points, the middle point being the lowest, and two high points on either side, resembling a person’s head and shoulders.
The inverse head-and-shoulders pattern is one of the most accurate technical analysis reversal patterns, with a reliability of 89%. It is also one of the most profitable chart patterns, with an average 45% price increase per trade.
Find out how to detect and use this chart pattern to improve your trading.
Key Takeaways
- The inverse head and shoulders pattern is a widely recognized chart pattern traders have relied on for decades.
- It boasts an impressive success rate of 89%.
- The average price increase is 45%.
- Swiftly detects possible reversals.
- It enables traders to determine the opportune moment to initiate a trade.
What Is the Inverse Head and Shoulders?
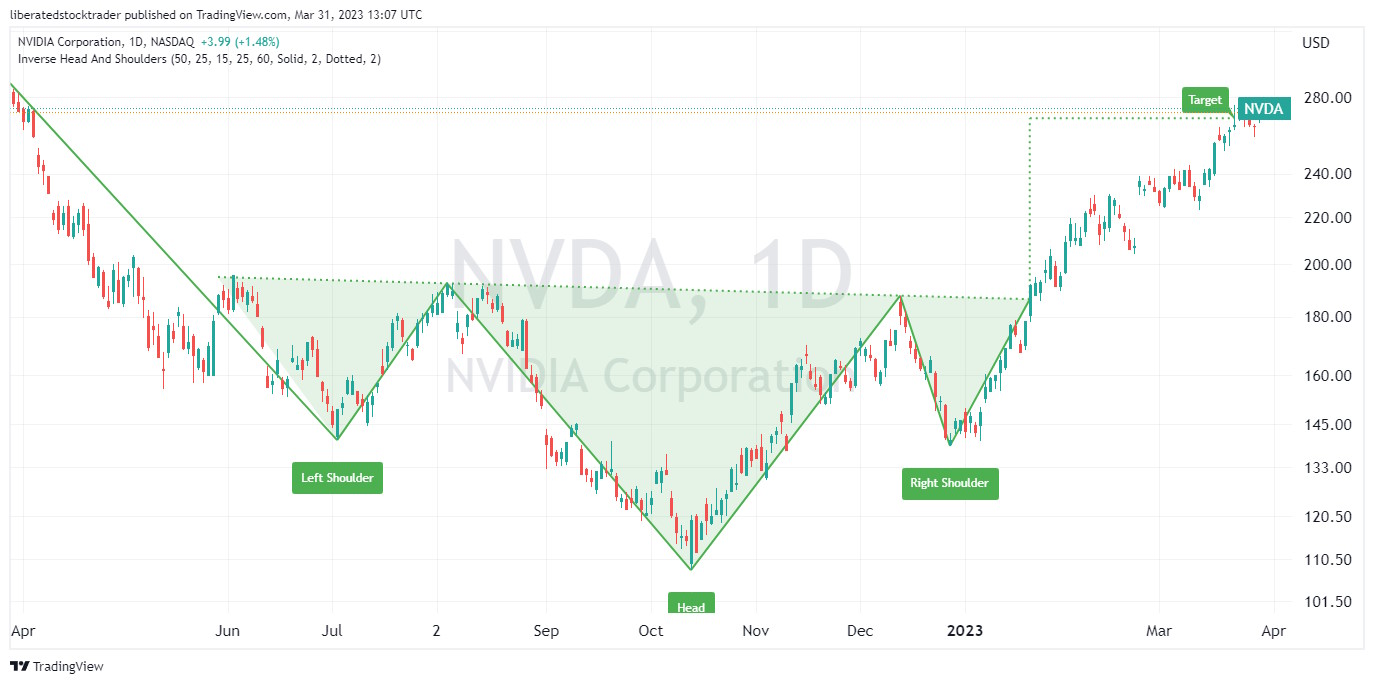
The inverse head and shoulders pattern is a bullish reversal pattern. It has three distinctive parts: the left shoulder, head, and right shoulder.
The left shoulder forms when the price falls to a new low, followed by a pullback. The head develops when the stock creates another new low before retreating again. Finally, the right shoulder is when the stock forms another new low close to the level of the first shoulder before moving up.
The inverse head and shoulders pattern is complete once the price breaks through the “neckline,” which connects the two shoulders. This break signals a new strong uptrend.
Once this pattern has been formed, it can also be used in trend trading and as a support line for the stock.
Get TradingView’s Inverse Head & Shoulders Pattern Recognition
What Does It Tell You?
The inverse head and shoulders pattern in technical analysis is used to identify potential reversals in the stock market. Since it involves three lows, it can be used to predict an impending reversal of a downtrend. After the neckline has been breached, traders should go long to take advantage of the price uptrend.
It’s important to note that although the inverse head and shoulders pattern accurately indicates potential reversals, it does not guarantee success.
Inverse Head and Shoulders Reliability
Detailed research shows an inverse head and shoulders chart pattern has an 89% success rate for a reversal of an existing downtrend. With an average price increase of 45%, this is one of the most reliable chart patterns.
| Chart Pattern | Success Rate | Average Price Change |
| Inverse head and shoulders | 89% | +45% |
The inverse head and shoulders occur when the price of security hits the bottom three times, with two troughs forming the “shoulders” and the third lower trough forming the “head.” This pattern can indicate that the security’s price could soon begin to move higher.
The inverse head and shoulders has been used for decades as a reliable indicator of potential reversals. The pattern is highly reliable because it requires three tests of the same resistance and a neckline break before it can be considered valid. This increases the accuracy of the signal and improves its reliability.
It is also important to note that head and shoulders patterns can form in bullish and bearish markets. This can provide traders a great way to enter or exit positions based on the market’s direction.
Despite its accuracy, it is important to note that no technical indicator is 100% reliable. While a head and shoulders pattern may be reliable, the key to success with this pattern is understanding when to take profits and cut losses.
Pros
- A proven 89% success rate.
- Average price change of +45%.
- Quickly identifies potential reversals.
- Allows traders to identify when they should enter a trade.
- An easily recognizable chart pattern that has been used for decades by traders.
- It can be automatically detected by TradingView and Finviz
Cons
- It should only be used on daily and weekly charts.
- It can be difficult to identify in real-time.
- The pattern does not occur with a high frequency.
The inverse head and shoulders indicates a reversal of a stock price trend. It occurs in a price downtrend and has three price lows that form the left shoulder, the head, and the right shoulder. The head is lower than the shoulders, and the pattern is confirmed when the price breaks up through the neckline.
TradingView 4.8/5⭐ : The Best Trading Platform I’ve Tested in 20+ Years
With lightning-fast charts, powerful pattern recognition, smart screening, backtesting, and a global community of 20+ million traders — it’s a powerful edge in today’s markets.

If you want one platform that gives you an edge, this is it.
Identifying a Head and Shoulders
To identify an inverse head and shoulders pattern, look for three distinct price lows at the bottom of a downtrend. The second low should be the lowest.
Generally, the pattern should be visible on intraday, daily, and weekly charts. After identifying the three peaks, investors can look for a confirmation of a trend reversal by watching for a breakout above the neckline. If the price breaks out above the support line, it signals that the security has completed its reversal. In contrast, a break below the resistance line could signal a resumption of the downtrend.
Automatically Identifying the Inverse Head & Shoulders?
TradingView automatically identifies inverse head-and-shoulders patterns. Go to TradingView and click Indicators > Technicals > Patterns. Next, select Inverse Head and Shoulders Chart Pattern. Now, a chart with this pattern will be clearly marked.

Enable automated chart pattern recognition:
- Go to TradingView
- Click Indicators > Technicals > Patterns
- Select Head and Shoulders Chart Pattern
- A chart with a head and shoulders pattern will be clearly marked.
TradingView will automatically plot the head and shoulders pattern and add a price target.
Example: Inverse Head & Shoulders Stock Chart

Get TradingView Head & Shoulders Chart Pattern Recognition
Inverse Head & Shoulders Rules
- The left shoulder is formed during a downtrend.
- The head is formed over the following days or weeks and is a new low.
- The right shoulder represents a failed price decline.
- The neckline. Using a trendline, connect the highs from both sides of the head through the outer price lines. Then, you see the distinct pattern below the neckline.
- Next, we see the price break up through the neckline.
Measuring a Head & Shoulders Pattern
TradingView can automatically measure a head and shoulders pattern to set a price target. Alternatively, to manually measure a head and shoulders pattern, use an arithmetic chart and plot the distance between the neckline and the middle peak. This distance will be the future price target which you should annotate on the chart.
What Does It Mean?
The inverse head-and-shoulders pattern represents supply and demand. In a bear market, the price is driving lower, but the final low (the right shoulder) is higher than the previous low (the head). This indicates more demand for the stock at these higher prices and more buyers than sellers.
This indicates that the market will experience a trend reversal from a downtrend to an uptrend.
All of the above conditions of the inverse head-and-shoulders pattern here are consistent with textbook descriptions. For a reference, see John J Murphy’s classic book Technical Analysis of the Financial Markets.
The head and shoulders pattern is said to be confirmed on a neckline break; this is about to occur in the chart above. Therefore, once the neckline is broken, the price declines.
Can an Inverse Head and Shoulders Turn Bearish?
Yes, an inverse head and shoulders can turn bearish. An inverse head and shoulders have an 11% chance of turning bearish during a bear market. If the security’s price fails to break above the neckline of the pattern, then this may indicate a continuation of the downtrend. The key to success with this reversal pattern is timing; traders need to enter or exit their positions at the right time.
What is a Head and Shoulders Top Pattern?
A head and shoulders top pattern is a chart formation that signals that a security’s price may be headed lower. It’s the opposite of the inverse head and shoulders pattern. When this pattern appears, it can indicate that a downtrend could be forming. To confirm this reversal, traders should watch for the security to break below the neckline. Once this occurs, traders should consider entering short positions in anticipation of a potential trend reversal.
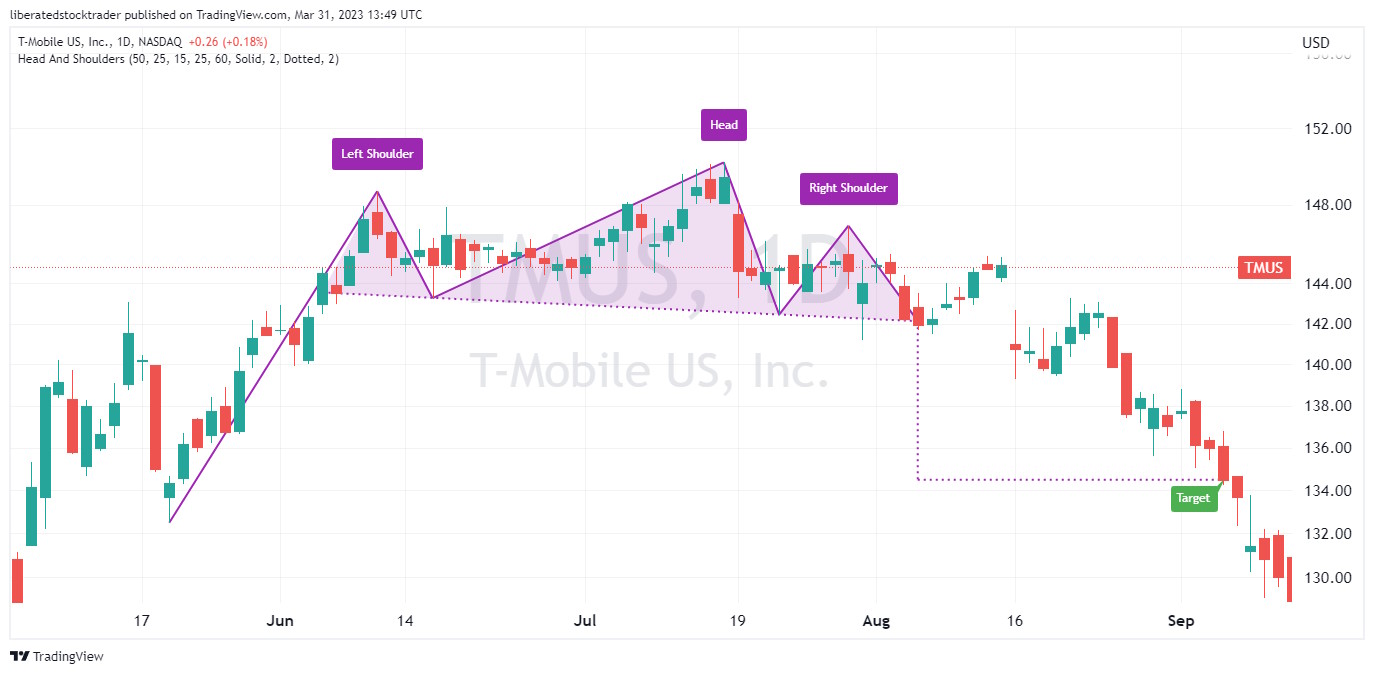
The inverse head and shoulders pattern predicts a stock price top rather than a bottom.
Summary.
Investors should look for inverse head-and-shoulders patterns during their analysis. These patterns can help them maximize profits or minimize losses when understanding the stock market’s direction. Additionally, understanding this pattern helps traders identify potential buying opportunities and spot potential risks in advance.
FAQ
What is the opposite of an inverse head and shoulders pattern?
The opposite of the inverse head and shoulders pattern is the head and shoulders top pattern, also known as the H&S top. This pattern occurs during a bull market and indicates a possible trend reversal.
Is an inverse head and shoulders pattern bullish?
An inverse head and shoulders pattern at the bottom of a downtrend is very bullish. 89 percent of the time this reversal pattern is accurate, meaning the price is expected to reverse and increase.
What happens after the inverse head and shoulders pattern completes?
When a head and shoulders pattern completes, the price will break through the neckline, and the trend reverses 80 percent of the time. Be vigilant and observe the direction of the price breakout.
How reliable is an inverse head and shoulders pattern?
The inverse head and shoulders pattern is among the most reliable chart indicators, with success rates varying from 81 percent for head and shoulder tops to 89 percent for inverse head and shoulders.
How to identify inverse head and shoulders patterns?
Inverse head and shoulders patterns can be identified automatically with TradingView or FinViz. Alternatively, you can manually identify it by looking for three price lows, with the second being the lowest.
How to measure head and shoulders pattern?
TradingView can automatically measure a head and shoulders pattern to set a price target. Alternatively, to measure manually, use an arithmetic chart and plot the distance between the neckline and the head. This distance will be the future price target which you should annotate on the chart.
How to trade a head and shoulders pattern?
When trading an inverse head and shoulders pattern, waiting for the price to break through the neckline before entering a long position is important. Alternatively, you can use options strategies such as buying calls. Setting a stop order slightly below the neckline is also advisable in case of false signals.
What is a flawed head and shoulders pattern?
A flawed head and shoulders pattern is a bearish reversal pattern that doesn't meet all of the criteria for a normal head and shoulders pattern. Typically, it occurs when either the left or right shoulder does not have an equal high as the opposite shoulder or when there is no clear breakout of the neckline. A flawed head and shoulders pattern may still be a valid reversal pattern.
Learn the Success Rates of 65 Chart Patterns
The Encyclopedia of Chart Patterns by Tom Bulkowski details the reliability and success rates of 65 chart patterns and shows you how to trade them. It is an indispensable resource for traders and investors seeking to enhance their profitability by leveraging stock chart patterns. This comprehensive reference book provides in-depth explanations and detailed illustrations of over 65 different patterns, including Head and Shoulders, Double Tops, Wedges, Flags, Gaps, and more.
