A bull flag is a technical analysis chart pattern indicating an upcoming bullish stock market trend. It is formed when there is a sharp price rise, followed by a period of consolidation, and then another upward move.
Most “investing websites” suggest traders look for bull flags as a bullish signal for potential future gains. But the data suggests they are wrong.
According to an analysis of 1,028 trades, most bull flags have a failure rate of 55%. The high-tight bull flag has a success rate of 85% and is the only flag pattern you should trade.
A lot has been written about bull flags, but academic research suggests that only one flag is successful. Learn how to identify and use the high-tight flag in your trading.
Key Takeaways
- The bull flag pattern looks like a flag with a pole. The pole is a sharp price rise; the flag is a price consolidation.
- A bullish flag is a continuation pattern, suggesting the price will rise after the consolidation phase.
- Most bull flags should be avoided as they have a low probability of success.
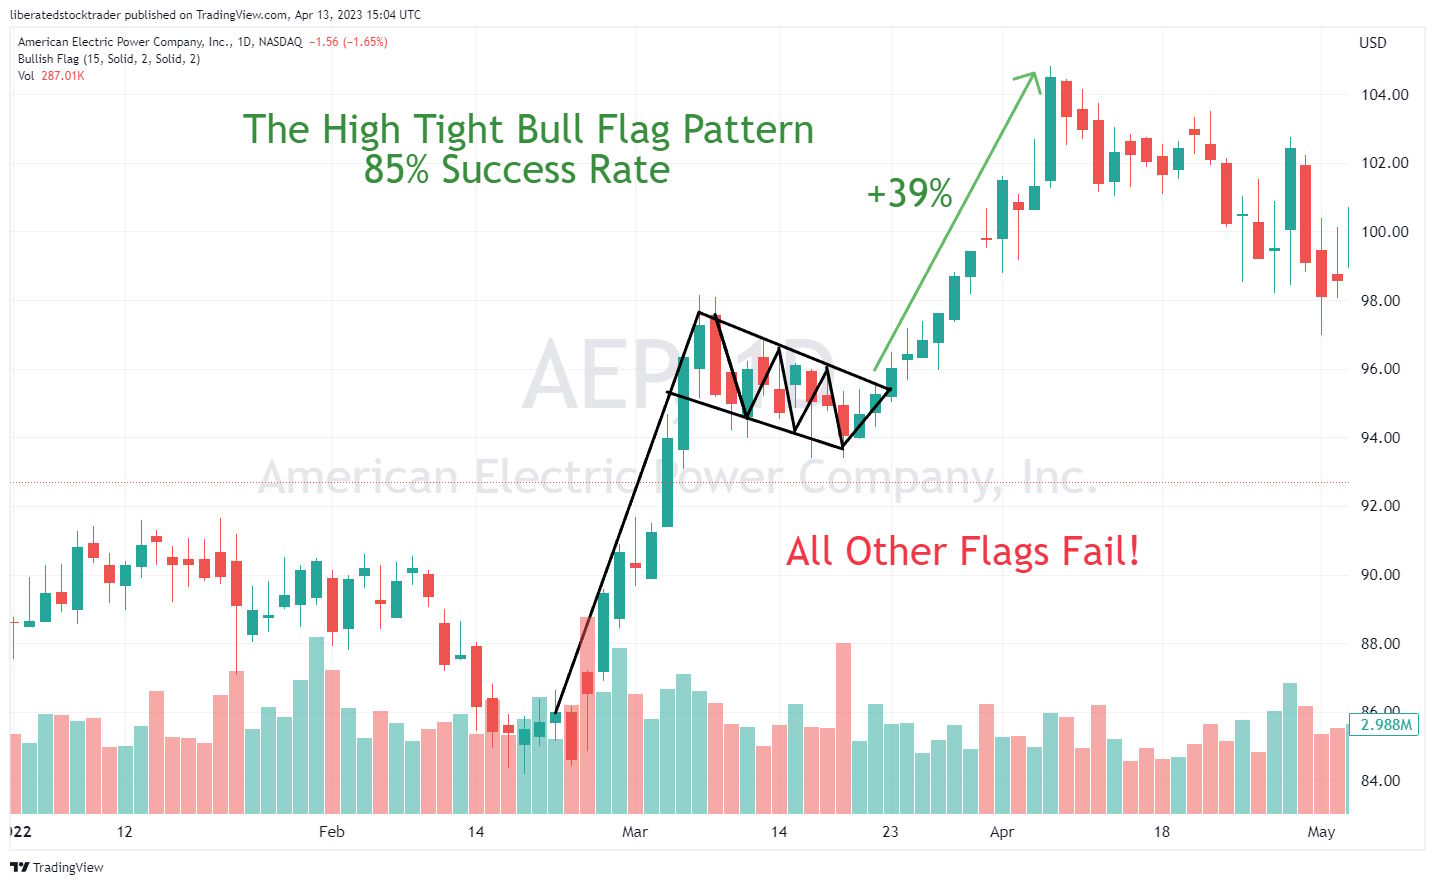
- Only the high-tight bull flag is worth trading, as it is 85% successful with a 39% average price increase.
What Is a Bull Flag Chart Pattern?
A bullish flag is a popular but misunderstood technical analysis pattern characterized by a rapid upward price trend followed by parallel downslope consolidation. The price increase resembles a flag pole, while the price consolidation is the flag.
The bull flag is a continuation pattern occurring during an explosive price increase, followed by a downward price consolidation. The price consolidation is caused by traders who profited from the strong trend taking profits and traders looking to short the stock.
Most flag patterns slope in the opposite direction from the previous trend, but some can be horizontal and resemble a rectangle pattern.
How Reliable is a Bull Flag?
A high-tight bull flag chart pattern has an 85% success rate on an upside breakout, achieving an average 39% profit in a bull market. If the bull flag is loose, the failure rate is 55%, with only a gain of 9%.
| Chart Pattern | Success Rate | Average Price Change |
| High Tight Bull Flag | 85% | +39% |
| Loose Bull Flags | 45% | +9% |
Source Research Courtesy of Tom Bulkowski@The PatternSite.com
Why Most Bull Flags Fail
There are three flag patterns: the bull flag, the bear flag, and the high-tight bull flag. Research on 1,028 trades shows that standard loose flag patterns have a failure rate of 55%. In contrast, a high tight bull flag pattern has a success rate of 85% with an average gain of +39%.* Source
To distinguish between reliably profitable bull flags (high-tight flags) and failing bull flags (loose flags), we must learn to identify them.
Identifying a Bull Flag Pattern
The key element of a bullish flag pattern is that it must occur after a strong upward move, which acts as the pole. It must be preceded by at least three large consecutive higher daily price closes. This is followed by a consolidation period, creating the flag part of the pattern.
The size and shape of the flag will vary, though usually, it is a downward-sloping channel or triangle with either two parallel trendlines or several lower highs and higher lows. The volume should diminish as the price consolidates, and the price should stay within the flag’s boundaries.
Once confirmed, a bullish breakout occurs when the stock closes above the upper trendline of the flag formation; this signals that buyers are willing to pay higher prices than before and that more buying could soon follow. The pattern is usually complete with a target projected equal to the flagpole height added to the breakout level.
Identifying a Failing Loose Bull Flag
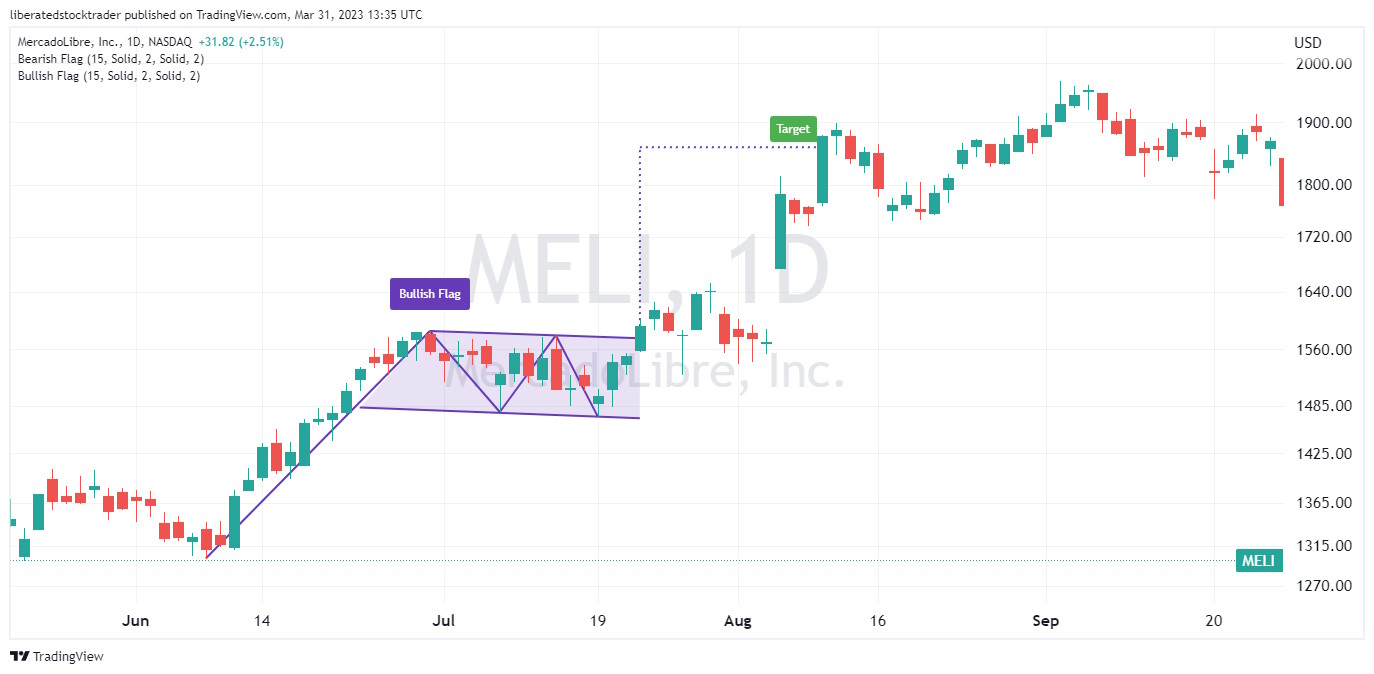
As defined in The Encyclopedia of Chart Patterns, a loose flag does not have an incredibly high/steep flag pole and is not tight; it is loose. The chart below is an example of a loose bull flag.

This bull flag chart has been autodetected using TradingView’s pattern recognition algorithms. Notice how the target price is automatically calculated.
Auto-detect this Chart Pattern with TradingView
Finding a Winning High-Tight Bull Flag
A high-tight flag is a bull flag where the flag pole moves nearly vertically, indicating buyers are willing to bid up the stock even if it’s at very high levels. The flag is tight, meaning there is a close-fought battle between buyers and sellers over a period of days. Finally, the buying pressure is so strong that the price breaks upwards, and an explosive rally averaging +39% ensues.
Is the Bull Flag a Continuation Pattern?
The flag pattern is a continuation pattern that usually follows a strong uptrend and signals that the price will continue moving in the same direction. To be considered a valid flag pattern, at least three points must be within the formation. The pattern is formed by two trendlines connecting a series of lower highs and lower lows.
After identifying the high-tight bull flag, look for a trend confirmation by watching for a price upside breakout out of the bull flag. If the security price breaks out above the bull flag resistance, especially with a volume increase, it signals a potential 85% chance of going higher. The American Electric Power Company (AEP) chart (above) shows a high-tight bull flag.
How To Trade It
When trading a bull flag chart pattern, traders should look for long entry opportunities. Generally, the best way to enter a trade is when the security price breaks out above the resistance of the bullish flag pattern. Traders may also consider placing stop-loss orders at or below the upper resistance line of the formation.
The target price for a successful bull flag trade is determined by measuring 50% to 80% of the flag’s length and applying it to the breakout price.
It is important to note that traders should wait for a confirmed breakout above the flag pole peak before entering into a trade, as false breakouts above or below the flag pattern can often occur.
Get this Chart with TradingView
When trading a bull flag chart pattern, be prepared to trade in the direction of the price breakout. Generally speaking, it is important to wait for at least three consecutive candles before entering the trade.
Traders should pay attention to volume when trading a bull flag chart pattern. Higher volume on the upward breakout is often considered a trend confirmation. This means traders should be vigilant and wait for higher volumes before entering a trade on any breakout situation.
The Psychology of Bull Flag Patterns
The psychology behind a bullish flag chart pattern is similar to that behind other continuation patterns, except that it is more volatile. It reflects the market’s strong commitment to continuing moving upward despite any short-term pullbacks. Traders should be aware of the previous trend and ensure it’s still intact before entering a trade.
This pattern typically appears in strongly trending markets, where the bulls (buyers) and bears (sellers) battle each other until the bulls eventually gain more strength.
Trading Timeframe
Bull Flags can form in any timeframe but occur more frequently in hourly and daily charts. Flags happen quickly and usually last no longer than three weeks.
What Happens After a Bull Flag Forms?
Two decades of research by Tom Bulkowski show that after a bull flag pattern is confirmed on a breakout, there is an 85% probability of a 39% price increase. Once the bull flag pattern is confirmed, traders should consider opening a long position.
What Happens with a Failed Bull Flag Pattern?
A bull flag in a bull market fails 15% of the time. When a bull flag pattern fails, the stock price fails to achieve the price target or reverses before reaching the height of the flag pole. At this point, it makes sense to discard the pattern.
Automatically Identifying Bull Flags
You can automatically identify bull flag patterns using TradingView. Go to TradingView and click Indicators > Technicals > Patterns. Next, select Bullish Flag Chart Pattern. Now, a chart with a bull flag pattern will be clearly marked.

Auto-detect Bull Flag Patterns with TradingView
Bull Flag Rules
- The bull flag patterns appear during powerful upward price moves.
- The flag pole should be near vertical.
- The flag should be tight with close price points.
- If the price breaks out lower, the pattern has failed.
Top Chart Pattern Scanners
Two trading platforms currently offer pattern scanning and screening: TrendSpider and FinViz. Finviz is a good free pattern scanner, whereas TrendSpider enables full backtesting, scanning, and strategy testing for chart patterns.
TrendSpider Chart Pattern Scanning
Scanning for chart patterns with TrendSpider is easy. Visit TrendSpider, select Market Scanner > All of the Following > Chart Pattern > Scan, and you will be presented with a list of stocks with bullish patterns.
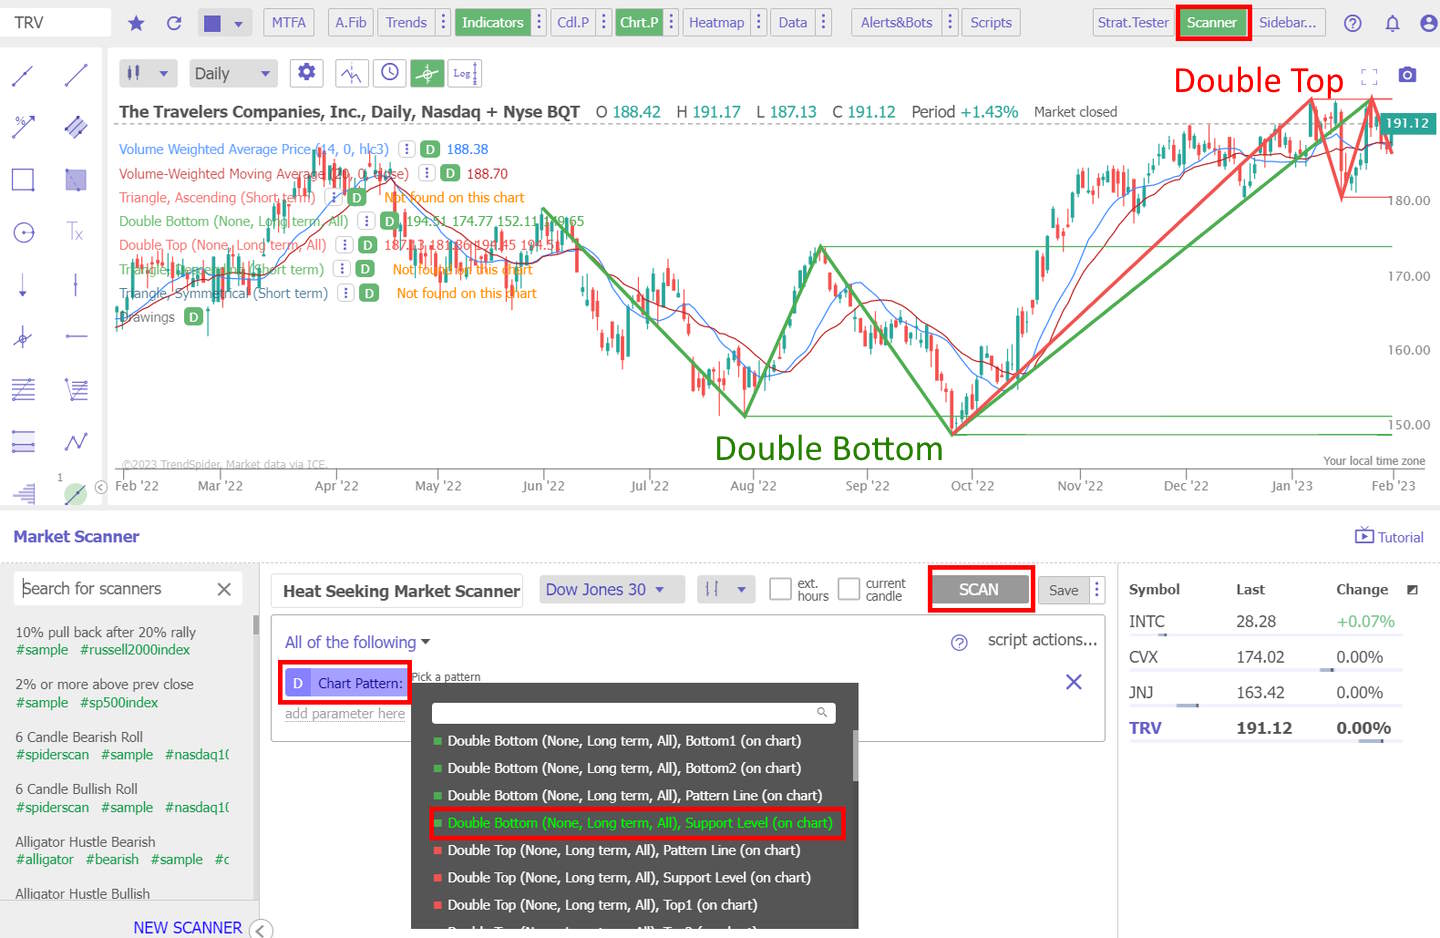
Scan for this Chart Pattern with TrendSpider
Using AI-Driven Technical Analysis
One of the major benefits of using AI-driven technical analysis tools like TrendSpider is the ability to backtest historical data. This allows traders to compare the performance of their strategy over different periods and markets. With TrendSpider, you can go back in time to find stocks exhibiting bull flag patterns and then use the platform’s advanced analytics tools to analyze how effective this pattern was for trading at any given time. TrendSpider’s AI-driven algorithms also help traders identify the most reliable entry and exit points for patterns.
TradingView 4.8/5⭐ : The Best Trading Platform I’ve Tested in 20+ Years
With lightning-fast charts, powerful pattern recognition, smart screening, backtesting, and a global community of 20+ million traders — it’s a powerful edge in today’s markets.

If you want one platform that gives you an edge, this is it.
Scan for Bullish Chart Patterns With FinViz
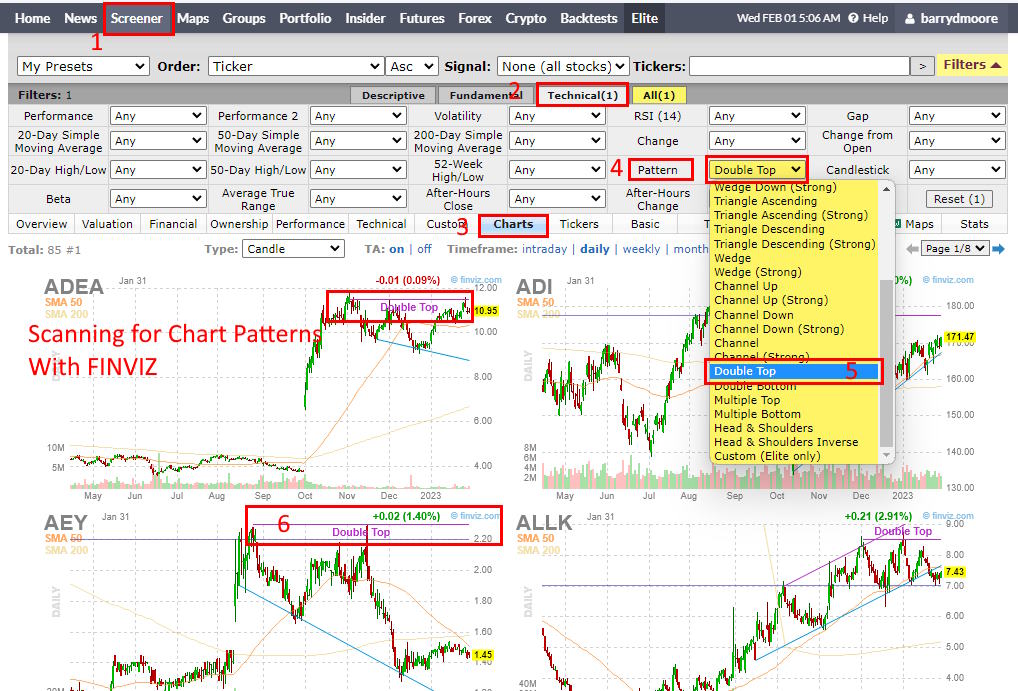
FinViz has a great feature for scanning for bull flag patterns. By selecting a bull flag as your scan criteria, you can easily find stocks exhibiting this pattern. This is especially useful to traders who want to monitor potential trading opportunities.
Scan for this Chart Pattern with FinViz
The first step to finding stocks with bullish patterns is to select a set of criteria. FinViz offers a range of pre-defined filters and sorting options, enabling traders to quickly narrow their search by sector, industry, market capitalization, and more. After selecting the desired criteria, traders can apply the filter to the Finviz screener.
Once the filter has been applied, traders can view the results on a chart interface. Depending on the complexity of their search criteria, several stocks may meet the criteria. By clicking on each stock name, traders can open a chart.
FAQ
How accurate is a bull flag pattern?
Published research demonstrates most bull flags fail 55% of the time, but a high-tight bull flag pattern is 85 percent accurate on an upward breakout in a bull market. Source: The Encyclopedia of chart patterns
Can a bull flag be bearish?
By definition, a bull flag pattern cannot be bearish. Flag patterns can be bullish or bearish, but a bull flag must be bullish because the price has to increase to complete the pattern. If the price decreases, the bull flag fails.
What is a high-tight bull flag?
A high-tight flag is a bullish pattern where buyers bid up the stock in a vertical direction, even at high levels. The flag is tight, with buyers and sellers in a close-fought battle for days. At last, the buying pressure is so strong that the price breaks upwards and averages a 39% rally.
Is a bull flag good or bad?
A high tight bull flag is a good reliable pattern with an 85% success rate and a 39% average increase. Do not trade loose bull flags, they have a 55% failure rate, and even if they succeed, they only average a 9% price increase.
What is the success rate of a bull flag?
According to Tom Bulkowski's research, the success rate of a high-tight bull flag is an 85 percent chance of a 39 percent price increase in a bull market on a continuation of an uptrend. Traders should remember that there is still a 15 percent false signal risk.
How do you target stop loss in bull flag patterns?
Traders should set the approximate target stop loss level in a bull flag at the point above the breakout of the bull flag. The exact percentage stop loss depends on the price target expectations and the timeframe.
What are the benefits of trading bull flags?
The primary benefit of trading a bull flag is that it can allow traders to enter the market at a low-risk point. The tight bull flag setup provides a very limited downside risk and usually produces strong returns when successful. Additionally, traders may be able to identify the target price before entering the trade, allowing them to manage their position better.
What are the risks of trading a bull flag?
The biggest risk of trading a loose bull flag is a 55% chance of the pattern failing. Traders must ensure they have identified a high-tight bull flag with a higher success rate, or the trade may fail.
Is a bull flag pattern profitable?
A high-tight bull flag pattern is a good signal for traders. It provides an easy and accurate way to identify potential buying opportunities creating high-probability trades. Tom Bulkowski's research confirms an accuracy of 85 percent for high-tight bull flag patterns with an average profit potential of 39 percent.
Can a bull flag fail?
Yes, most bull flags fail. The typical bull flag identified is a loose flag which is less than 50% successful. Traders need to clearly identify high-tight bull flags for success.
How reliable is a bull flag pattern?
The high-tight bull flag pattern is a reliable chart indicator, with success rates of 85 percent during a bull market. All other loose bull flags are much less reliable.
Do bull flags hold?
Yes, high-tight bull flag patterns hold 85 percent of the time, according to decades of research compiled by Tom Bulkowski in his book The Encyclopedia of chart patterns.
How to identify bull flags?
Bull flag patterns can be identified automatically with TradingView. Alternatively, you can manually identify it by looking for a shape price increase (flag pole) followed by a tight downward parallel price consolidation (flag).
How to measure a bull flag pattern?
TradingView can automatically measure a bull flag pattern to set a price target. Alternatively, to measure manually, use an arithmetic chart and plot the length of the flag pole. This distance will be the future price target which you should annotate on the chart in the direction of the breakout.
What is the best bullish chart pattern?
The inverse head and shoulders takes the crown as the most robust bullish pattern. During a bull market, this pattern boasts an 89 percent success rate, leading to an average price increase of 45 percent. This pattern could potentially generate impressive returns.
Is a bull flag a continuation or reversal pattern?
Bull flags are continuation patterns, meaning that the prevailing trend is expected to continue after the pattern is completed. The breakout of the flag can be used as a signal to enter into a long position.
What are the best chart pattern scanners?
The best chart pattern scanners are TrendSpider and Finviz. TrendSpider enables bull flag scanning, backtesting, and strategy development. Finviz enables quick and easy bull flag scanning and charting.
Why is a bull flag bullish?
A bull flag is bullish because it signifies a continuation of a powerful uptrend. This pattern forms when the price makes a sharp move up, followed by a period of consolidation, creating the shape of a flag with two parallel trendlines.
Learn the Success Rates of 65 Chart Patterns
The Encyclopedia of Chart Patterns by Tom Bulkowski details the reliability and success rates of 65 chart patterns and shows you how to trade them. It is an indispensable resource for traders and investors seeking to enhance their profitability by leveraging stock chart patterns. This comprehensive reference book provides in-depth explanations and detailed illustrations of over 65 different patterns, including Head and Shoulders, Double Tops, Wedges, Flags, Gaps, and more.
