Is the Shooting Star the best candle for traders, and how can we effectively trade it for profit? To find the truth, I tested 1,680 Shooting Star trades spanning 568 years.
Based on my 568 years of backtested data, the Shooting Star candle is profitable. It has a 57.1% upside success rate and an average winning trade of 3.6%. Each trade made using a shooting star nets an average of 0.56% profit.
The Shooting Star candle is bullish, not bearish, as most traders and mainstream finance publications would have you believe.
Research Results Summary
- The Shooting Star is a reliable candle. Its win rate of 57.1% is the second-best of all the candles I tested.
- The Shooting Star pattern is bullish, not bearish, predicting a price increase with 57.1% accuracy.
- The profit per trade is 0.51%, which equals the average profit across all candlesticks we tested.
- Our testing suggests the Shooting Star is the 7th most profitable candle pattern.
What Is a Shooting Star Candle?
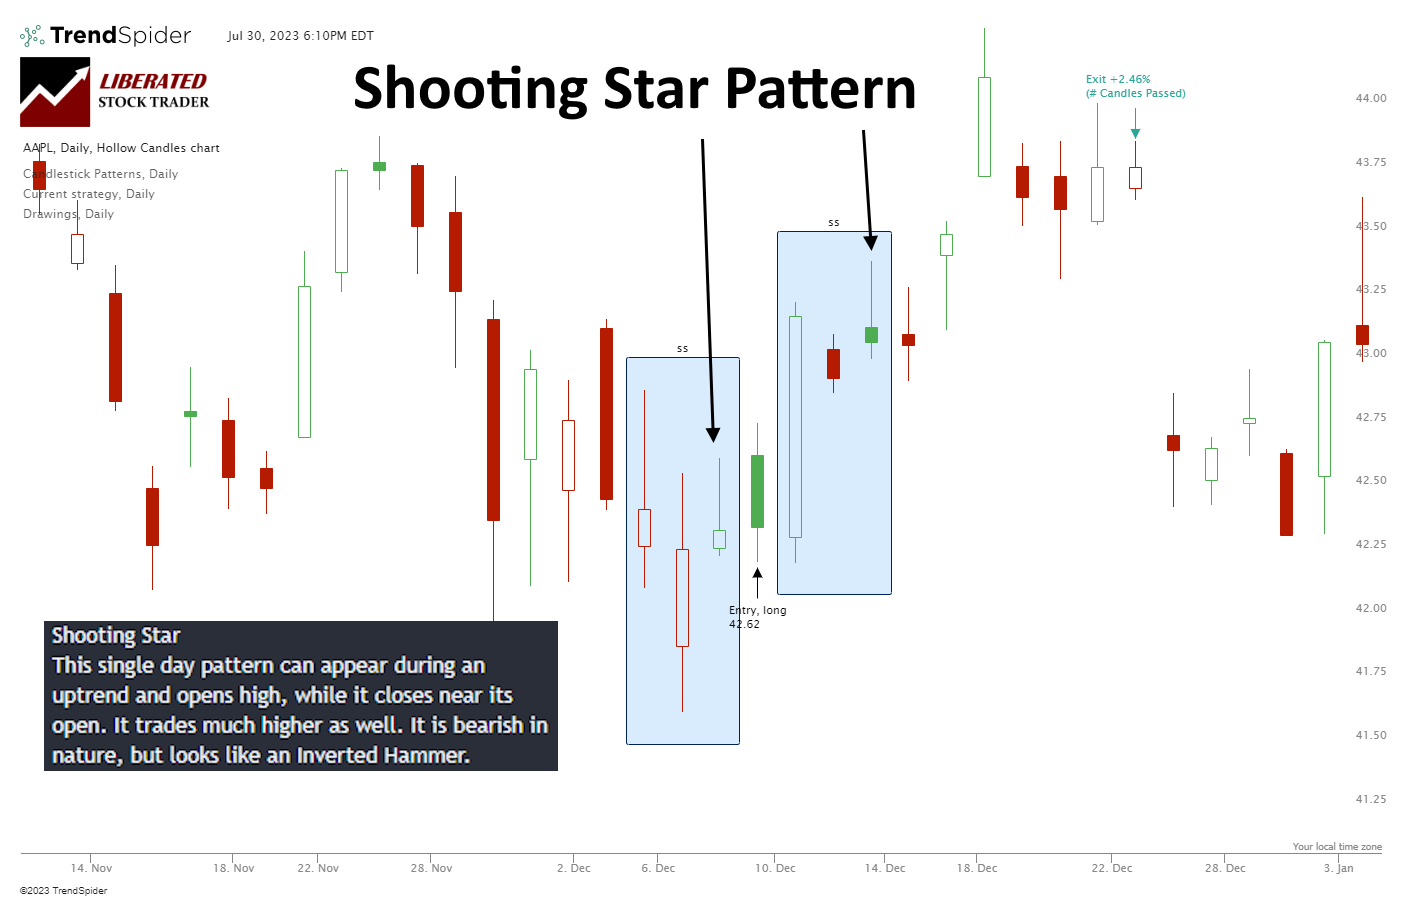
A shooting star candlestick is a bearish reversal pattern that appears during an uptrend. It is formed when the price opens near the high, rallies significantly, but then closes near its opening price or slightly lower. The candlestick resembles a shooting star with a small body and a long upper shadow.
The Shooting Star candle is a single candlestick formation in technical analysis that typically appears at the peak of an uptrend. It consists of a small body (near the low), followed by a long wick (or shadows) extending upwards above the body, with little or no wick below it. The Shooting Star shows that sellers have prevailed over buyers and can be interpreted as a bearish sign.
To understand a shooting star candle, imagine you’re looking at the night sky. A shooting star appears, thrusts upward with a brilliant flash, and then quickly fades away, returning to where it started. It’s a very similar scenario in the stock market.
A shooting star candle is formed when the stock price opens at a certain point and then skyrockets upward, creating a long line (or shadow) above a small star-like shape (the candle’s body). But, like a shooting star, the price doesn’t hold its height. It falls back down, closing near where it opened.
This pattern supposedly signals that the stock may be about to drop or reverse trend; hence, it’s a signal that traders should watch out for.
Although a lesser-known pattern in Japanese candlestick analysis, does the Shooting Star deserve greater recognition among traders? Based on our extensive testing, yes.
Identifying a Shooting Star Candle
The shooting star candlestick pattern resembles a tiny body with a long upper shadow and little to no lower shadow. It appears during an uptrend and signifies a potential trend reversal. Imagine a candlestick with a small body and a long wick shooting upwards.
To identify the Shooting Star pattern, look for an uptrend, a small candle body with a long upper wick and little to no lower wick. This indicates that buyers could not push the price further, signaling potential selling pressure and a trend reversal.
- Look for an uptrend: The shooting star candle typically forms during an upward price movement.
- Check the candlestick: Locate a candlestick with a small body near the top of the price range.
- Observe the upper shadow. It should be significantly longer than the body, at least twice its length.
- Assess the lower shadow: The shooting star usually has little to no lower shadow.
- Analyze the closing price: The candle’s closing price should be near the opening price or slightly lower.
TrendSpider 4.8/5⭐: My Pick for AI-Power & Auto-Trading
I’ve used TrendSpider for 7 years for my research and testing. It auto-detects trendlines, patterns, and candlesticks, backtests ideas, and lets you use AI to create unique strategies and launch trading bots—with no code.

Save 38% on TrendSpider
Our Top Rated 4.72 ⭐ Trading Tool
✅ Leader in AI Trading & Chart Pattern Recognition
✅ Scanning & Auto-Trading
Deal Ends In:
A Shooting Star’s Psychology
The psychology behind the shooting star candle pattern lies in the battle between buyers and sellers. This pattern occurs during an uptrend and signifies a potential shift in sentiment from bullish to bearish. Let’s delve deeper into the psychology at play:
- Initial Optimism: At the beginning of the trading day, buyers are in control, pushing prices higher as they are confident in the upward trend.
- Increased Buying Pressure: As the day progresses, more buyers enter the market, driving prices even higher. The momentum continues to strengthen, creating a sense of optimism among traders.
- Resistance and Reversal: However, as prices reach a certain level, the sellers start to sense an opportunity to sell and take profits. They step in, creating resistance and limiting further upward movement.
- Failed Breakout Attempt: Despite the sellers’ intervention, the buyers’ attempt one final push to break past the resistance level and continue the uptrend, resulting in a higher opening price for the candlestick.
- Loss of Momentum: However, as the trading day progresses, the buying pressure begins to wane. The sellers become more assertive and start selling aggressively, causing the price to decline.
- Bearish Reversal Signal: At the end of the trading day, the candlestick closes near or below its opening price, forming a small body with a long upper shadow and little to no lower shadow. This formation represents the shooting star candle pattern and signals a potential uptrend reversal.
A Shooting Star candle’s formation suggests sellers have taken control, and a bearish trend may follow. Traders often view this pattern as a signal to consider taking short positions or selling.
But is this a correct assumption? Our decades of research suggest this theory is incorrect. Interestingly, the Shooting Star pattern is very bullish.
Shooting Star Explained With Data
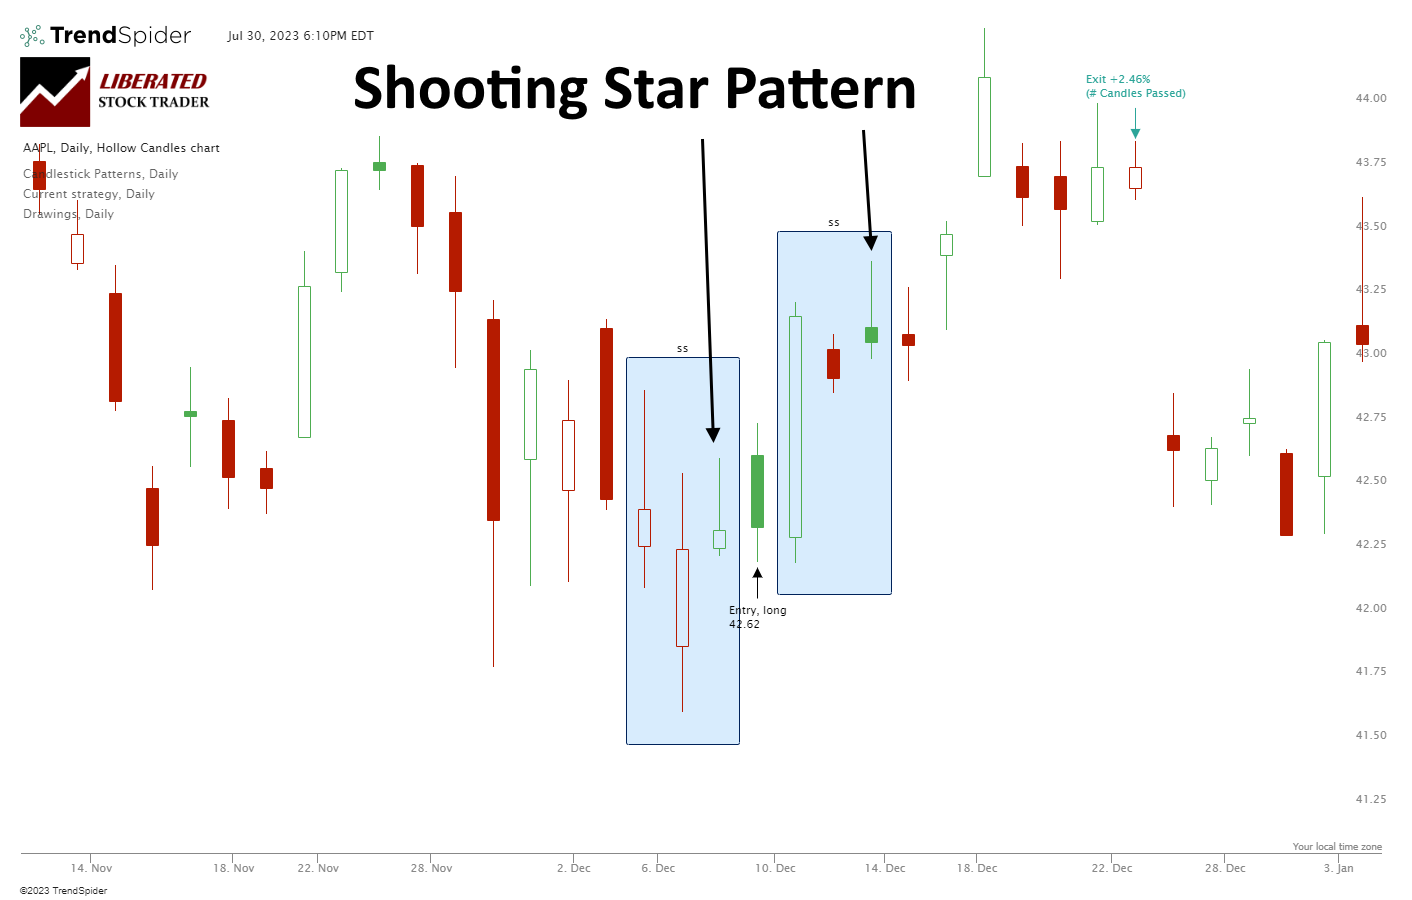
The data suggests that a Shooting Star candle can occur during an uptrend or downtrend and can be a reversal or continuation pattern. The image below shows two Shooting Star candles: one occurs during a downtrend, thus reversing the price decline, and one occurs shortly after during an uptrend, signifying a continuation.
The data does not support the theory touted by mainstream financial websites that the Shooting Star candle is a reversal pattern. 57.1% of Shooting Star candles produce a 3.4% profit over the next ten days. This also means that 42.9% of the time, it produces a -3.2% loss or a -3.2% gain if you short the trade.
Our testing shows the Shooting Star candle indicates bullish sentiment but results in weak bullish moves over the next ten trading days.
Trading a Shooting Star Based on Data
When trading Shooting Star candles, it is important to wait for the next day’s open and observe the price direction before making a trade. Our tests show that a Shooting Star candle has a 57.1% chance of a 3.4% profit over the next ten days. If you improve your entry and wait for confirmation before trading, you can increase this profitability.
While the Shooting Star signifies a bearish end to the trading day, this does not guarantee the next day will be negative; it suggests that 57.1% of the time, the next ten days will be a bullish uptrend.
Auto-Trade Candles with TrendSpider
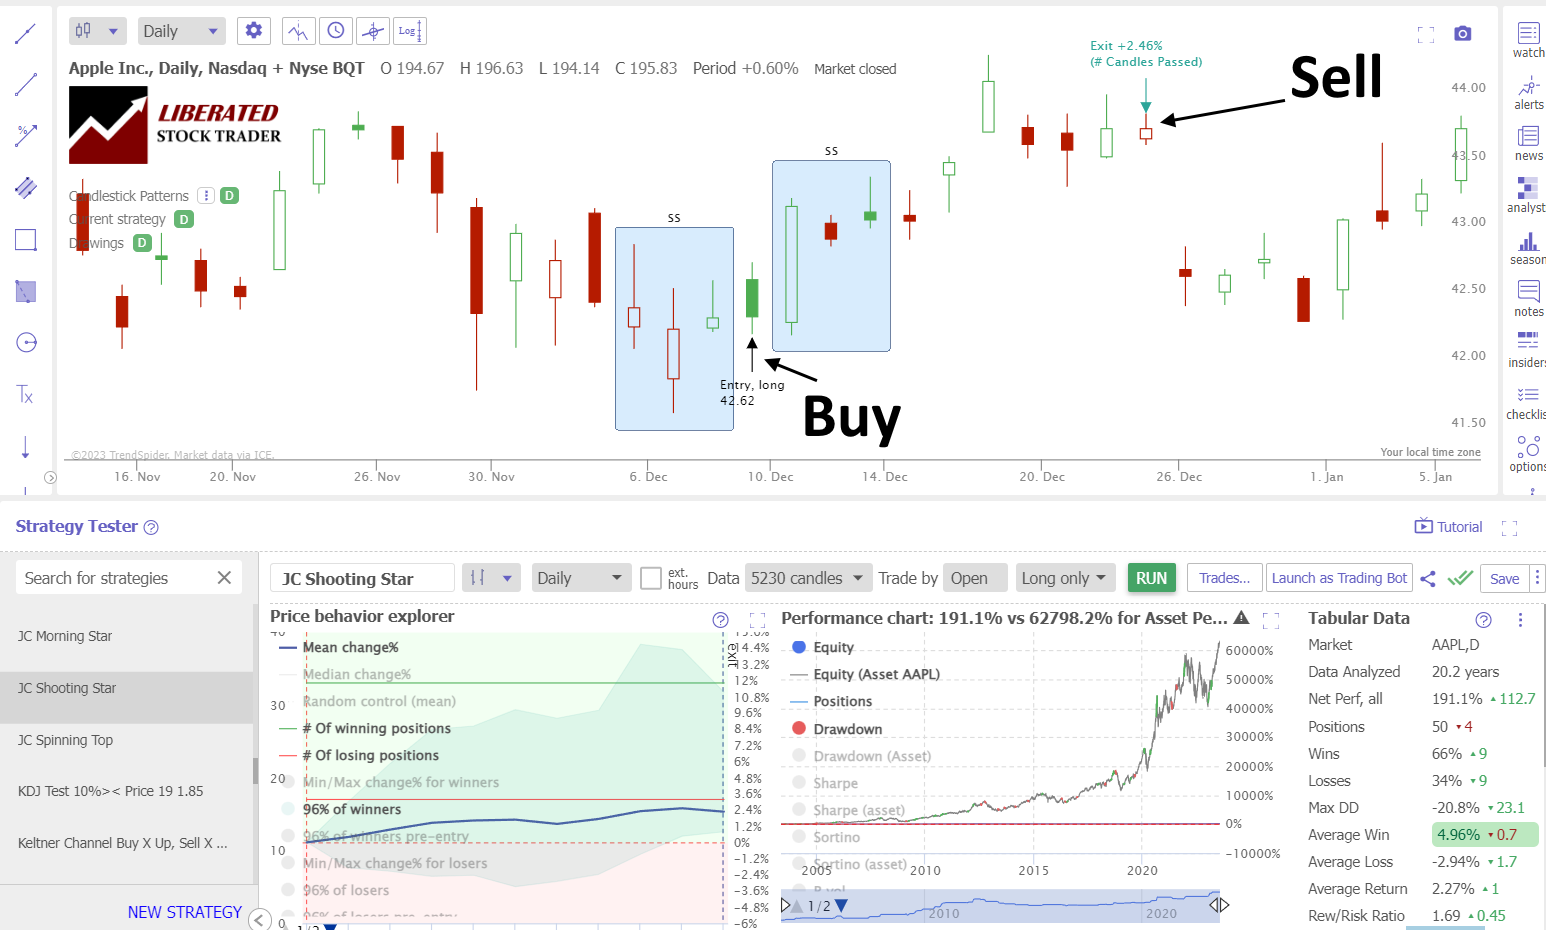
Trading the Shooting Star: Apple Inc. 20-Year Test
Our backtesting data on Apple Inc. (above) shows 50 trades in Apple Inc. Each trade was ten days long, and 66% were winning trades. This is proof that the Shooting Star candle is bullish.
Thanks to TrendSpider’s strategy tester, we can see the Shooting Star’s 66% win rate and profit of 4.96% per winning trade. The average gain across all winning and losing trades was 2.27%, which is excellent.
This also demonstrates that what asset you trade (Apple Inc.) is just as important as how you trade (chart indicators or patterns). The long-trade profitability of Apple Inc. is significantly higher than that of other stocks due to its long-term uptrend.
Enhancing a Shooting Star Trading Strategy
When employing the Shooting Star trading strategy, it’s advantageous to incorporate reliable companion indicators like the Relative Strength Index (RSI), Rate of Change (ROC), VWAP, or Weighted Moving Average. These techniques can enhance your overall trading strategy, improving quality and efficiency. It is crucial to personally test these methods, ideally with the assistance of TrendSpider, to truly experience their benefits.
MY Shooting Star Candle Testing Methodology
Using TrendSpider, I tested 30 Dow Jones Industrial stocks over 20 years, which amounted to 3,735 Shooting Star trades and 568 years of data. The Shooting Star candle must be fully formed to enter a trade, and the buy signal must be executed at the next trading day’s open price. Each trade was exited at the open exactly ten days later.
- Pattern: Shooting Star
- 30 DJIA Stocks
- Daily Chart
- Strategy: Buy Long
- Test Period: 2003 to 2023
- Buy at the next open
- Exit after ten days
- Pattern Recognition performed by TrendSpider
Backtesting the Shooting Star Candle
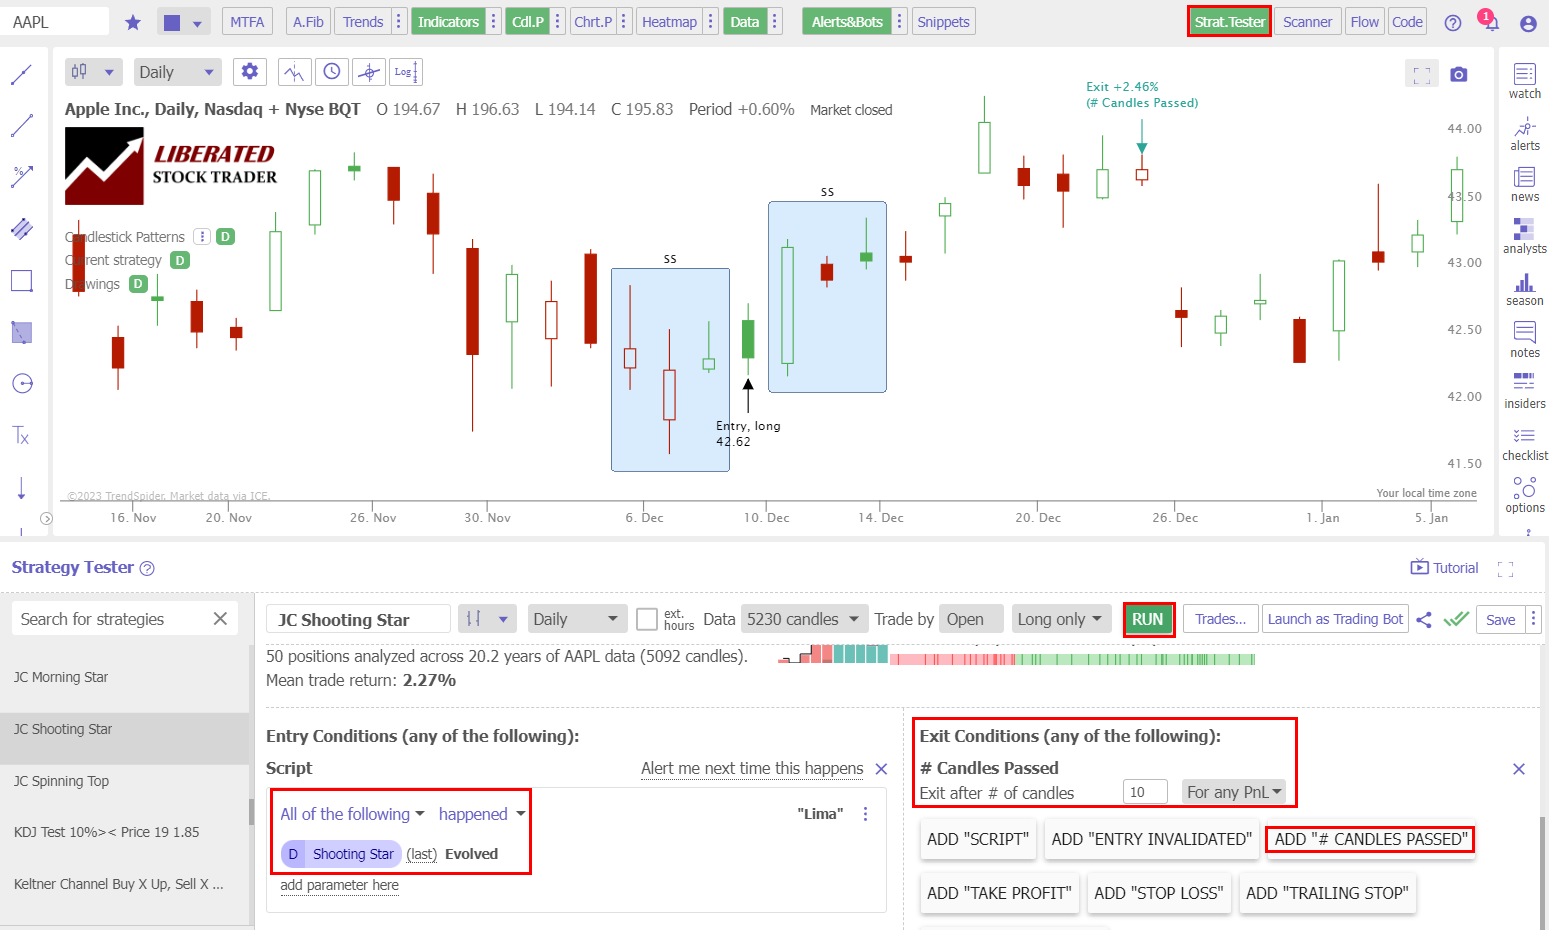
Using TrendSpider for trade identification and execution gives fast and precise results. To evaluate candlestick patterns and strategies independently, follow the instructions below and check out the screenshot for reference.
- Register for TrendSpider.
- Buy Signal: Select Strategy Tester > Entry Condition > Add Parameter > Condition > Candlestick pattern > Shooting Star > Evolved.
- Sell Signal: Add # Candles Passed = 10.
- Click “RUN” to execute the backtest.
Backtesting Done with TrendSpider
Testing Results
After conducting 1,680 trades based on 568 years of data, I confirm that the Shooting Star profit per trade is 0.56%. A 0.56% win rate means trading a Shooting Star long will net you an average of 0.56% profit per trade if you sell after ten days. Conversely, short-selling a Shooting Star, you should expect to lose -0.56% per trade. This proves this pattern is bullish.
The percentage of Shooting Star winning trades was an impressive 57.1%, the 2nd best candle I have tested, and significantly higher than the 55.8% average performance across all candlestick types. The Max Drawdown was -25%, versus the stock’s drawdown of -59.3%, which shows less volatility than a buy-and-hold strategy.
The average winning trade was 3.4% over ten days, and the average losing trade was -3.2%; this represents a tight spread profit margin. But when combined with 57.1% winning trades, the reward/risk ratio turns out to be a good 1.12:1
The reward-to-risk ratio of 1.12 is the 3rd highest of the 25 candles we tested. We have only observed higher Reward/Risk ratios in our testing of “The most successful chart patterns.”
Shooting Star Candle Test Results Summary
For every long trade you make after a Shooting Star appears on a daily stock chart, on average, you should make 0.56% after holding for ten days. This result makes the Shooting Star the 7th best candlestick pattern to trade.
One of the best candlesticks for trading is the Inverted Hammer, with a profit per trade of 1.12%. The Bearish Engulfing and Bearish Marubozu candles also outperform the Shooting Star pattern.
Table: Shooting Star vs. Hammer Performance
Our combined testing of 568 years of data shows that the Shooting Star candle is a good performer, with an average win rate of 0.56% per trade and a win rate of 57.1% on bullish trades.
| Test Results | Shooting Star |
| Data Analyzed (Years) | 568 |
| # Trades | 1,680 |
| Wins | 57.1% |
| Losses | 42.9% |
| Max Drawdown | -25.4% |
| Max Drawdown (Asset) | -59.3% |
| Average Win | 3.4% |
| Average Loss | -3.2% |
| Average Return Per Trade | 0.56% |
| Reward/Risk Ratio | 1.11 |
| Sharpe Ratio | 0.00 |
| Sortino Ratio | 0.31 |
My groundbreaking research into the profitability and success rates of chart patterns and technical indicators is built on the most powerful backtesting platforms available. If you want to design original, profitable trading strategies, our exclusive review of the best backtesting software will help you find the perfect solution to give you a real edge in the markets.

Is a Shooting Star Candle Bullish or Bearish?
Our extensive testing reveals that the Shooting Star pattern is bullish. Our original analysis of 1,680 trades shows a 57.1% tendency toward bullishness and a 42.9% bearish bias.
Is a Shooting Star a Reversal Pattern?
Our test data shows that the Shooting Star does not show a clear reversal or continuation pattern. Testing confirms Shooting Star candles occur during uptrends and downtrends, but they do not exclusively signal a price reversal; they can also be continuation patterns.
Does the Shooting Star Candle Work?
Yes, the Shooting Star candle works well in trading, producing a 57.1% success rate. This performance is in the top half of the leaderboard; we rank it 7th out of all candles, with a 0.56% average profit after ten days. If you sell it short, it will average a -0.56% loss.
Is a Shooting Star Candle Accurate?
Yes, a Shooting Star candle is the 2nd most accurate candle pattern to trade. It results in 57.1% of trades winning and 2.9% losing. The average winning trade is 3.6%, and the losing trade is 3.4%. Using a Shooting Star candle is an advantage in trading.
Can the Shooting Star Candle be used for Buy & Sell Signals?
Yes, our data shows that Shooting Star candles can be used for buy-and-sell signals, but the Inverted Hammer or Bearish Marubozu are better alternatives. These candles are more reliable and profitable.
Is a Shooting Star Candle Reliable?
Yes, the Shooting Star is reliable. According to 1,680 tested trades, it is 57.1% reliable for bullish trades. Its mid-table average profit is 0.56%, and the average winning trade was 3.6% over ten days.
Summary
In conclusion, Shooting Star is a reliable and profitable pattern in Japanese candlestick analysis. Its accuracy is 57.1%, resulting in a profit per trade of 0.56%; it is one of the best-performing candlestick patterns.
All traders would benefit from investing in a comprehensive trading training course to help them make more informed decisions while managing their risks properly. So why not check out Liberated Stock Trader’s advanced investing course today?
FAQ
How can I automate finding candlestick patterns?
You can automate candlestick pattern recognition using specialized software like TrendSpider, or TradingView. These tools enable you to identify and analyze existing patterns and create custom patterns for automated trading and backtesting.
What is a shooting star candle?
Contrary to popular belief, our data shows the shooting star candlestick pattern is not a bearish reversal pattern appearing at the end of an uptrend. It is 57.1% bullish and can occur during an uptrend or downtrend.
How do I identify a shooting star candle?
To identify a shooting star candlestick pattern, look for a candlestick with a long upper tail and a small body near the bottom of a price range. It resembles a shooting star falling to Earth.
What is the best software for trading shooting star candles?
TrendSpider is the best software for trading all candle patterns due to its powerful point-and-click backtesting and pattern recognition. TradingView is a great alternative for those trading non-US markets.
What does a shooting star candlestick pattern indicate?
Mainstream websites like Investopedia suggest a Shooting Star indicates a potential market shift from bullish to bearish. Our 568 years of market data testing suggests it's a 57.1% bullish pattern, with an average winning trade of 3.6%.
When should I use a shooting star candlestick pattern?
You can use a shooting star candlestick pattern optimally when you spot it at the end of a downtrend, as it suggests an oversold asset undergoing a battle for supremacy between bulls and bears.
Is the shooting star candlestick pattern reliable?
Based on 1,680 tested trades, the Shooting Star has a 57.1% reliability rate for bullish trades, making it a dependable option. Its average profit of 0.56% falls in the middle range, and the average winning trade yielded a 3.6% return over 10 days.
Can the shooting star candles be used in different markets?
The shooting star candlestick pattern could be applied to various financial markets, including commodities and forex. Theoretically, the principles are the same, but the currency and commodity markets are rangebound, whereas stocks have no upper limit. I advise you to perform your own research using TrendSpider.
Is the Shooting Star candle profitable?
Yes, the Shooting Star is the 7th most profitable candle pattern we tested. Our research shows an average return of 0.56% per trade. However, the Inverted Hammer's 1.12% is superior.
How can I use shooting stars in my trading strategy?
To use the shooting star candle in your trading strategy, combine it with indicators such as the relative strength index (RSI) and rate of change (ROC). My research has proven these indicators highly successful.
What are the limitations of the shooting star candle?
The shooting star candle is limited because it can only predict at a 57.1% accuracy up to 10 days ahead. To make longer-term predictions with higher probabilities, look at our 12 Accurate Proven Chart Patterns Research.
Can the shooting star candlestick pattern be used for day trading?
Yes, the shooting star candlestick pattern can be used in day trading strategies, but you need to expect lower success rates and higher losses. One thing is true across my decades of backtesting charts: the smaller the time frame, the less predictable the market.
What candle patterns are better than the shooting star?
Several candlestick patterns are better than the shooting star candle, such as the Inverted Hammer, Bearish Engulfing, or Bearish Marubozu, all with higher average returns per trade.
What software automatically detects Shooting Star candles?
All testing in this research article has been performed with the superb TrendSpider, which automatically detects all candlesticks, including Engulfing candles. See all options in our Candlestick Pattern Recognition Software Testing.