The Wyckoff Method is a comprehensive approach to stock market analysis that has endured and remains a cornerstone of technical analysis.
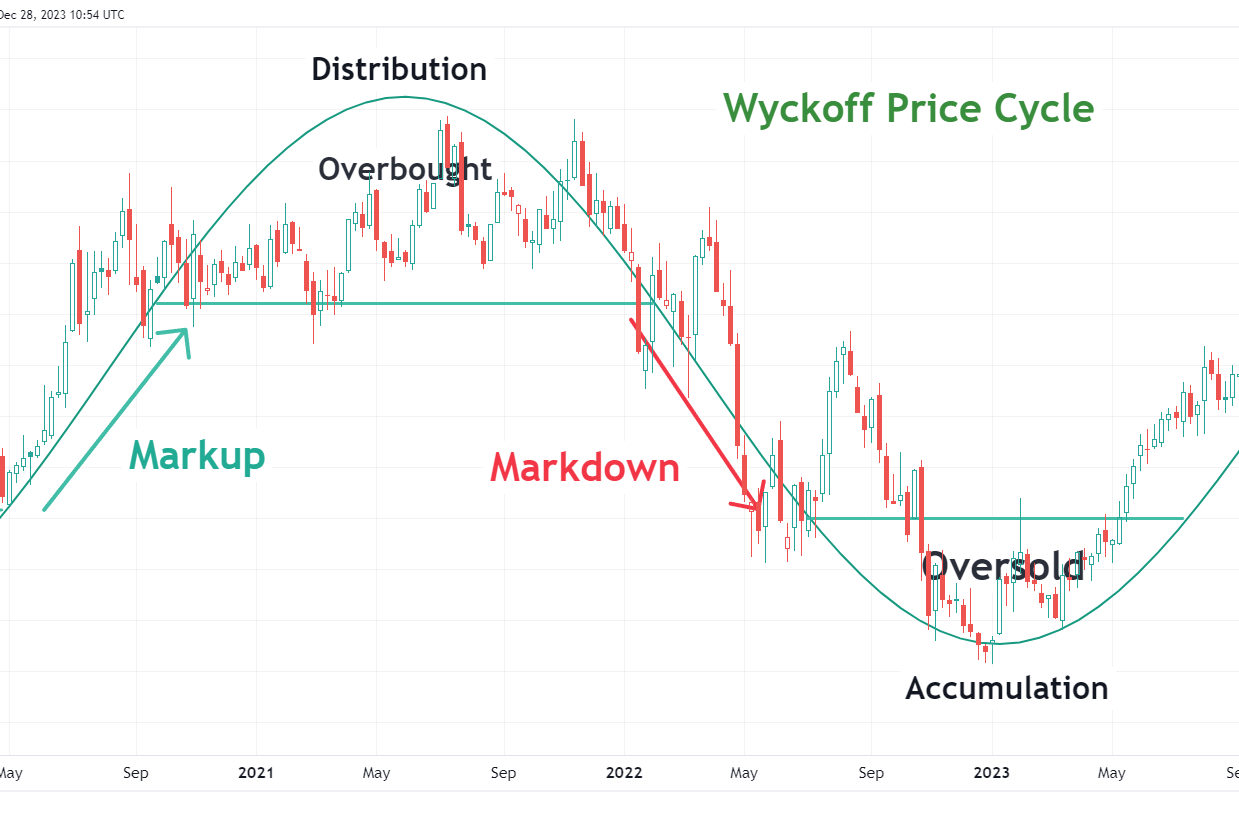
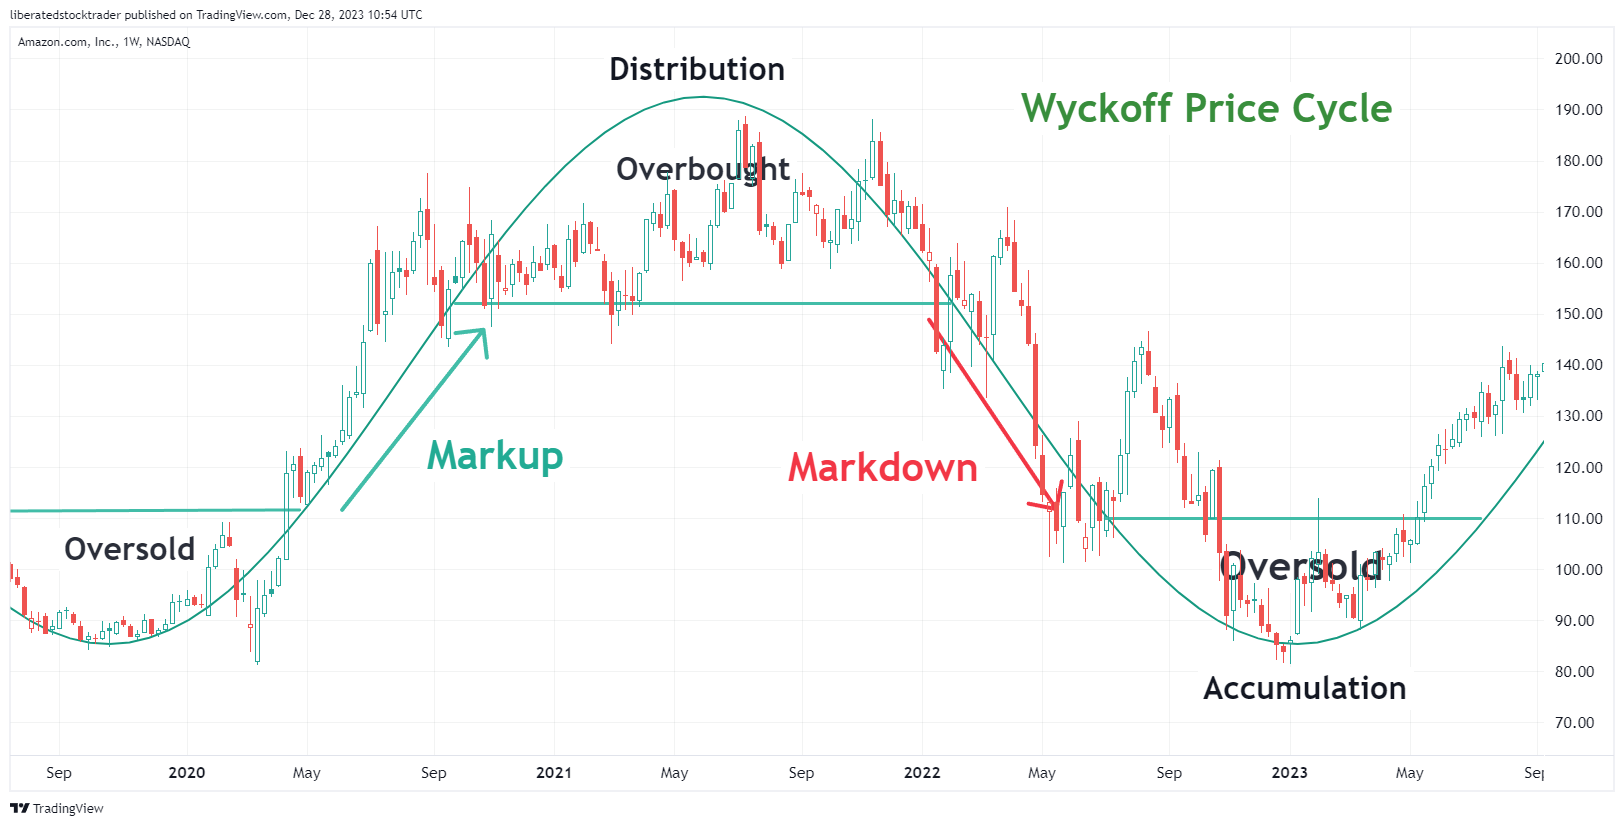
Wyckoff’s strategy revolves around the concept of market cycles, which include accumulation, markup, distribution, and markdown phases.
By recognizing these phases, traders can align their investments with the market’s larger trend. Additionally, Wyckoff introduced a five-step approach to determine the market’s current position and probable future trends and timing trades to coincide with these projections.
Key Takeaways
- The Wyckoff Method offers a time-tested approach to understanding market trends through price action and volume analysis.
- Market cycles and phases are central to Wyckoff’s strategy, aiding in the prediction of price movements.
- A five-step analytical approach guides investors in structuring their trades according to the market’s predicted path.
Historical Background of the Wyckoff Method
Richard D. Wyckoff began his journey in the stock market as a broker and later founded his brokerage firm. His deep analysis and keen observation of market dynamics led him to codify the Wyckoff Method set of trading principles. Widely recognized for his educational efforts, Wyckoff dedicated much of his life to teaching these principles, which he initially disseminated through the Stock Market Institute—an entity he founded to educate traders.
The Wyckoff Method’s Influence on Modern Trading
The Wyckoff Method has influenced countless traders and investors. Its core concepts, including identifying supply and demand dynamics and interpreting price movements, remain integral to modern trading strategies. The Wyckoff Method also emphasizes the psychological aspects of trading, underscoring the importance of mental discipline alongside methodical market analysis.
Fundamental Principles of the Wyckoff Method
The Wyckoff Method is built upon three cardinal laws that govern the financial markets: the Law of Supply and Demand, the Law of Cause and Effect, and the Law of Effort versus Result. These laws guide traders and investors in interpreting price movements and market trends.
Law of Supply and Demand
The Law of Supply and Demand asserts that the price of a financial instrument will trend upward when demand exceeds supply and downward when supply surpasses demand. The Wyckoff Method scrutinizes the relationship between buying and selling in the markets to anticipate directional price moves. For instance, if there is a clear indication of increasing demand without a commensurate increase in supply, one can expect the price to rise.
- Demand > Supply: Increased price
- Demand < Supply: Reduced price
- Demand = Supply: Price equilibrium
Law of Cause and Effect
The Law of Cause and Effect helps identify potential price movements based on the construction of price consolidations, referred to as “the cause.” In contrast, the subsequent price movement is termed “the effect.” By applying Wyckoff’s schematics and methodologies, traders can measure the cause and appraise the proportional effect, which is the expected price move.
- Cause: Price consolidation (building the base for a move)
- Effect: Subsequent price movement (the breakout or breakdown from consolidation)
Law of Effort vs Result
Finally, the Law of Effort versus Result provides insight into the efficiency of price movements in relation to the volume. When significant effort, as indicated by volume, results in a proportionally small move in price, it suggests an imbalance, often indicating a potential reversal or a weakening trend.
- High Effort + Small Result: Potential trend weakness or reversal
- Low Effort + Large Result: Efficient market movement, trending market
Understanding these fundamental principles can effectively apply the Wyckoff Method to analyze and interpret market behavior.
TradingView 4.8/5⭐ : The Best Trading Platform I’ve Tested in 20+ Years
With lightning-fast charts, powerful pattern recognition, smart screening, backtesting, and a global community of 20+ million traders — it’s a powerful edge in today’s markets.

If you want one platform that gives you an edge, this is it.
Core Components of the Wyckoff Method
The Wyckoff Method is built upon the detailed observation of price, volume, and time indicators to discern the likely future direction of the market. Understanding these core components enables traders to align with the prevalent market trend and capitalize on the phases within the market cycles.
The Role of Price Volume and Time
Price, volume, and time are the pillars of the Wyckoff Method, which offers insight into the supply and demand dynamics driving the markets. Volume is a powerful indicator of the strength behind a price move, with high volume suggesting stronger conviction among traders. A significant price change on minimal volume may indicate a lack of commitment to the current trend, hinting at a potential reversal or consolidation.
While often overlooked, time is a key factor in determining market cycles and their phases. By analyzing how long an asset spends in the accumulation or distribution phases, traders can gauge the maturity of the current trend and anticipate potential changes.
Understanding Market Structure: Trends and Ranges
Understanding market structure is critical for effectively applying the Wyckoff Method. Trends are directional movements in price, and the Wyckoff Method identifies two primary trends: the bullish markup phase and the bearish markdown phase. Between these trending periods, consolidation or ranges frequently occur, manifesting as periods where the price moves sideways as supply and demand reach equilibrium.
Ranges hold valuable information for traders; a range that forms after a downtrend could signify accumulation, while a range after an uptrend may suggest distribution. These ranges are foundational for recognizing shifts in the market trend and setting the stage for the next market cycle phase.
Get the Wyckoff Strategy Indicator on TradingView
Analyzing Market Cycles: Accumulation and Distribution
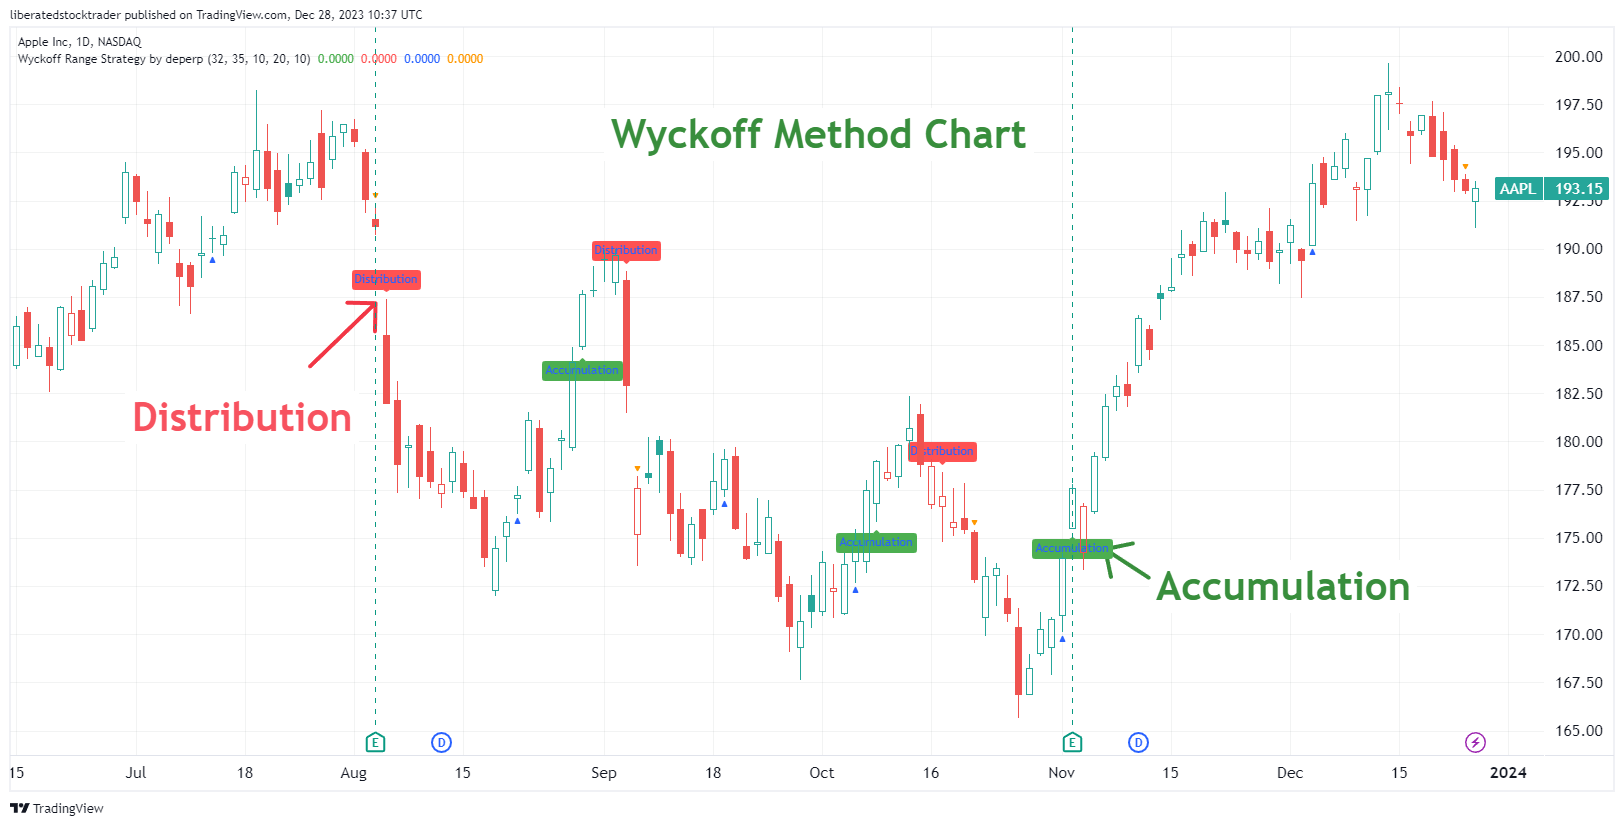
The Wyckoff Method delineates market cycles through distinct phases: accumulation, markup, distribution, and markdown. During the accumulation phase, informed traders gradually acquire shares, usually after a bear market or a downtrend, without causing a significant uptick in price. Conversely, during the distribution phase, these traders sell their holdings at elevated prices as the market peaks, leading to a subsequent decline.
Understanding these cycles is central to the Wyckoff Method, allowing traders to synchronize their trades with the Wyckoff market cycle. Spotting the transition from accumulation to markup or distribution to markdown equips traders with the potential advantage of entering or exiting the market before the majority perceives the shift in the prevailing market trend.
The Five-Step Analytical Approach
Developed by Richard D. Wyckoff, the Wyckoff Method provides a robust framework for traders to understand and anticipate market trends. It consists of a five-step approach crucial for conducting technical analysis with precision.
Determining the Present and Potential Future Market Direction
The initial step in the Wyckoff Method is to assess the market’s current position and likely trajectory. Here, traders analyze stock prices to determine if the market is in a phase of accumulation or distribution. This involves examining price action, volume, and other market indicators to predict whether a stock is poised for an upward trend (markup) or a downward trend (markdown).
Defining Opportunities with High Reward-to-Risk Ratios
Once the market direction is understood, traders apply specific rules and principles of the Wyckoff Method to identify trading opportunities with favorable reward-to-risk ratios. The risk involved in potential trades is weighed against the expected reward. By focusing on assets showing signs of strength or weakness that align with the overall market assessment, traders can enhance their chances for success.
Selecting the Best Assets to Trade
The final step involves meticulously selecting assets based on their alignment with the determined market trend and their potential to offer high rewards with controlled risk. Traders rely on Wyckoff’s rules to analyze asset stock prices and their relative strength within the market to handpick the candidates most likely to follow the anticipated trend. The objective is to implement a trading strategy that capitalizes on identified opportunities while minimizing exposure to downside risk.
The Phases of the Wyckoff Method
The Wyckoff Method delineates specific phases the market undergoes, allowing traders to interpret supply and demand dynamics. These phases are essential to identify buying and selling opportunities by observing price action and volume.
Get the Wyckoff Strategy Indicator on TradingView
Accumulation Schematics
Accumulation is the initial phase of the Wyckoff Method, where informed investors begin to buy, creating a base in the market. This phase typically involves a Selling Climax (SC), where excessive supply causes rapid price decline, followed by an Automatic Rally (AR) triggered by an influx of buying. Then, a Secondary Test (ST) revisits the price range of the SC to test the demand. Here, the market may also witness a Spring, a price dip below the support level that shakes out weak holders.
- Phase A: The market finds a bottom as the Selling Climax and Automatic Rally set the bounds of the trading range.
- Phase B: Here, the market is testing, with attempts to approach the resistance levels, but without clear direction.
- Phase C: During this crucial phase, the Spring or a shakeout occurs, often the last opportunity to buy at lower levels before the trend reverses.
Distribution Schematics
Conversely, distribution signifies a period when informed investors begin unloading their positions. This stage usually mirrors the accumulation schematic but in reverse, showing a Buying Climax (BC) interrupting the uptrend with significant selling, followed by an Automatic Reaction (AR) and a Secondary Test (ST) against the highs.
- Phase A: Establishes the ceiling as the Buying Climax brings overbought conditions. The Automatic Reaction and Secondary Test confirm the upper limits of the price range.
- Phase B: Price moves within the range, with less upward progress, signaling that the market struggles to go higher.
- Phase C: The market often experiences an Upthrust—similar to a Spring in accumulation—indicating a possible breakdown and the beginning of a bear market.
Advancing to Markup and Markdown
Once the market progresses beyond the initial accumulation and distribution phases, it enters the Markup or Markdown phases. During markup, the price ascends outside the trading range established in the accumulation phase. It signifies greater demand than supply, leading to an uptrend. On the other hand, markdown occurs post-distribution when supply outweighs demand, leading to a downtrend.
- Markup Phase: Characterized by a series of higher highs and higher lows, moving past previous resistance levels and generally following the uptrend established after a successful accumulation phase.
- Markdown Phase: Defined by lower lows and lower highs, descending past previous support levels and typically occurring after the distribution phase has set the stage for a downtrend.
Trading Strategies Based on the Wyckoff Method
The Wyckoff Method encompasses a series of principles and strategies empowering traders to navigate financial markets by recognizing the intentions of larger market players, often referred to as the ‘composite man.’ It emphasizes understanding supply and demand dynamics, the actions of institutional investors, and deciphering trading volume in conjunction with price movements.
Trade Entry and Exit Points
Determining precise trade entry and exit points is one of the cornerstones of the Wyckoff Method. Traders look for indications of accumulation or distribution phases, considering the level of supply and demand. An example of an entry point is during the ‘back up’ phase, where the price, after an initial rise during accumulation, comes down to test new support levels—preliminary support—with reduced volatility. It may signal a strong entry opportunity if demand still overrides supply. Exit points are often spotted during distribution when the price peaks, and LPsy—the last point of supply—is apparent, suggesting an imminent decline.

Try the Wyckoff Strategy Indicator on TradingView
Setting Stop-Losses and Targets
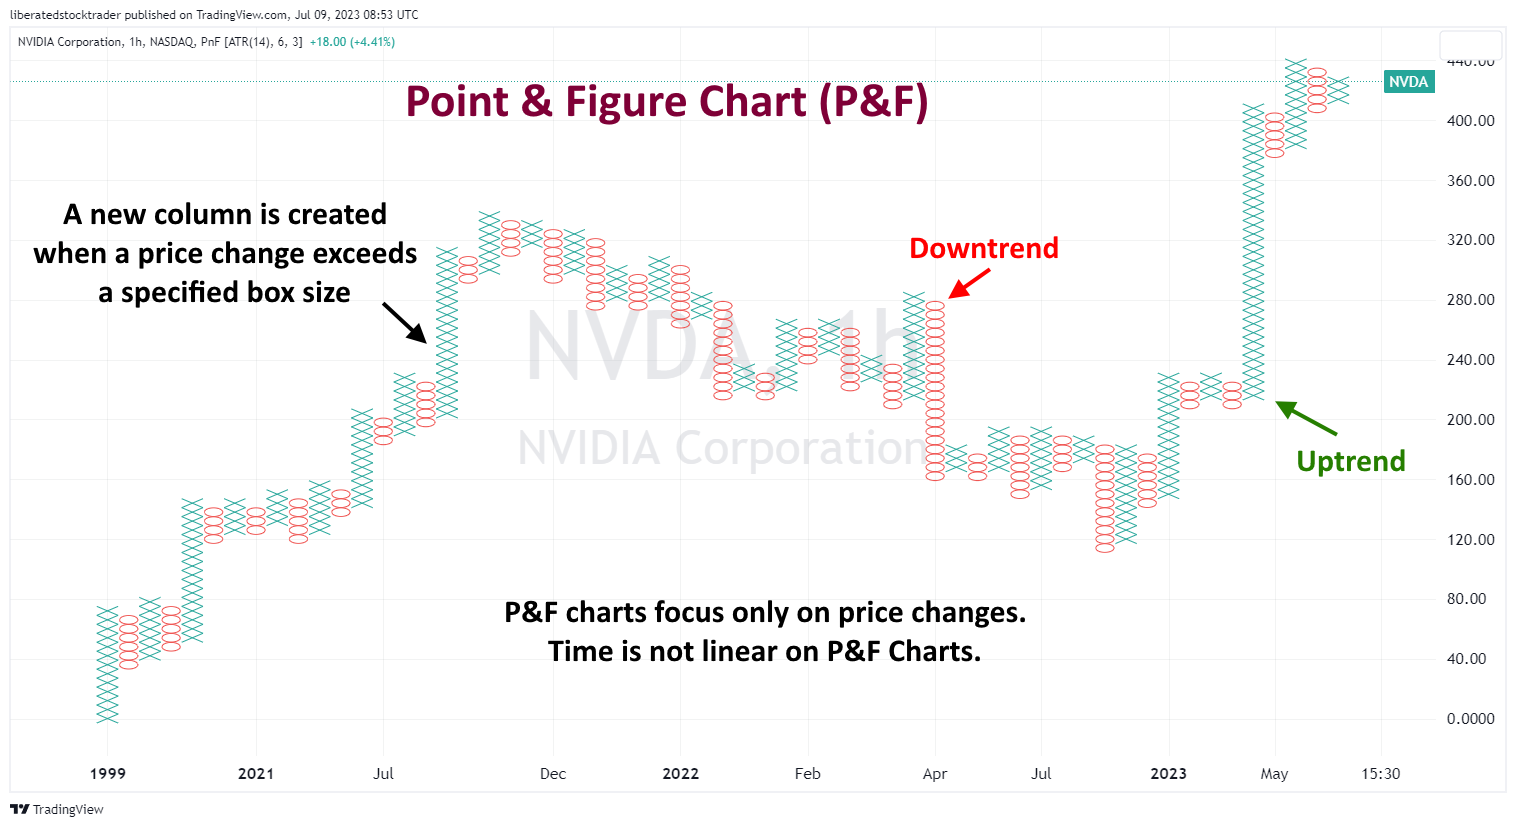
Strategic use of stop-loss orders is paramount in Wyckoff’s method to protect against significant losses. Traders might place stop-loss orders just below accumulation areas or support levels identified during the accumulation schematic. Conversely, stop-losses could be placed just above the distribution area during distribution phases. For setting price targets, Point and Figure (P&F) projections are utilized to determine the potential extent of a move, allowing traders to secure profits before the trend reverses or market conditions change.
Position Sizing and Trade Management
Successful application of Wyckoff’s theory involves prudent position sizing and trade management—key elements in mitigating risk and maximizing returns. Traders manage positions by considering the relationship between their potential targets and required stop-losses, adjusting position sizes to balance potential risks. Managing trades may also involve following the ‘composite man’—which could be interpreted as the market behavior influenced by smart money—and adjusting positions accordingly to align with the fundamental laws of supply and demand and the probable actions of institutional investors and market makers.
Interpreting Wyckoff’s Price Volume Relationship
Understanding the correlation between price action and volume is crucial in the Wyckoff Method. This relationship is a powerful tool for assessing the market’s underlying strengths or weaknesses.
Volume Spread Analysis in Action
Volume Spread Analysis (VSA) evaluates the chart’s volume and price spread to discern the balance between supply and demand. If a security experiences a wide price spread and high volume, it signals strong interest from traders and institutions. For example, when the volume bars are significantly higher than average during a price advance, demand is in control, and the prices are likely to continue rising. Conversely, if the market shows a wide price spread but lacks volume, it may indicate a lack of conviction in the price movement, signaling potential weakness or reversal.
Detecting Accumulation and Distribution
Wyckoff’s methodology emphasizes identifying periods of accumulation and distribution—key phases where the market’s largest players make their moves. When a stock is in the accumulation phase, the volume may increase as savvy investors begin to buy shares. Yet, the price action does not reflect substantial moves; this can be seen as a coiling spring storing energy for a potential upward breakout.
On the other hand, distribution typically takes place after a prolonged price ascent; volume bars may stay elevated while the price starts to flatten or fall, indicating that the stock is potentially being offloaded by larger investors preparing for a downtrend. Analyzing volume alongside price movements during these phases allows traders to make more informed decisions.
Wyckoff Method in Various Markets
The Wyckoff Method provides a comprehensive framework for understanding market cycles across different financial markets. Its principles, which focus on the interplay of supply and demand, are pivotal in discerning trend directions, whether in stocks or cryptocurrencies.
Applying Wyckoff’s Principles to the Stock Market
In the stock market, Wyckoff’s methodology is celebrated for its ability to forecast future price movements by identifying accumulation and distribution phases. Traders scrutinize price action and volume to discern the positions of large investors – often termed the ‘Composite Man.’
For instance, the Point and Figure (P&F) projections are precise tools to set price objectives. According to the Wyckoff method, stocks often undergo preparation periods known as ’cause,’ which should precede a proportionate market move or ‘effect.’ This means selecting stocks with a ’cause’ matching or exceeding the trader’s minimum profit target.
Get Free Point & Figure Charts on TradingView
The Method’s Effectiveness in Cryptocurrency Trading
According to a strategy in TradingView called the Wyckoff Range Strategy, this method returns a profit factor of $1.839 for every dollar traded. It had 49.17% profitable trades across 120 trades on the Bitcoin/Tether pair.
While distinct in its volatility and market structure, the cryptocurrency market responds to the Wyckoff Method’s principles. Phases of accumulation and distribution, similar to those in the stock market, can be observed in crypto assets.
The method’s versatility allows for adjustment to the crypto market’s swift pace and, amidst the market’s high volatility, may provide a structured approach to identify potential turning points. It should be noted, however, that given the relative novelty and fast-moving nature of cryptocurrency markets, traders often combine Wyckoff’s approach with other analytical tools to enhance decision-making.

Learning from the Masters: Wyckoff, Livermore, and More
Wyckoff’s work laid the groundwork for modern technical analysis. To truly grasp the method’s potential, one must study Wyckoff’s theories alongside those of contemporaries like Jesse Livermore. Livermore’s aggressive trading style gained him fame and fortune, and his strategies aligned with Wyckoff’s principles, especially the focus on price action and market psychology.
FAQ
What are the principles of the Wyckoff Method in trading?
The Wyckoff Method revolves around identifying supply and demand dynamics to predict price movements. Traders look for accumulation and distribution patterns as they adhere to three fundamental laws: the Law of Supply and Demand, the Law of Cause and Effect, and the Law of Effort versus Result. These principles guide traders in assessing market direction.
How can one identify Wyckoff schematics and interpret them in price charts?
Wyckoff schematics are identified by recognizing patterns representing accumulation and distribution phases. Traders interpret price charts by analyzing the relationship between volume and price movements to confirm these patterns, aiding in assessing the stock's readiness for a bullish or bearish trend.
What are the key indicators used in the Wyckoff Method?
The key indicators include price volume, trend lines, and relative strength. These indicators help determine the position within the market cycle and identify the potential for upcoming price moves. Through the analysis of these indicators, traders can align with the market's larger participants.
What is reaccumulation within the Wyckoff framework?
Reaccumulation is a pause within an uptrend, where large operators consolidate their positions before continuing the previous trend. In the Wyckoff framework, this is seen as a period where the price range is relatively narrow, with volume diminishing, indicating that a continuation of the uptrend is probable.
What are the four distinct phases of a Wyckoff price cycle?
A Wyckoff price cycle comprises four phases: Accumulation, Markup, Distribution, and Markdown. Accumulation is where large players gather positions at low prices, followed by the Markup, where prices rise. Distribution is where selling occurs at high prices, and Markdown happens when the prices decline.
How to apply the Wyckoff Method to improve market analysis?
Traders can apply the Wyckoff Method by using its principles to identify high-probability trade setups. This includes determining the stock's current position in the market cycle, assessing the strength of the prevailing trend, and efficiently identifying the presence of accumulation or distribution by large market participants to time entries and exits.