Is the Bearish Harami worth trading? In test it proved to be the sixth best cable pattern in terms of reliability and profitability.
My research shows that the Bearish Harami and Bearish Harami Cross are profitable patterns. Based on 1,136 years of data, the Bullish Harami has an average profit per trade of 0.48%, and the Harami Cross has an average profit of 0.57%.
In this guide, I’ll show you exactly how to spot it, confirm it, and trade it with confidence.
I analyzed 5,624 Harami trades, spanning an incredible 1,136 years of historical data. Brace yourself to master Harami trading supported by reliable, proven, and time-tested data.
RESEARCH SUMMARY
- The Bearish Harami Cross is the 6th most reliable candle pattern in our testing, with a win rate of 57%.
- The average Bearish Harami Cross winning trade is 3.6%, and the average profit across all trades is 0.57%.
- The Bearish Harami is less reliable, with a lower win rate of 56.2% and a profit per trade of 0.48%.
- Across 5,738 trades, a Bearish Harami Cross beats a Bearish Harami in performance and profitability.
- The Bearish Harami Cross is the better choice for trading and is a top-performing candle pattern.
What is a Harami Candle?
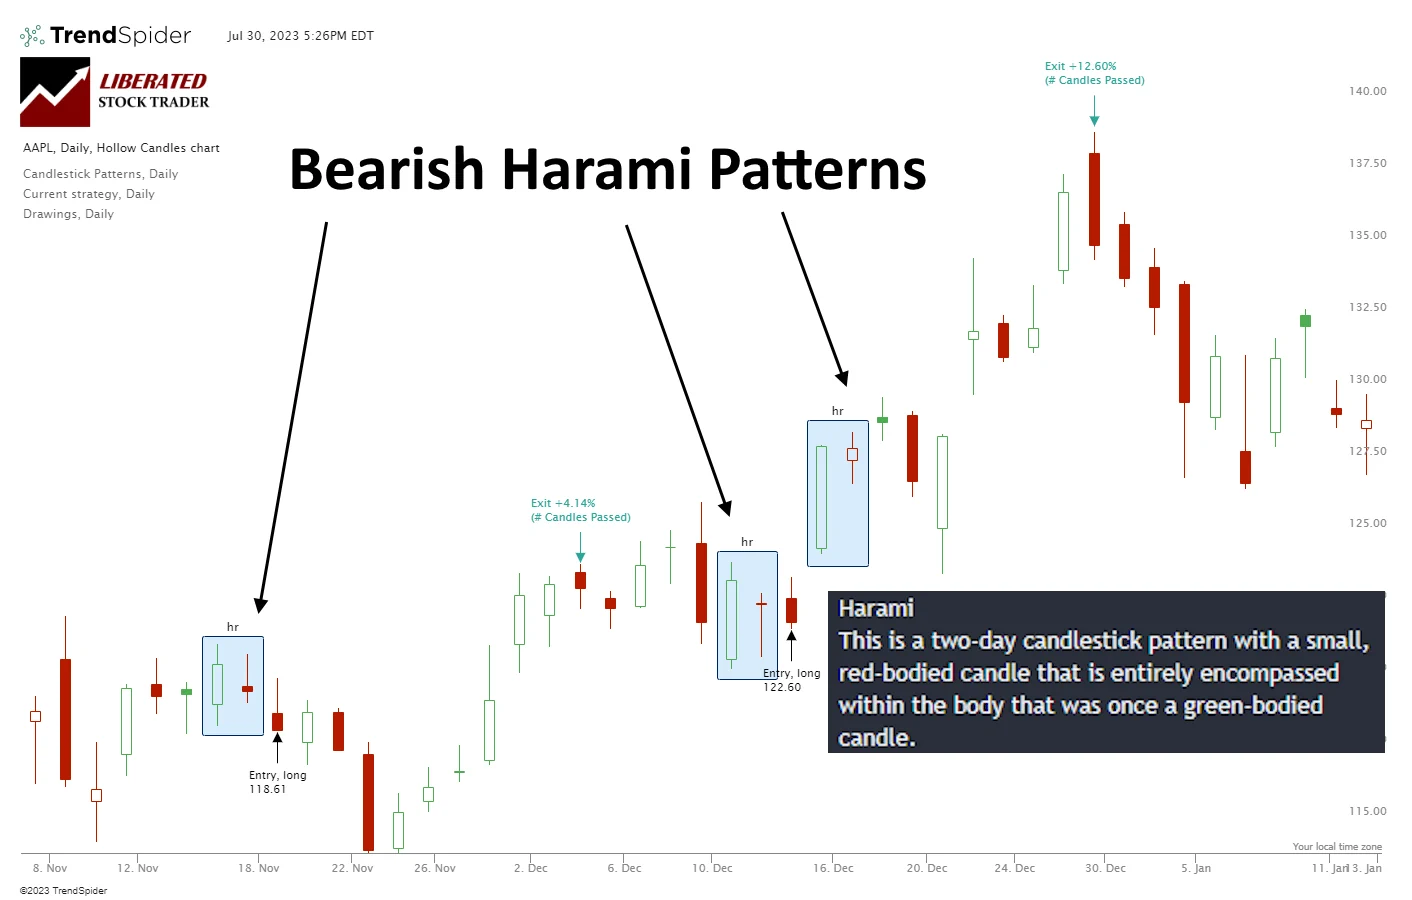
A Harami candle is a two-candle pattern defined by a long candle that engulfs the subsequent smaller candle. “Harami” originates from the Japanese word for “pregnant,” signifying the second candle’s concealment within the first one.
There are four types of Harami, the Bearish Harami, Bearish Harami Cross, Bullish Harami, and Bullish Harami Cross, all with different performance profiles, characteristics, and trading approaches.
This article will explore the Bearish Harami and the Bearish Harami Cross.
The History of Harami Candles
The Harami pattern is an established form of technical analysis, first developed in Japan and popularized by the rice traders of the Yodoya trading firm. The Bearish Harami was believed to be a reliable indication of an impending downward trend. As such, it gained popularity with traders in the early days of trading.
Today, the Harami is used by technical analysts across the globe to identify a potential reversal in trend. It is also used to confirm an existing trend or to generate trading signals.
TrendSpider 4.8/5⭐: My Pick for AI-Power & Auto-Trading
I’ve used TrendSpider for 7 years for my research and testing. It auto-detects trendlines, patterns, and candlesticks, backtests ideas, and lets you use AI to create unique strategies and launch trading bots—with no code.

Save 38% on TrendSpider
Our Top Rated 4.72 ⭐ Trading Tool
✅ Leader in AI Trading & Chart Pattern Recognition
✅ Scanning & Auto-Trading
Deal Ends In:
Bearish Harami vs. Bearish Harami Cross
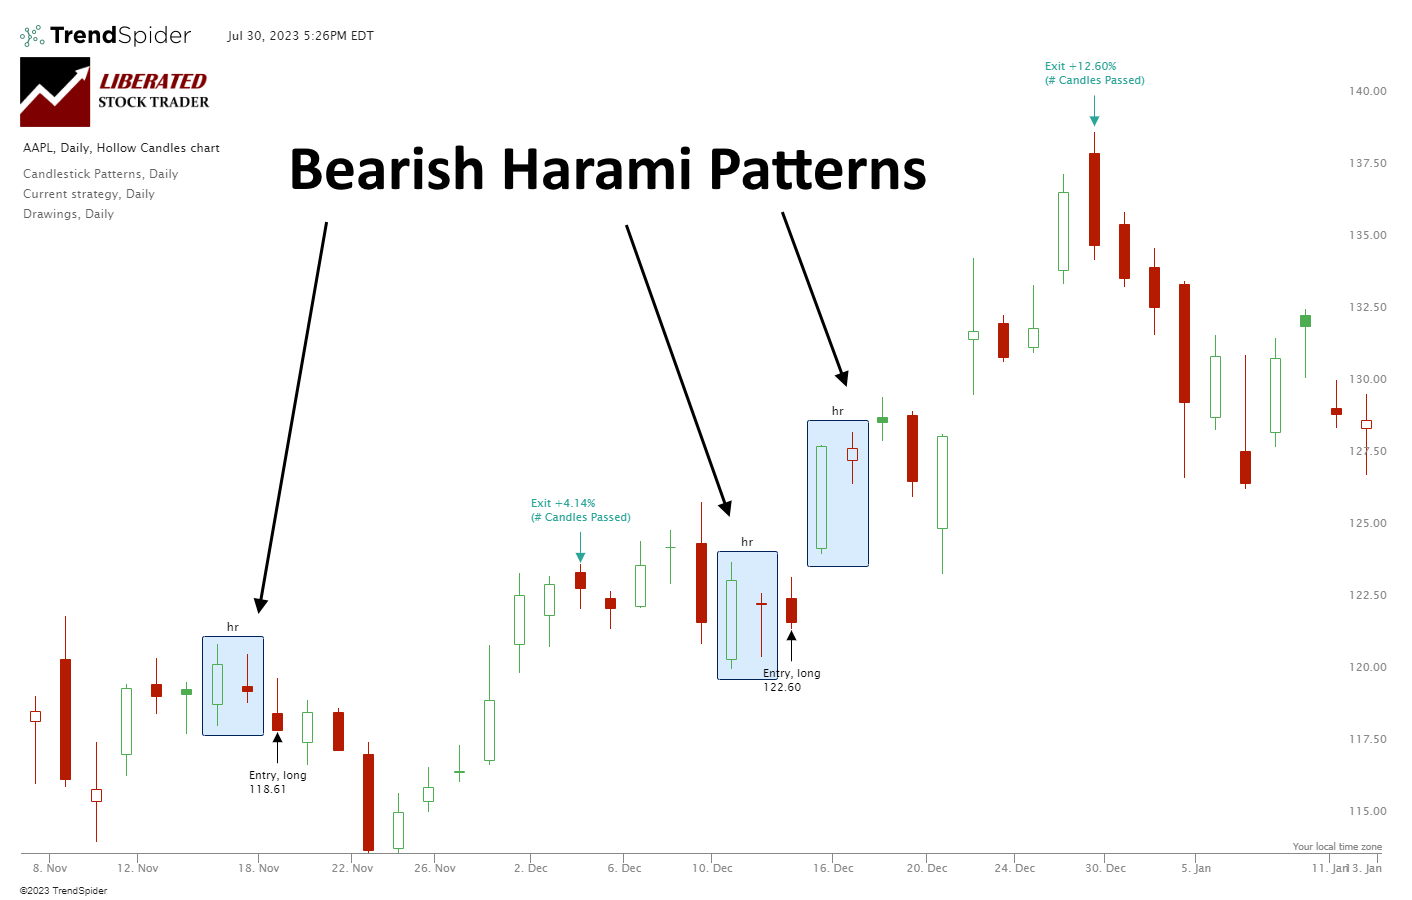
The Bearish Harami is a two-candle formation composed of a larger bullish candle followed by a smaller bearish candle. It signals that the current trend may be reversing from bullish to bearish (hence the name) and suggests selling opportunities for traders.
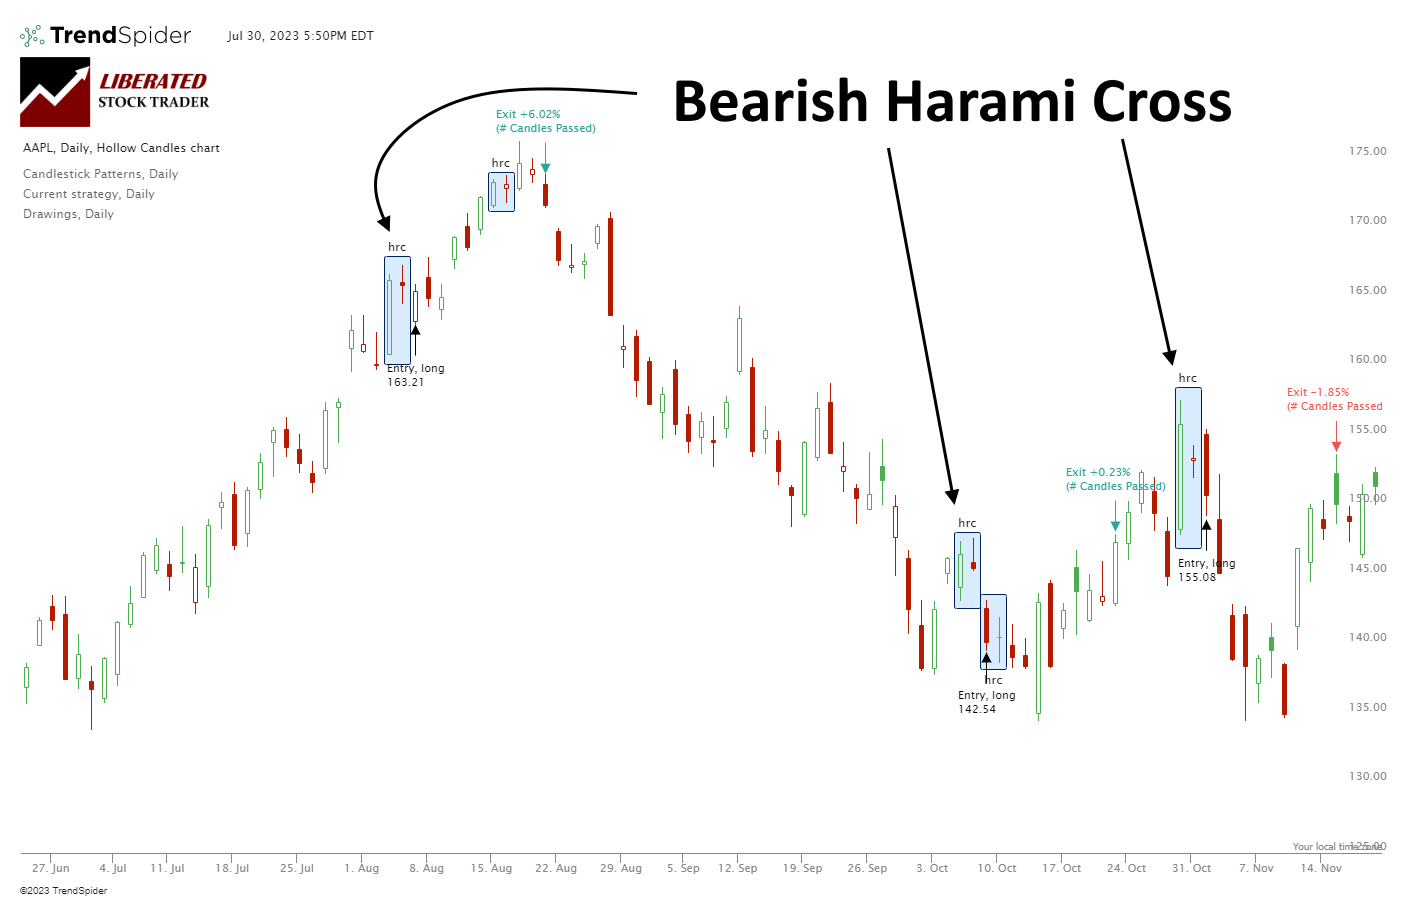
The Bearish Harami Cross is similar to the Bearish Harami, but with one key difference – the second candle is not clearly bullish; it is a doji or spinning top. This second Doji candle indicates equal buying and selling pressure, making it a reliable indicator of a potential bearish trend reversal. This pattern is often used to confirm bearish trends or generate sell signals.
As you will see, our research suggests that both the Bearish Harami and Bearish Harami Cross are both paradoxically Bullish patterns.
Bearish Harami Truth
Theoretically, a Bearish Harami pattern is a two-candlestick chart pattern that supposedly signifies the end of a bullish trend and the potential onset of a bearish trend. The first candlestick will often be a bullish bar, indicating that the market has increased significantly during that period. The second candle is bearish, indicating buyers have stepped in and pushed prices back down from their earlier highs.
I say theoretically because the reality, according to the data, is a Bearish Harami is a predominantly bullish pattern.
How to Identify a Bearish Harami?
When identifying a Bearish Harami, there should be a prevailing uptrend and a bullish candle encompassing a smaller bearish candle.
- Prevailing Uptrend: The pattern occurs during a confirmed uptrend. The presence of a preceding bullish trend is crucial for the formation of a Bearish Harami.
- Two Candlesticks: The Bearish Harami consists of two candlesticks. The first is a large bullish (green) candlestick, followed by a smaller bearish (red) candlestick. (See chart below).
- Positioning: The second candlestick is ‘engulfed’ by the body of the first, meaning it opens and closes within the range of the previous day’s body.
- Color Contrast: The color of the second candlestick is different from the first one. The first candlestick is green (indicating a close higher than the open), while the second is red (indicating a close lower than the open).
Get Candle Pattern Recognition with TrendSpider
The trading psychology behind a Bearish Harami is key to understanding the pattern. The Bearish Harami pattern signals a potential change in market sentiment. The bullish sentiment of the first day is countered by the bearish sentiment of the second day, suggesting a possible trend reversal.
Our test data show this theory is false; the Bearish Harami is a bullish signal for the following ten trading days.
The Bearish Harami Cross
The theory behind the Bearish Harami Cross pattern is similar to the Bearish Harami as it also signals a possible end to a bullish trend and the commencement of a bearish trend. While the first candle is still a bullish pattern with a significant move up, the second candle is usually a spinning top or Doji, meaning the open and close prices are similar and still contained within the bounds of the first candle.
How to Identify a Bearish Harami?
When spotting a Bearish Harami Cross, there should be an uptrend and a bullish candle encompassing a smaller bearish candle with a long wick, ideally a Doji or Spinning Top.
- Prevailing Uptrend: The pattern occurs during a confirmed uptrend. The presence of a preceding bullish trend is crucial for the formation of a Bearish Harami.
- Two Candlesticks: The Bearish Harami consists of two candlesticks. The first is a large bullish (green) candlestick, followed by a smaller bearish (red) Doji or Spinning Top candlestick. (See chart below).
- Positioning: The second candlestick is ‘engulfed’ by the body of the first, meaning it opens and closes within the range of the previous day’s body.
- Color Contrast: The color of the second candlestick is different from the first one. The first candlestick is green (indicating a close higher than the open), while the second is red (indicating a close lower than the open).
Get Candle Pattern Recognition with TrendSpider
The psychology behind a Bearish Harami Cross is it provides a potent signal of a change in market sentiment. The bullish sentiment of the first day is countered by the indecision of the second day Doji and finally overpowered by the bearish sentiment of the third day, often a gap down in price.
Theoretically, this pattern suggests a potential shift from a bullish to a bearish trend, but in reality, our research shows that the Bearish Harami Cross is a signal for a positive market move.
Only one of these patterns is worth trading; the Bearish Harami Cross.
Harami Testing
Using TrendSpider, I tested 30 Dow Jones Industrial stocks over 20 years. This amounted to 1,136 Harami trades and 1,136 years of data. The Harami must be fully formed to enter a trade, and the buy signal must be executed on the next trading day’s open price. Each trade was exited at the open exactly ten days later.
Candle Testing Methodology:
- Patterns: Bearish Harami & Bearish Harami Cross
- 30 DJIA Stocks
- Daily Chart
- Strategy: Buy Long
- Test Period: 2003 to 2023
- Buy at the next open
- Exit after 10 days
- Pattern Recognition performed by TrendSpider
How I Backtest Bearish Harami Candles
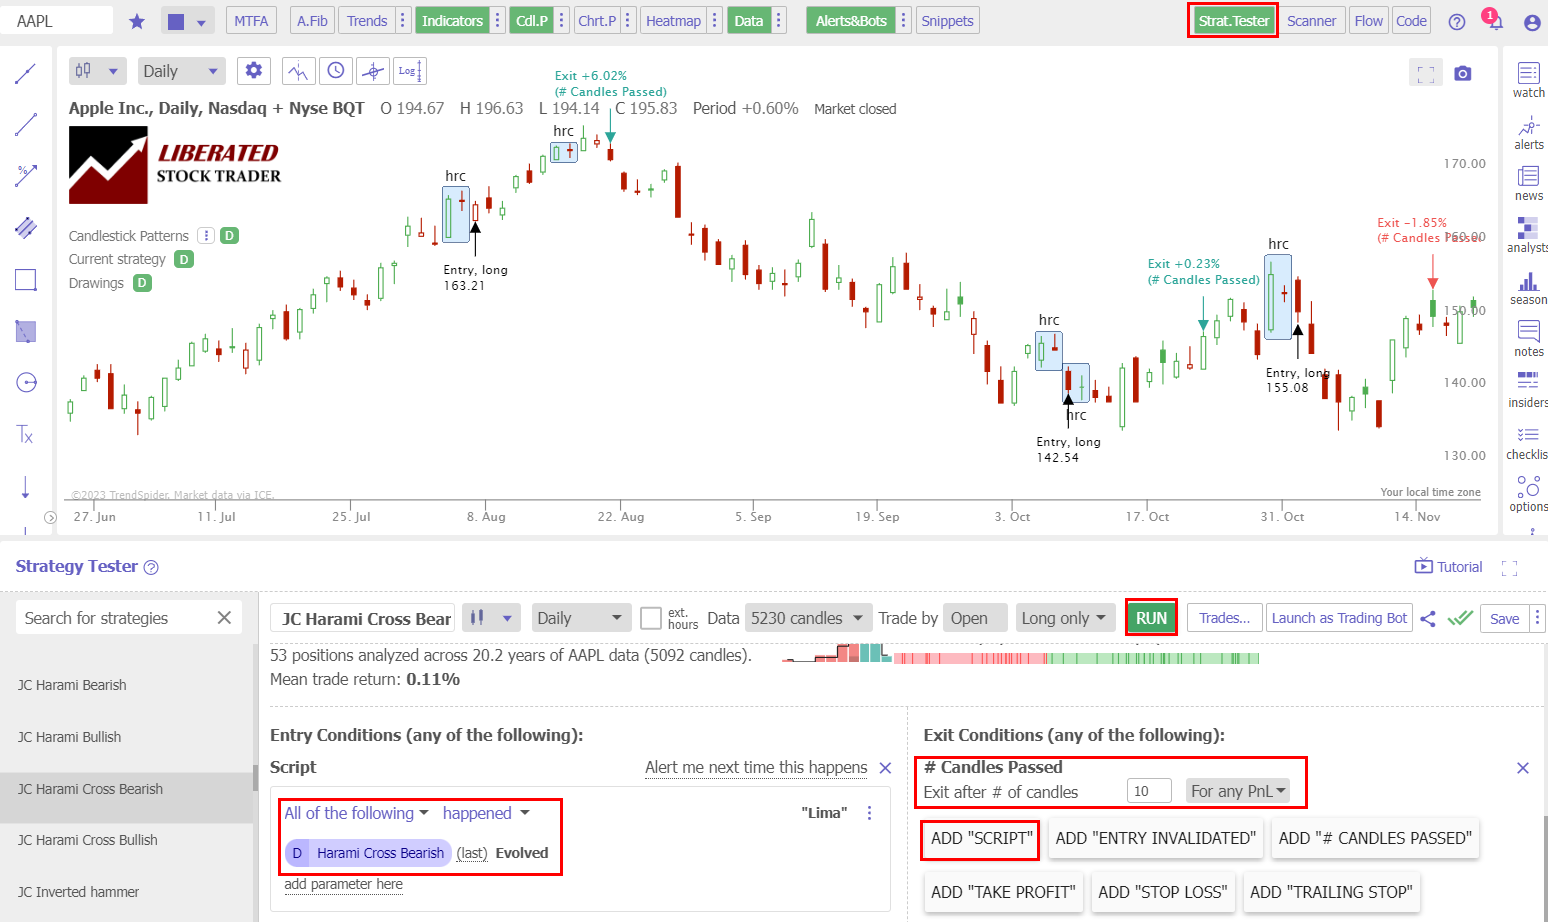
Using TrendSpider, you can easily identify and execute trades, achieving the quick and accurate results you desire. To confidently assess candlestick patterns and strategies on your own, please follow the instructions provided and refer to the accompanying screenshot.
- Register for TrendSpider.
- Buy Signal: Select Strategy Tester > Entry Condition > Add Parameter > Condition > Candlestick pattern > Bearish Harami or Bearish Harami Cross > Evolved.
- Sell Signal: Add # Candles Passed = 10.
- Click “RUN” to execute the backtest.
Perfect Backtesting with TrendSpider
Test Results
After conducting 5,738 trades on 1136 years of data, we confirm the superior Bearish Harami Cross profit per trade to be 0.57%. A 57% win rate means trading a Bearish Harami Cross long will net you an average of 0.57% profit per trade if you sell after ten days. Conversely, short-selling a Bearish Harami Cross, you should expect to lose 0.57% per trade.
Bearish Harami Cross Performance – Good
The percentage of Bearish Harami Cross winning trades was 57%, with an average winning trade equalling 3.6%, significantly higher than the average performance across all candlestick types. The Max Drawdown was -28.9%, versus the stock’s drawdown of -59.30%, which shows less volatility than a buy-and-hold strategy.
The average winning trade was 3.6% over ten days, and the average losing trade was -3.5%; this represents a tight profit margin, but when combined with the 57% successful trades, the strategy is profitable. The average profit for all trades was 0.57% per trade.
The Bearish Harami Cross reward-to-risk ratio is 1.06, the ninth highest of the 25 candles we tested. We have seen much better Reward/Risk ratios in our testing of “The most successful chart patterns.”
Bearish Harami Results – Average
The Bearish Harami is less reliable than the Bearish Harami Cross. The percentage of Bearish Harami winning trades was 56.2% versus 43.8% losing trades, slightly higher than the 55.8% average performance across all candlestick types. The Max Drawdown was -41.4%, versus the stock’s drawdown of -59.3%, which shows less volatility than a buy-and-hold strategy.
The average winning trade was 3.6% over ten days, and the average losing trade was -3.6%, suggesting razor-thin profit margins, especially when combined with the 55.2% successful trades. The average win for all trades was 0.48% per trade, which ranks the Bearish Harami 11th best of 25 in our testing.
Test Results Summary
Ultimately for every long trade you make after a Bearish Harami Cross appears on a daily stock chart, on average, you should make 0.57% after holding for ten days. The same trade on a Bearish Harami is 0.48%, both reasonable returns, but the Cross is better.
Performance Data Table: Bearish Harami Cross vs. Bearish Harami
Our combined testing of 1,136 years of data shows the Bearish Harami Cross outperforms the Bearish Harami by 18%. (See table below)
| Test Results | Bearish Harami Cross | Bearish Harami |
| Data Analyzed (Years) | 568.3 | 568.3 |
| # Trades | 1651 | 4087 |
| Wins | 57.0% | 56.2% |
| Losses | 43.0% | 43.8% |
| Max Drawdown | -28.9% | -41.4% |
| Max Drawdown (Asset) | -59.3% | -59.3% |
| Average Win | 3.6% | 3.6% |
| Average Loss | -3.5% | -3.6% |
| Average Return Per Trade | 0.57% | 0.48% |
| Reward/Risk Ratio | 1.06 | 1.02 |
| Sharpe Ratio | -0.02 | 0.16 |
| Sortino Ratio | 0.27 | 0.60 |
My groundbreaking research into the profitability and success rates of chart patterns and technical indicators is built on the most powerful backtesting platforms available. If you want to design original, profitable trading strategies, our exclusive review of the best backtesting software will help you find the perfect solution to give you a real edge in the markets.

Trading a Bearish Harami Based on Data
Our research confirms that you should trade the Bearish Harami Cross candle, which returns an average of 0.57% per trade, making it the 5th best-performing candle pattern. You can also trade the Bearish Harami but expect lower results over time.
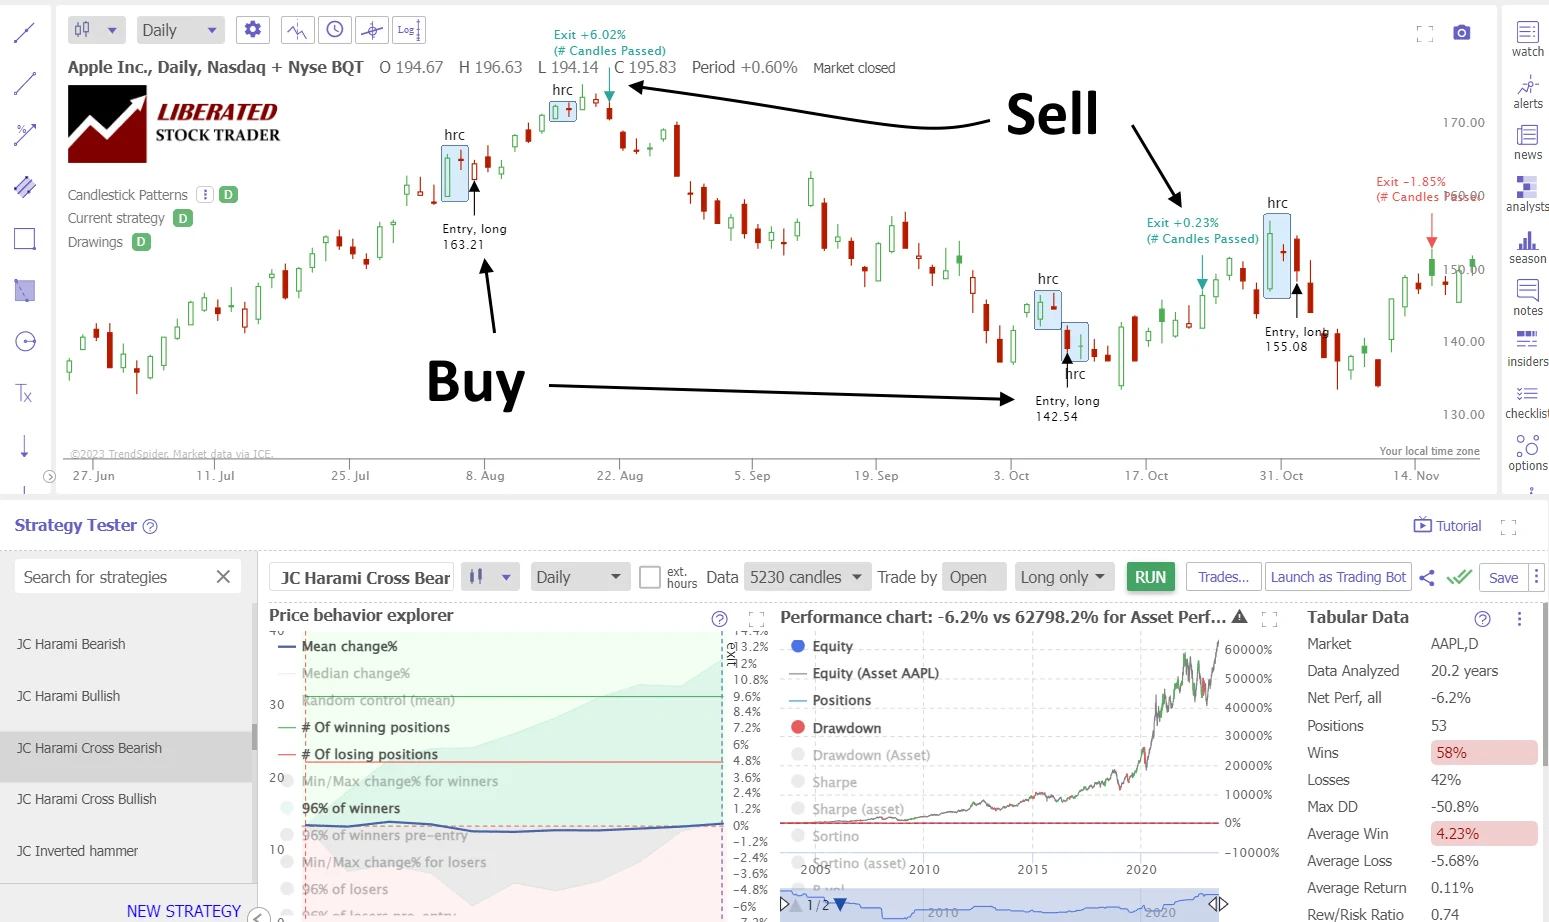
Trading the Bearish Harami Cross: Apple Inc. 20-Year Test
Thanks to TrendSpider’s strategy tester, we can see the Bearish Harami Cross’s 4.3% average winning trade on Apple Inc. The average gain across all winning and losing trades was 0.11%, which is quite poor. Over 20 years, there were 53 trades, 58% profitable, with a 0.74% reward/risk ratio.
Get TrendSpider – The King of Backtesting
Improving a Bearish Harami Trading Strategy
When engaging in Harami trading, it could be even more profitable to combine this strategy with indicators our testing has proven successful, like the Relative Strength Index (RSI) or Rate of Change (ROC). Additionally, we have extensively tested traditional chart patterns and found they can be highly profitable.
By optimizing your approach with these techniques, you can enhance both the quality and effectiveness of your trading strategy. Of course, you need to test this for yourself using TrendSpider.
Is a Bearish Harami Bearish or Bullish?
According to our testing, the Bearish Harami and Bearish Harami Cross are strongly bullish patterns in the following 10 trading days. The results from 1,136 tested trades are 56.6% bullish and 43.4% bearish. The Bearish Harami Cross is the more profitable variation.
Is a Bearish Harami a Reversal Pattern?
Our data shows that Bearish Harami is both a reversal and a continuation pattern. The charts above show Bearish Haramis occur during uptrends and downtrends, but they do not exclusively signal a price reversal; they can also be continuation patterns.
Does the Bearish Harami Candle Work?
Yes, the Bearish Harami Cross works well in trading yielding a 0.57% profit across all trades. Both the Bearish Harami and Bearish Harami Cross patterns are predominantly bullish and work if you buy long. Shorting these patterns will result in losses.
Is a Bearish Harami Candle Accurate?
The Bearish Harami Cross is the sixth most accurate candle pattern to trade; it results in 57% of trades winning and averages +3.6% per winning trade.
Can the Bearish Harami Candle be used for buy and sell signals?
Yes, our data shows the Bearish Harami and Bearish Harami Cross can be used for buy and sell signals. Together, they average a 56.6% win rate and 3.6% per winning trade across 5,738 trades.
Is a Bearish Harami Candle Reliable?
The Bearish Harami Cross proves to be the most reliable Harami pattern. An extensive analysis of 1,651 trades conducted on the 30 Dow Jones stocks over 20 years demonstrates an average profit of 0.57% per trade. This encompasses winning and losing trades, solidifying its reliability as a trading tool.
Summary
In conclusion, the Bearish Harami Cross is a reliable and profitable Japanese candlestick pattern. It has a good accuracy of 57%, resulting in a profit per trade of 0.57% and an average winning trade of 3.6% over 10 days. Our data proves the Bearish Harami Cross has upside predictive qualities.
Mastering trading skills through a professional training course is vital for every trader. It empowers them to make knowledgeable decisions while effectively mitigating risks. Explore the comprehensive trading training provided by Liberated Stock Trader to elevate your trading journey. Begin today and unlock a world of new opportunities!
You want to be a successful stock investor but don't know where to start.
Learning stock market investing on your own can be overwhelming. There's so much information out there, and it's hard to know what's true and what's not.

Liberated Stock Trader Pro Investing Course
Our pro investing classes are the perfect way to learn stock investing. You will learn everything you need to know about financial analysis, charts, stock screening, and portfolio building so you can start building wealth today.
★ 16 Hours of Video Lessons + eBook ★
★ Complete Financial Analysis Lessons ★
★ 6 Proven Investing Strategies ★
★ Professional Grade Stock Chart Analysis Classes ★
FAQ
What is the best software for Japanese candle trading?
TrendSpider is the best software for trading all Japanese candlestick patterns due to its powerful point-and-click backtesting and pattern recognition. TradingView is a great alternative for those trading non-US markets.
Is the Bearish Harami profitable?
Yes, the Bearish Harami Cross is the sixth most profitable candle pattern. Our testing shows it has an average return of 0.57% across 1,651 trades spanning 568 years of test data. So, for every 10-day trade, you should average a 0.58% profit.
What is a Bearish Harami candle?
A Bearish Harami candle is a two-candle pattern where the first candle is larger with a green bullish body, and the second is smaller with a red bearish body. This pattern indicates a 57% chance of a price increase in the following 10 days.
How can I recognize Bearish Harami candles?
A Bearish Harami is easy to spot; it forms when the first candle is longer than the second. The first should be a bullish green body, meaning it has an open price lower than its close price. The second should be a red bearish body with an open price higher than its close price.
What are some strategies for trading the Bearish Harami candle?
When trading the Bearish Harami, traders can buy on the open of the third candlestick after pattern formation or wait for a confirmed close above the high of the second candlestick to enter long positions.
What software automatically detects Bearish Harami candles?
All testing in this research article has been performed with the excellent TrendSpider, which automatically detects all candlesticks, including Bearish Harami and Harami Cross patterns. See other alternatives in our Best Candlestick Pattern Recognition Software Review.
Is the Bearish Harami candle popular?
According to Google search data, the Bearish Harami candle is a popular pattern, but most traders do not know how to trade it based on the data. Traders need to know that this pattern is bullish, not bearish, and trade the pattern long, not short.
Is the Bullish Harami candle important in trading?
Yes, according to our research, the Bullish Harami Cross is an important candlestick pattern due to its 0.58% average trade profit and average winning trade of 4.0%.
Is the Bearish Harami Candle reliable?
Yes, the Bearish Harami patterns reliably predict market direction 57% of the time, making it good for a consistent 0.57% per trade profit. The Bearish Harami Cross is more reliable than the Bearish Harami, so we recommend the cross variation.
What indicators should I use with a Bearish Harami?
In conjunction with Bearish Harami patterns, it is advisable to use indicators such as relative strength index (RSI) and rate of change (ROC). Our research and analysis have proven these indicators successful.