A Spinning Top candlestick is a frequently observed pattern in technical analysis, supposedly signifying uncertainty in the market. However, our testing reveals that it is a bullish pattern and the 10th most profitable candlestick formation to trade.
My original research found that the Spinning Top candle is a bullish pattern, with a 55.9% success rate and a 3.7% average winning trade. Trading with a Spinning Top yields an average profit of 0.49%, ranking it the 10th best candle to trade.
Is the Spinning Top worth trading? To uncover the truth, I meticulously analyzed 9,894 Spinning Top trades on 568 years of data. Join me on a data-driven journey into the world of the Spinning Top.
RESEARCH SUMMARY
- The Spinning Top has a win rate of 55.9%, the 10th best of all candles I tested.
- The spinning top pattern is bullish, not bearish, and predicts a price increase with 55.9% accuracy.
- The profit per trade is 0.49%, slightly lower than the average profit (0.51%) across all candlesticks we tested.
- Our testing confirms the Spinning Top is the 10th most profitable candle pattern.
What Is a Spinning Top Candle?
A Spinning Top candlestick is a common technical analysis chart pattern indicating market indecision. It has a small body with long upper and lower shadows (wicks), indicating that buyers and sellers battled on a volatile day but ended in a stalemate.
Most consider a spinning top candlestick a neutral pattern due to the indecision displayed during the trading day. So, it is very important to wait for the next day’s opening price to assess which way the asset price might be heading.
The Spinning Top candle is a single candlestick formation that often appears at the peak of an uptrend. It consists of a small variable body size, and the long upper and lower shadows should be approximately equal and extend at least twice as far as the body.
Understanding a Spinning Top
A Spinning Top candle is a signal traders use to help them guess what might happen next in the markets. Imagine a child’s spinning top toy rotating – it might fall to the left or right; you just can’t be sure. It’s the same in trading with this pattern – the market could go up or down, and traders aren’t sure which way yet.
The Spinning Top Candle looks like a cross or a plus sign on the chart. It has a small body in the middle (the “candle”), meaning that the opening and closing prices were quite close. It also has long lines (or “shadows”) above and below the candle, showing that the prices went up and down a lot during the trading day but ended up near where they started.
If you see this pattern, it means traders are feeling unsure, and it could be a sign that the current trend (up or down) might be about to change.
TrendSpider 4.8/5⭐: My Pick for AI-Power & Auto-Trading
I’ve used TrendSpider for 7 years for my research and testing. It auto-detects trendlines, patterns, and candlesticks, backtests ideas, and lets you use AI to create unique strategies and launch trading bots—with no code.

Save 38% to 45% on TrendSpider
Our Top Rated 4.72 ⭐ Trading Tool
✅ Leader in AI Trading & Chart Pattern Recognition
✅ Scanning & Auto-Trading
Deal Ends In:
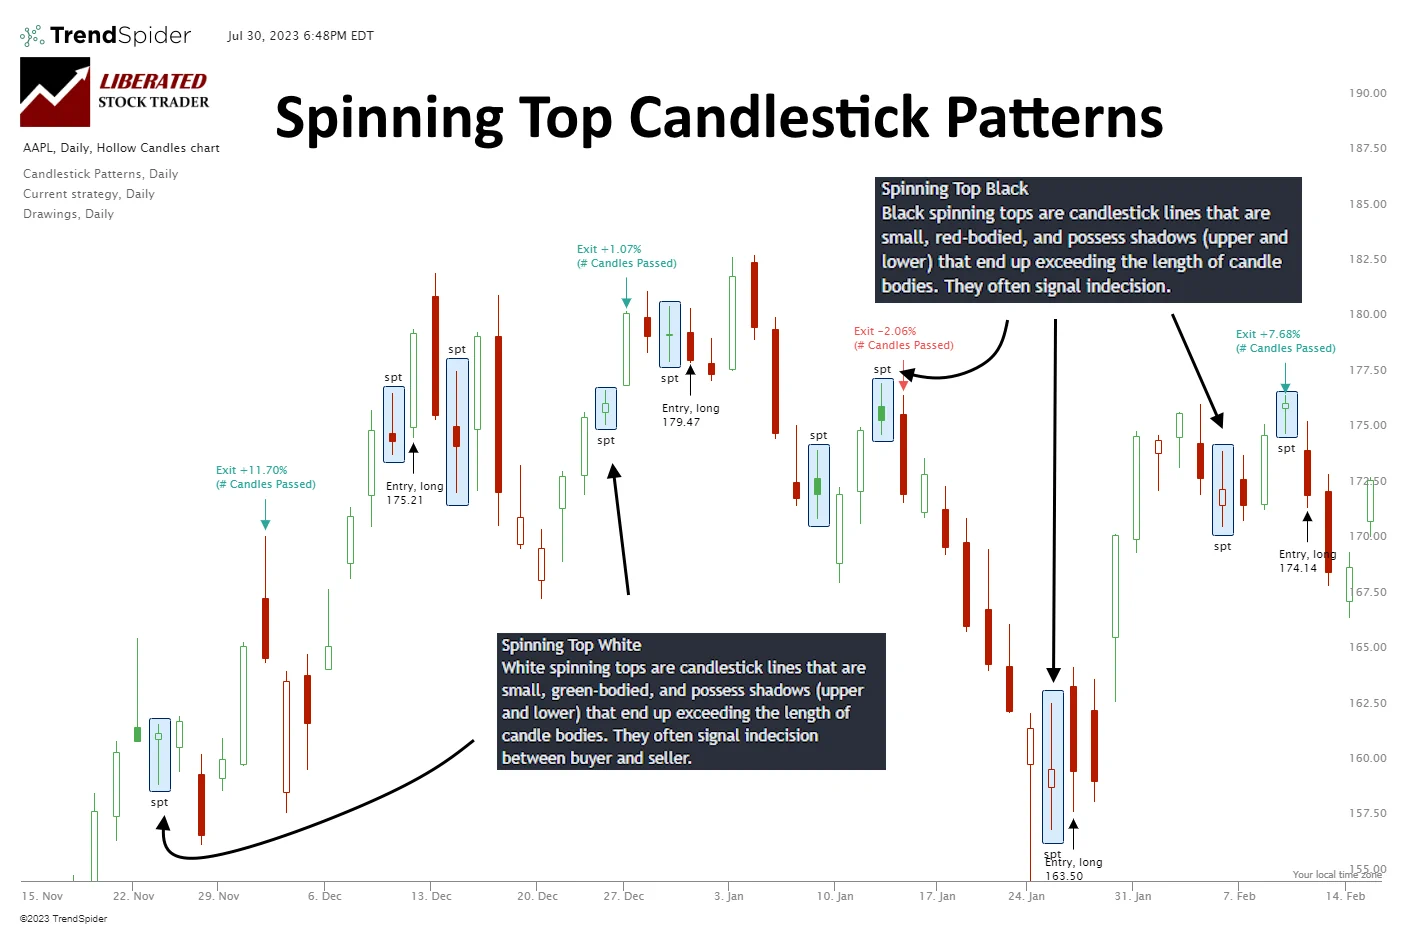
What is a Black Spinning Top?
The Black Spinning Top is a variation of the standard Spinning Top that occurs when the closing price is below the opening price. This indicates that the bears (sellers) had more power during the day than the bulls (buyers).
What is a White Spinning Top?
The White Spinning Top is the opposite of the Black Spinning Top pattern. In this instance, the closing price is higher than the opening price, which shows that the bulls (buyers) had more power than the bears (sellers). This can sometimes be a sign that a bullish trend reversal is on its way.
Is a Spinning Top a Reversal Pattern?
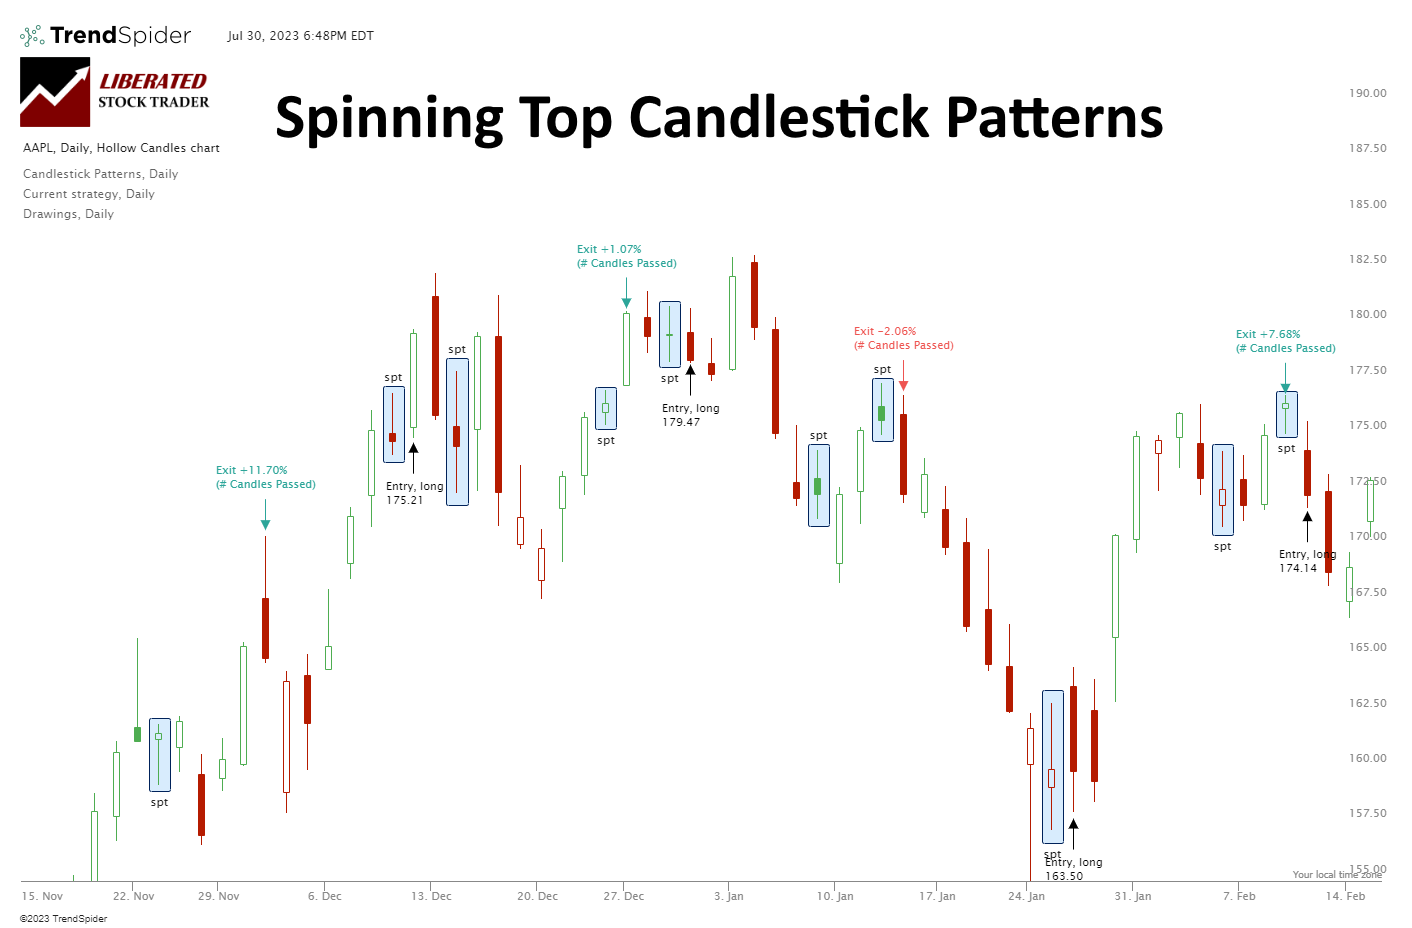
Our test data shows the Spinning Top is not a clear reversal or continuation pattern. In the chart above, I have highlighted 10 spinning tops, 6 continuation patterns, and 4 reversals. Testing confirms Spinning Top candles occur during uptrends and downtrends, but they do not exclusively signal a price reversal; they can also be continuation patterns.
Identifying a Spinning Top Candle
To identify the Spinning Top pattern, look for a small candle body with a long upper wick and lower wick at least twice the length of the body.
- Size: The spinning top’s body is usually small, indicating a narrow price range between the open and close.
- Upper and lower shadows: The spinning top has long upper and lower shadows, indicating significant price movement during the trading session.
- Lack of a clear trend: The spinning top occurs when the market is indecisive and lacks a clear direction. It suggests that buyers and sellers are evenly matched, resulting in a stalemate.
What Does It Mean?
The psychology behind the Spinning Top candle pattern lies in the battle between buyers and sellers. During a volatile day’s trading, bulls and bears push prices to extreme highs and lows. At the end of the trading day, the price is pushed back close to the open, indicating no clear direction for the day.
Let’s delve deeper into the psychology at play:
- Indecision: The small body of the spinning top reflects uncertainty among traders. It shows that neither the bulls (buyers) nor the bears (sellers) control the market.
- Potential reversal: The spinning top can be an early warning sign of a potential market reversal. It suggests that the current trend may be losing momentum, and a change in direction could occur.
- Market consolidation: The spinning top often appears during periods of consolidation, when the market is taking a breather and consolidating before deciding on its next move.
Our decades of research suggest the Spinning Top pattern is moderately bullish.
Misinformation on Spinning Tops
Our 568 years of data show that Spinning Top candles occur three times more often than others. Spinning Tops occurred 9,894 times, while other candles averaged 3,048 occurrences. This makes them very common and less meaningful. They can occur during an uptrend or downtrend and can be a reversal or continuation pattern.
The data does not support the theory touted by mainstream financial websites that the Spinning Top candle is a reversal pattern. 55.9% of spinning top candles will produce a 3.7% profit over the next ten days. This also means that 44.1% of the time, it produces a 3.7% loss or a 3.2% gain if you short-sell the trade.
Our testing shows the Spinning Top candle indicates bullish sentiment but results in weak bullish moves over the next ten trading days.
Trade a Spinning Top Based on Data
When trading Spinning Top candles, it is important to wait for the next day’s open and observe the price direction before making a trade. Our tests show that a Spinning Top candle has a 55.9% chance of a 3.7% profit over the next ten days. If you improve your entry and wait for confirmation before trading, you can increase this profitability.
While the Spinning Top signifies a neutral end to the trading day, this does not guarantee the next day will be bullish or bearish; it suggests that 55.9% of the time, the next ten days will be a bullish uptrend.
Auto-Trade Candles with TrendSpider
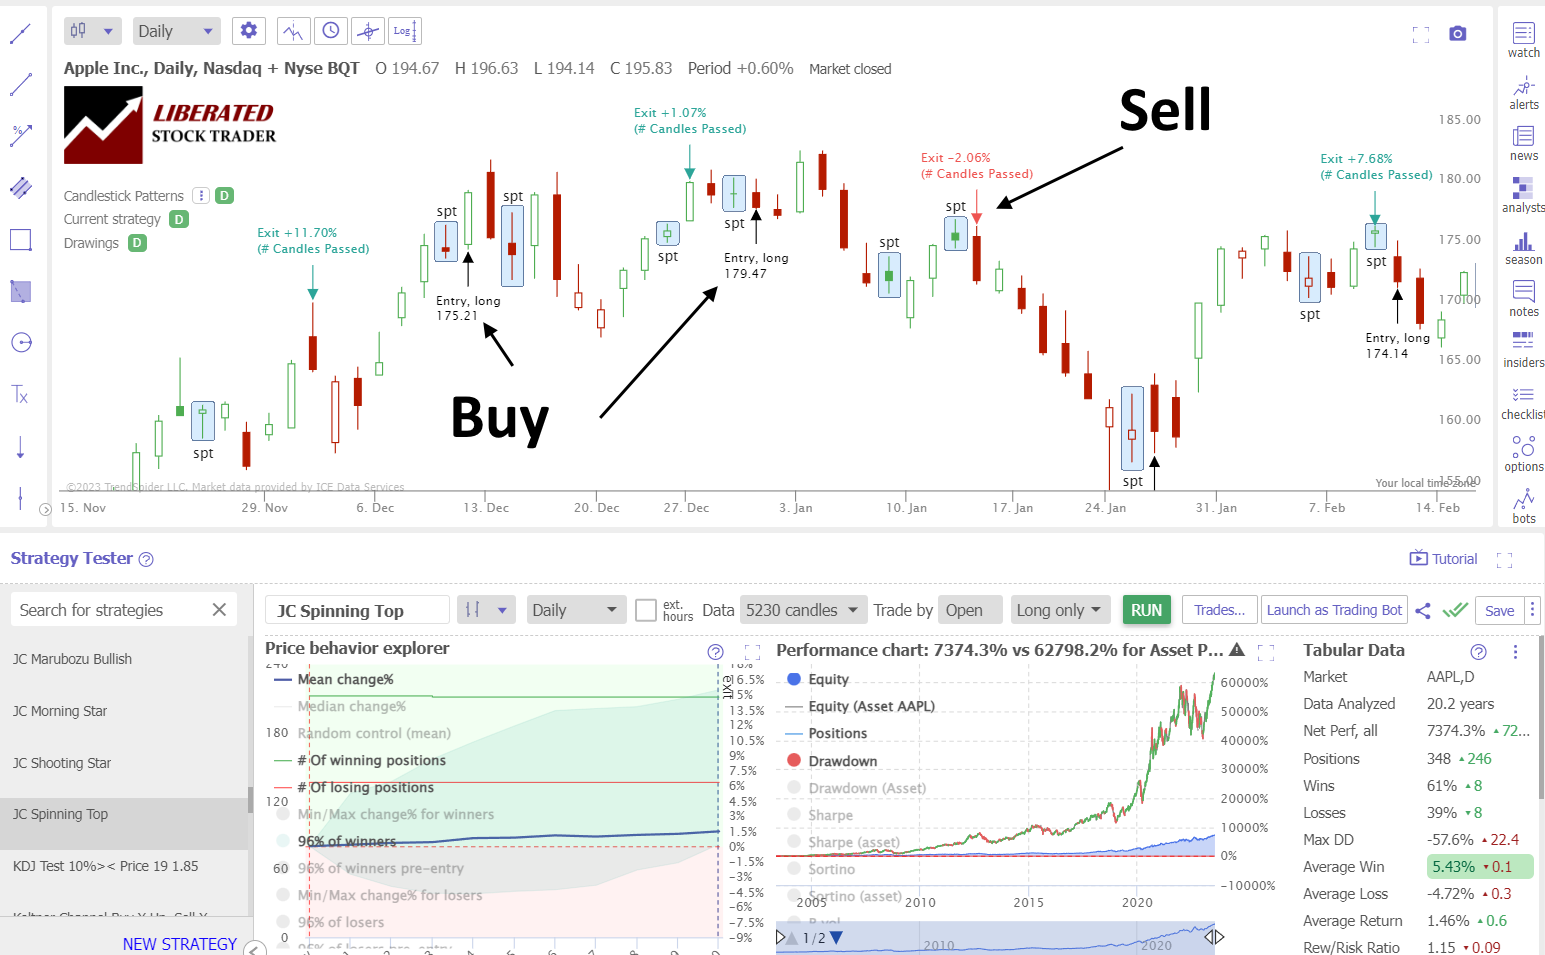
Trading the Spinning Top: Apple Inc. 20-Year Test
Our backtesting data on Apple Inc. (above) shows 348 trades. Each trade lasted ten days, and 61% were winning trades. This is proof the Spinning Top candle is bullish.
Thanks to TrendSpider’s strategy tester, we can see the Spinning Top’s 61% win rate and profit of 5.43% per winning trade. The average gain across all winning and losing trades was 1.46%, which is good.
This demonstrates that the asset you trade, such as Apple Inc., is as important as how you trade, like chart indicators or patterns. Apple Inc.’s long-term uptrend makes it significantly more profitable than other stocks.
Improving a Spinning Top Trading Strategy
When implementing the Spinning Top trading strategy, it is beneficial to incorporate dependable companion indicators such as the Relative Strength Index (RSI), Rate of Change (ROC), VWAP, or Weighted Moving Average. These techniques can potentially enhance your overall trading strategy, improving its quality and efficiency. It is crucial to personally test these methods, ideally with the assistance of TrendSpider.
My Spinning Top Backtesting
Using TrendSpider, I tested 30 Dow Jones Industrial stocks over 20 years. This amounted to 9,894 Spinning Top trades and 568 years of data. The Spinning Top candle must be fully formed to enter a trade, and the buy signal must be executed on the next trading day’s open price. Each trade was exited at the open exactly ten days later.
Candle Testing Methodology:
- Pattern: Spinning Top
- 30 DJIA Stocks
- Daily Chart
- Strategy: Buy Long
- Test Period: 2003 to 2023
- Buy at the next open
- Exit after 10 days
- Pattern Recognition and Backtesting performed by TrendSpider
Backtesting Data
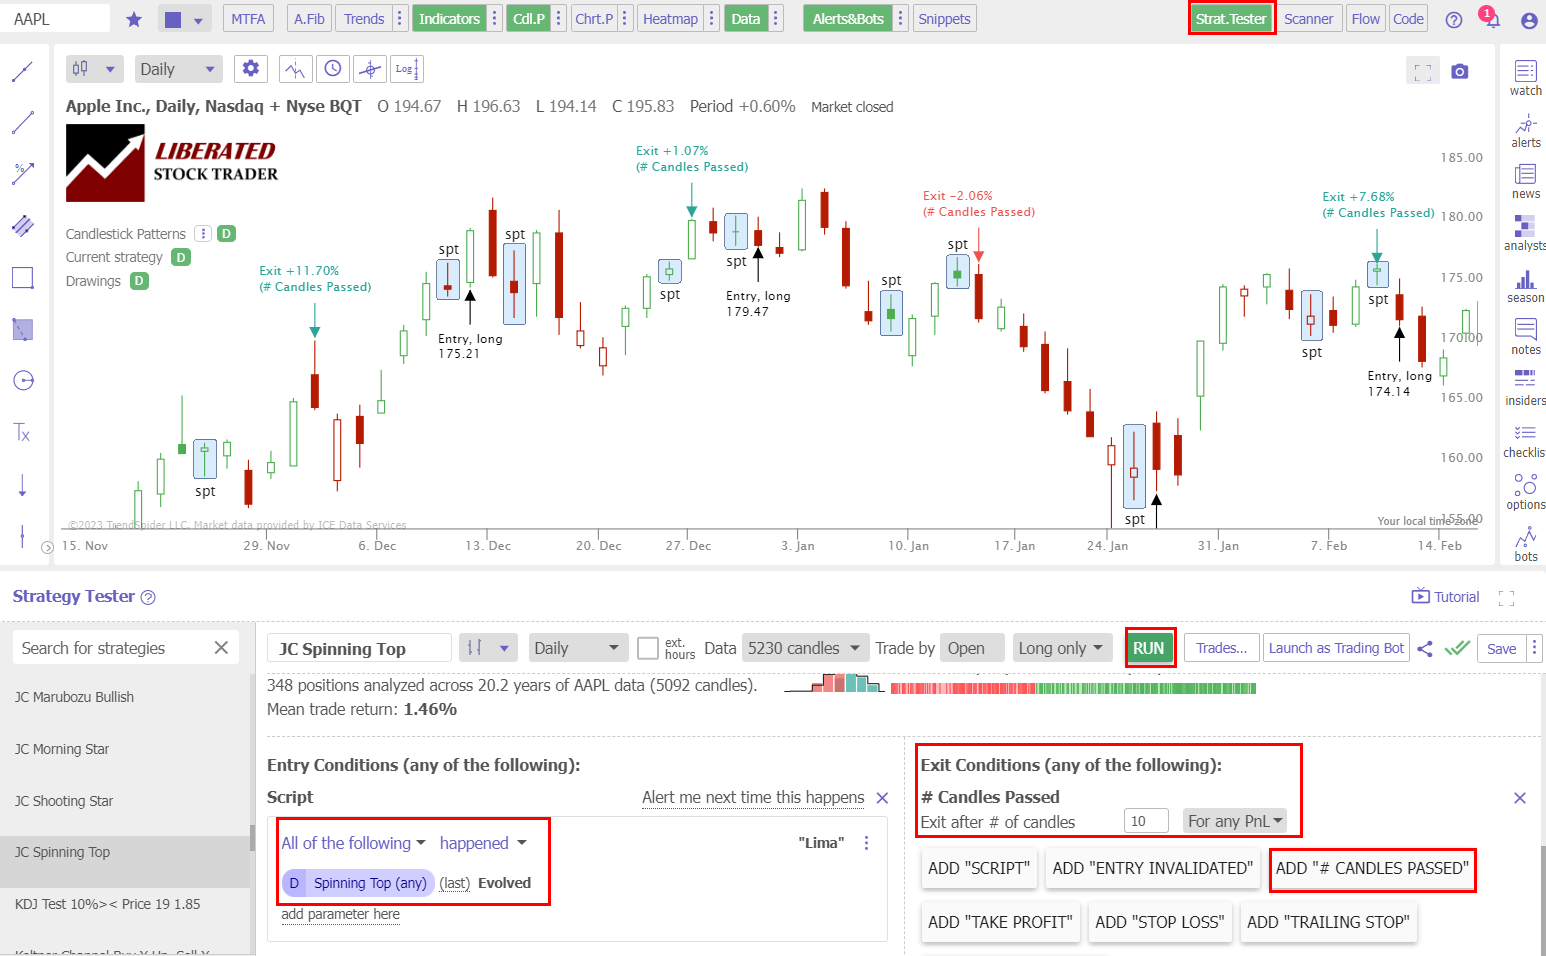
Using TrendSpider for trade identification and execution gives fast and precise results. To evaluate candlestick patterns and strategies independently, follow the instructions below and check out the screenshot for reference.
- Open TrendSpider.
- Buy Signal: Select Strategy Tester > Entry Condition > Add Parameter > Condition > Candlestick pattern > Spinning Top > Evolved.
- Sell Signal: Add # Candles Passed = 10.
- Click “RUN” to execute the backtest.
Backtesting Done with TrendSpider
Raw Test Results
After conducting 9,894 trades on 568 years of data, I confirm the Spinning Top profit per trade to be 0.49%. A 0.49% win rate means trading a Spinning Top long will net you an average of 0.49% profit per trade if you sell after ten days. Conversely, short-selling a Spinning Top, you should expect to lose -0.49% per trade. This proves this pattern is bullish.
The percentage of Spinning Top winning trades was 55.9%, the 7th best candle I have tested, similar to the 55.8% average performance across all candlestick types. The Max Drawdown was -25% versus the stock’s drawdown of -59.9%, which indicates high volatility.
The average winning trade was 3.7% over ten days, and the average losing trade was -3.6%; this represents a tight profit margin. When combined with 55.9% winning trades, the reward/risk ratio turns out at 1.04:1.
The reward-to-risk ratio of 1.04 is the third lowest of the 25 candles we tested, so you should probably not use this candle in your trading strategies. We have observed significantly higher Reward/Risk ratios in our testing of “the most successful chart patterns.”
Refined Test Results
For every long trade you make after a Spinning Top appears on a daily stock chart, on average, you should make 0.49% after holding for ten days. This result makes the Spinning Top the 10th best candlestick pattern to trade.
One of the best candlesticks for trading is the Inverted Hammer, with a profit per trade of 1.12%. The Bearish Engulfing and Bearish Marubozu candles also outperform the Spinning Top pattern.
Performance Data Table
Our 568 years of data show the Spinning Top candle is a low performer, with an average win rate of 0.49% per trade and a win rate of 55.9% on bullish trades. The pattern’s low reward/risk ratio of 1.04 is the biggest issue, making it not worth trading.
| Spinning Top Test Results | Spinning Top |
| Data Analyzed (Years) | 568.3 |
| # Trades | 9,894 |
| Wins | 55.9% |
| Losses | 44.1% |
| Max Drawdown | -55.9% |
| Max Drawdown (Asset) | -59.3% |
| Average Win | 3.7% |
| Average Loss | -3.6% |
| Average Return Per Trade | 0.49% |
| Reward/Risk Ratio | 1.04 |
| Sharpe Ratio | 0.44 |
| Sortino Ratio | 0.95 |
My groundbreaking research into the profitability and success rates of chart patterns and technical indicators is built on the most powerful backtesting platforms available. If you want to design original, profitable trading strategies, our exclusive review of the best backtesting software will help you find the perfect solution to give you a real edge in the markets.

Is a Spinning Top Candle Bullish or Bearish?
Our extensive testing reveals that the Spinning Top pattern is slightly bullish. Our original analysis of 9,894 trades shows a 55.9% tendency toward bullishness and a 44.1% bearish bias.
Does the Spinning Top Candle Work?
Yes, the Spinning Top candle works in trading, but the profitability is low, with a reward/risk ratio of only 1.04. It produces a 55.9% trade success rate, but we rank it 10th out of all candles, with a 0.49% average profit after 10 days. If you sell it short, it will average a -0.49% loss.
Is a Spinning Top Candle Accurate?
The Spinning Top candle is the 10th most accurate candle pattern to trade. 55.9% of trades win, and 44.1% lose. The average winning trade is 3.7%, and the losing trade is -3.6%. However, with a low reward/risk ratio of 1.04:1, it is not worth trading.
Can the Spinning Top Candle be used for Buy and Sell Signals?
Our data shows that spinning top candles can be used for buy-and-sell signals, but the inverted hammer or bearish marubozu are better alternatives. These candles are more reliable and profitable.
Is a Spinning Top Candle Reliable?
The Spinning Top has mediocre reliability. According to 9,894 tested trades, it is 55.9% reliable for bullish trades. Its average profit is mid-table, 0.49%, and the average winning trade was 3.7% over 10 days.
Spinning Top vs. Doji
The Spinning Top is often mistaken for a Doji; at first glance, they look similar, but the Spinning Top has a longer body and upper and lower wicks. In terms of performance, both are similar; a Spinning Top’s average return per trade is 0.49%, and a Doji is 0.51%. The Spinning Top is 55.9% bullish, whereas the Doji is 55.6%. The Gravestone Doji performs better, being 57% bullish and yielding an average profit per trade of 0.62%.
Summary
In conclusion, Spinning Top is the 10th most reliable and profitable pattern in Japanese candlestick analysis. It has a mid-table accuracy of 55.9%, resulting in a profit per trade of 0.49%. The reward/risk ratio is low at 1.04, making it unsuitable for use in a trading strategy.
All traders would benefit from investing in a comprehensive trading training course to help them make more informed decisions while managing their risks properly. So why not check out Liberated Stock Trader’s advanced investing course today?
FAQ
How can I find candlestick patterns on charts?
You can easily automate candlestick pattern recognition using specialized software like TrendSpider, or TradingView. These tools enable you to identify and analyze existing patterns and create custom patterns for automated trading and backtesting.
What is a spinning top candlestick pattern?
A Spinning Top candlestick is a chart pattern showing market indecision. It has a small body with long upper and lower shadows (wicks), indicating a volatile day that ended in a stalemate. It is 55.9% bullish and can occur in an uptrend or downtrend.
How do I identify a spinning top candlestick pattern?
To identify a spinning top candlestick pattern, look for a candlestick with a long upper and lower tail and a small body near the middle of the price range. It resembles a child's spinning top toy.
What is the best software for trading spinning top candles?
TrendSpider is the best software for trading all candle patterns due to its powerful point-and-click backtesting and pattern recognition. TradingView is a great alternative for those trading international markets.
What does a spinning top candlestick pattern indicate?
A spinning top candlestick pattern indicates an indecisive market, as the open and close of the day are very close together. This indicates that buyers and sellers were evenly matched on a given day. Our 568 years of data testing show it's 55.9% bullish.
Should I use a spinning top candlestick pattern for trading?
I would not advise using a spinning top pattern in trading. Even though it produces 55.9% winning trades at 3.7%, it also creates 44.1% losing trades at -3.6%. This makes the profit margins unrealistic for profitable trading.
Is the spinning top candlestick reliable?
The Spinning Top shows moderate reliability, with a 55.9% success rate for bullish trades out of 9,894 analyzed. On average, profit stands at 0.49%, and winning trades yield a 3.7% gain over 10 days.
Can spinning top candlesticks be used in different markets?
The spinning top candlestick pattern could be applied to various financial markets, including commodities and forex. Theoretically, the principles are the same, but the currency and commodity markets are rangebound, whereas stocks have no upper limit. I advise you to perform your own research using TrendSpider.
Is the spinning top candle profitable?
No, the spinning top will not be profitable after accounting for fees and slippage. It ranked as the 14th most profitable candle pattern we tested, with a low reward/risk of 1.04. A better alternative is the Inverted Hammer's 1.28:1.
How can I use spinning tops in my trading strategy?
I do not recommend using the Spinning Top in trading, but if you must, combine it with these proven successful indicators such as the relative strength index (RSI) and rate of change (ROC).
What are the limitations of the spinning top candle?
The spinning top candle's limitations are its low reward/risk ratio of 1.04, high frequency, and low profitability. To make longer-term predictions with higher probabilities, look at our 12 Proven Profitable Chart Patterns Research.
Can the spinning top candlestick pattern be used for day trading?
Yes, the spinning top candlestick pattern can be used in day trading strategies, but you need to expect lower success rates and higher losses. One thing is true across my decades of stock backtesting: the smaller the time frame, the less predictable the market.
What candle patterns are better than the spinning top?
Several candlestick patterns are better than the spinning top candle, such as the Inverted Hammer, Bearish Engulfing, or Bearish Marubozu, all with higher average returns per trade.
What software automatically detects profitable candles?
All testing in this research article has been performed with the superb TrendSpider, which automatically detects all candlesticks, including the profitable Inverted Hammer. See all options in our Candlestick Pattern Recognition Software Testing.