Tweezer top and bottom candle patterns theoretically signal short-term price trend reversals.
My 593 years of research data covering 1,892 test trades show that the tweezer candlestick pattern is unpredictable, unprofitable, and worth avoiding for traders.
Many mainstream finance websites suggest trading Tweezer candles is a good idea. But they are wrong!
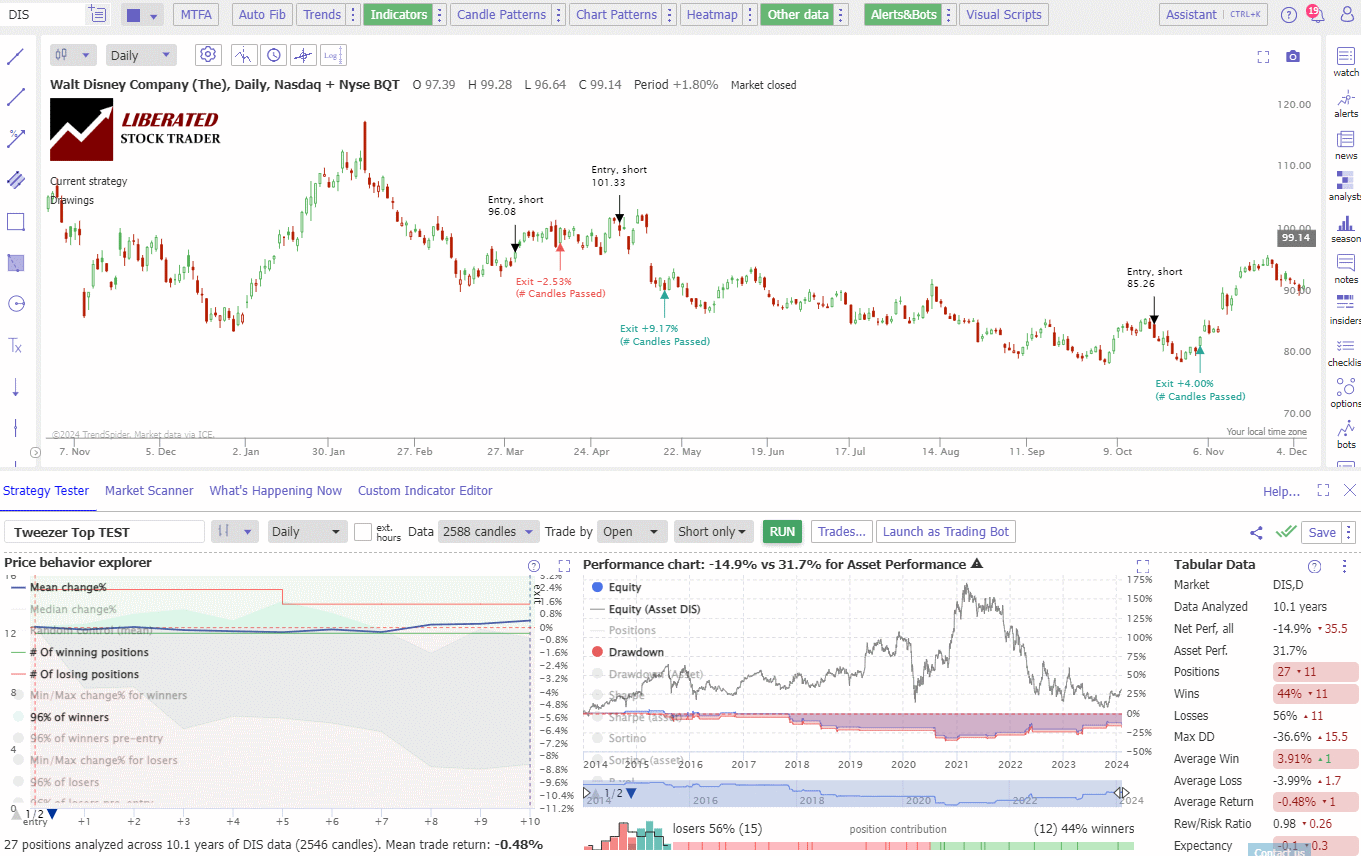
I analyzed Tweezer Tops using 296.8 years of data and 978 trades executed. This strategy’s win rate was a poor 44%, while losses accounted for 56% of the trades. The maximum drawdown observed was 33%.
On average, the Tweezer Top strategy yielded a 3% return for winning trades and a -3% return for losing trades, suggesting that you should avoid trading this pattern.
Key Takeaways
- Tweezer patterns, part of candlestick trading strategies, indicate potential trend reversals.
- Correct identification of tweezer tops is easy using pattern recognition.
- Our research suggests tweezers are not predictive or reliable and should be avoided in trading.
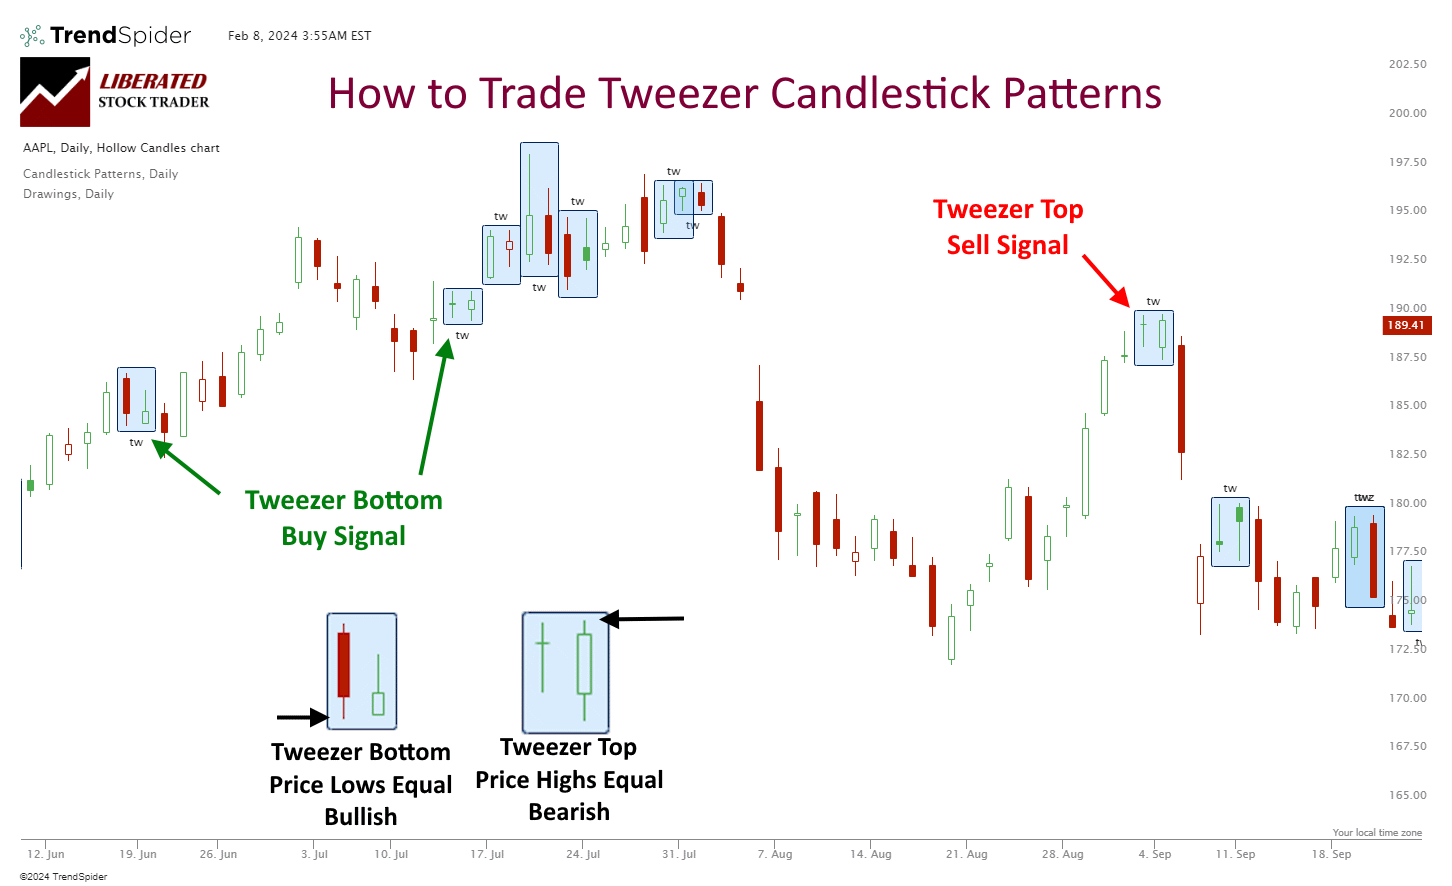
The tweezer top is identified by a pair of candlesticks with matching high points in an uptrend, signaling a possible bearish reversal. Conversely, the tweezer bottom, characterized by candlesticks with matching low points in a downtrend, can indicate a bullish reversal.
Understanding Candlestick Patterns
Candlestick patterns in technical analysis provide visual insight into market psychology and potential price movements. A single candlestick represents four key price points: the open, close, high, and low, within a specific timeframe on a chart.
- Bullish Candle: This occurs when the close is higher than the open, indicating buying pressure. It is typically represented with a white or green body.
- Bearish Candle: Conversely, when the close is lower than the open, it reflects selling pressure, shown by a black or red body.
Candlestick Patterns can be broadly classified into two categories:
- Reversal Patterns: These suggest a change in trend direction. Examples include the Tweezer Top and Bottom patterns. They occur after a consistent trend, signaling a potential weakening. Tweezer Tops are bearish reversal patterns. Tweezer Bottoms are bullish.
- Continuation Patterns: These indicate that the current trend may persist.
Tweezer Top Patterns
Traders use tweezer top patterns to identify potential bearish reversals in the market. They indicate a shift in market sentiment where buyers can no longer push prices higher.
Identification of Tweezer Tops
A tweezer top formation consists of two consecutive candlesticks in an uptrend with approximately the same high price level, signaling potential resistance and a reversal in market momentum. The first candlestick is typically bullish, followed by a bearish candlestick that signifies a struggle to maintain upward price movement. Identifying tweezer tops involves recognizing these two candlesticks at the peak of an uptrend where price levels meet resistance. This can be achieved easily using the best pattern recognition software, such as TrendSpider, which I have used for this extensive testing.
Interpreting Tweezer Tops
When traders identify a tweezer top, they interpret it as an early indication of a developing bearish trend. This pattern is considered one of the more reliable reversal patterns because it reflects a clear tug-of-war between buyers and sellers. If accompanied by other technical indicators, such as high trading volume on the second candlestick or converging moving averages, the interpretation of a bearish reversal becomes more robust.
Trading Strategies for Tweezer Tops
Theoretically, traders might consider taking a short position or exiting long positions upon identifying a tweezer top pattern to capitalize on the anticipated bearish reversal. Before executing trades, it is crucial to confirm the pattern with other technical analysis methods, such as support and resistance levels or trendline breaks. Risk management techniques, including setting stop-loss orders slightly above the tweezer top formation, help mitigate potential losses should the anticipated downtrend fail to materialize.
☆ Tweezer Top Backtesting ☆
Using TrendSpider, I tested 30 Dow Jones Industrial stocks over a ten-year period, which resulted in 978 Tweezer Top trades and 296 years of data. The Tweezer Top candles must be fully formed to enter a trade, and the sell short signal must be executed at the next trading day’s open price. Each trade was closed at the open exactly ten days after it was initiated.
TrendSpider 4.8/5⭐: My Pick for AI-Power & Auto-Trading
I’ve used TrendSpider for 7 years for my research and testing. It auto-detects trendlines, patterns, and candlesticks, backtests ideas, and lets you use AI to create unique strategies and launch trading bots—with no code.

Save 38% to 45% on TrendSpider
Our Top Rated 4.72 ⭐ Trading Tool
✅ Leader in AI Trading & Chart Pattern Recognition
✅ Scanning & Auto-Trading
Deal Ends In:
Tweezer Top Candle Testing Methodology:
- Pattern: Tweezer Top
- 30 DJIA Stocks
- Daily Chart
- Strategy: Go Short
- Test Period: 2014 to 2024
- Go Short at the next open
- Exit after 10 days
- Pattern Recognition and Backtesting performed by TrendSpider.
☆ Backtesting the Tweezer Top Candle ☆
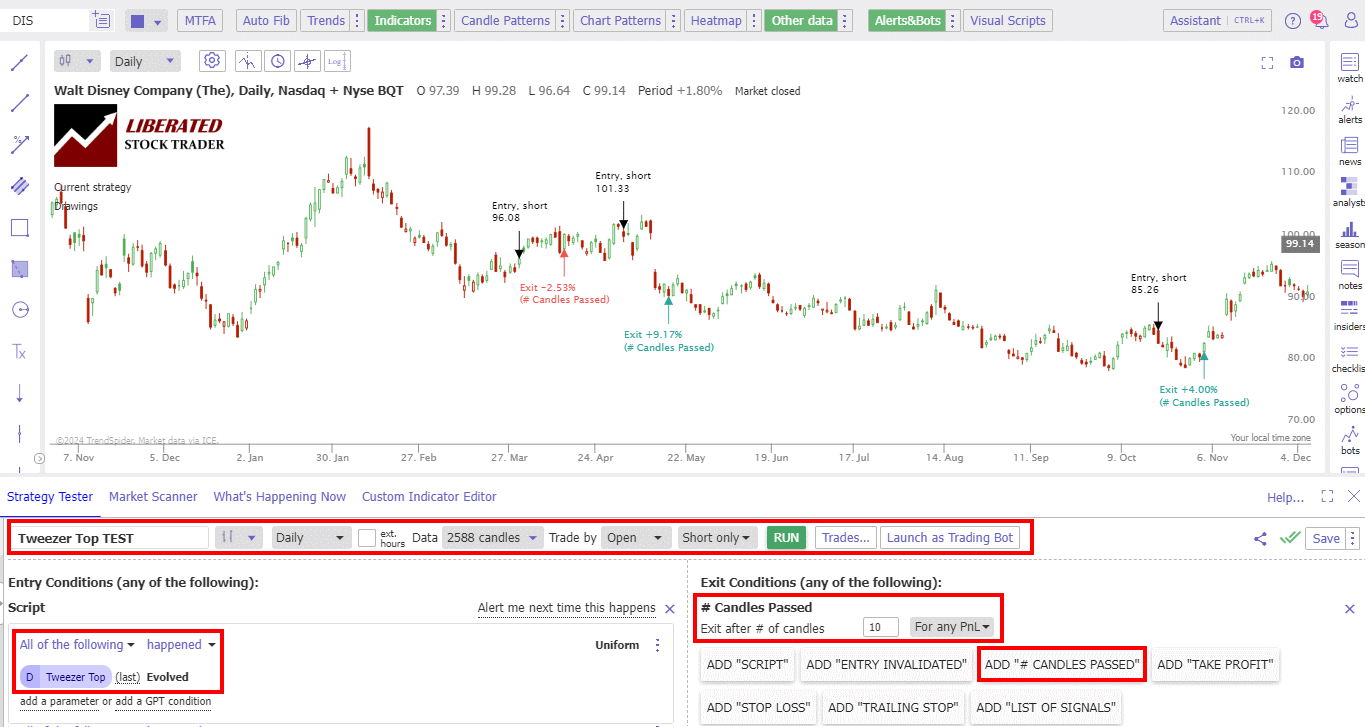
Using TrendSpider for trade identification and execution gives fast and precise results. To evaluate candlestick patterns and strategies independently, follow the instructions below and check out the screenshot for reference.
- Open TrendSpider.
- Buy Signal: Select Strategy Tester > Entry Condition > Add Parameter > Condition > Candlestick pattern > Tweezer Top > Evolved.
- Sell Signal: Add # Candles Passed = 10.
- Select “Short Only” Strategy
- Click “RUN” to execute the backtest.
Try Strategy Development with TrendSpider
☆ Backtesting Results ☆
My extensive testing shows that trading the Tweezer Top candle pattern is a losing strategy. Across 978 trades, the strategy generated 56% losing trades and a negative reward-risk ratio of 0.95. Profit expectancy was -0.13, meaning traders should avoid this pattern.
| Tweezer Top | Results |
| Data Analyzed (years) | 296.8 |
| # Trades | 978 |
| Wins | 44% |
| Losses | 56% |
| Max DD | -33% |
| Max DD (Asset) | -47% |
| Average Win | 3% |
| Average Loss | -3% |
| Average Return | -1% |
| Rew/Risk Ratio | 0.95 |
| Profit Expectancy | -0.13 |
Detailed Tweezer Top Test Result Summary
The strategy was analyzed over 296.8 years, with 978 trades executed. The win rate for this strategy was 44%, while the losses accounted for 56% of the trades. The maximum drawdown (DD) observed was 33%. On average, the strategy yielded a 3% return for winning trades and a -3% return for losing trades.
Example Tweezer Top Test Screenshot
Try Strategy Development with TrendSpider
The overall average return for this strategy was -1%. The reward-to-risk ratio (Rew/Risk Ratio) was calculated to be 0.95, indicating that the strategy’s potential reward was slightly lower than its risk. Lastly, the profit expectancy for this strategy was -0.13, suggesting that, on average, the strategy did not generate profitable results.
Tweezer Bottom Patterns
Tweezer bottom patterns are theoretically bullish reversal indicators that frequently signal the end of a downtrend and the potential onset of an upward trajectory.
Identification of Tweezer Bottoms
Tweezer bottoms are identified by a pair of candlesticks that typically have matching or nearly matching lower wicks. These patterns emerge when prices consecutively test a support level without a breakthrough, indicating strong buying interest. Following a downward trend, the first candlestick reflects continued selling, but the second indicates a shift with buyers driving the prices back up from the session’s lows.
Interpreting Tweezer Bottoms
A well-formed tweezer bottom is significant because it suggests a reversal from the prevailing bearish trend. If the second candle closes higher than the first, it reinforces the likelihood of a bullish reversal. Analysts often use other technical indicators, such as volume spikes or momentum oscillators, to confirm the pattern.
Trading Strategies for Tweezer Bottoms
Traders might consider entering a long position following the confirmation of a tweezer bottom pattern, especially if accompanied by increased trading volume or other bullish indicators. A common strategy includes setting a stop-loss just below the tweezer bottom’s low to minimize potential losses if the anticipated upward trend does not materialize.
☆ Tweezer Bottom Backtesting ☆
Using TrendSpider, I tested 30 Dow Jones Industrial stocks over ten years. This amounted to 914 Tweezer Bottom trades and 296 years of data. The Tweezer Bottom candles must be fully formed to enter a trade, and the buy signal must be executed on the next trading day’s open price. Each trade was closed at the open exactly ten days later.
Tweezer Bottom Candle Testing Methodology:
- Pattern: Tweezer Bottom
- 30 DJIA Stocks
- Daily Chart
- Strategy: Go Long
- Test Period: 2014 to 2024
- Go Long at the next open
- Exit after 10 days
- Pattern Recognition and Backtesting performed by TrendSpider.
☆ Backtesting the Tweezer Bottom Candle ☆
Using TrendSpider for trade identification and execution gives fast and precise results. To evaluate candlestick patterns and strategies independently, follow the instructions below.
- Open TrendSpider.
- Buy Signal: Select Strategy Tester > Entry Condition > Add Parameter > Condition > Candlestick pattern > Tweezer Bottom > Evolved.
- Sell Signal: Add # Candles Passed = 10.
- Select “Long Only” Strategy
- Click “RUN” to execute the backtest.
☆ Tweezer Bottom Backtesting Results ☆
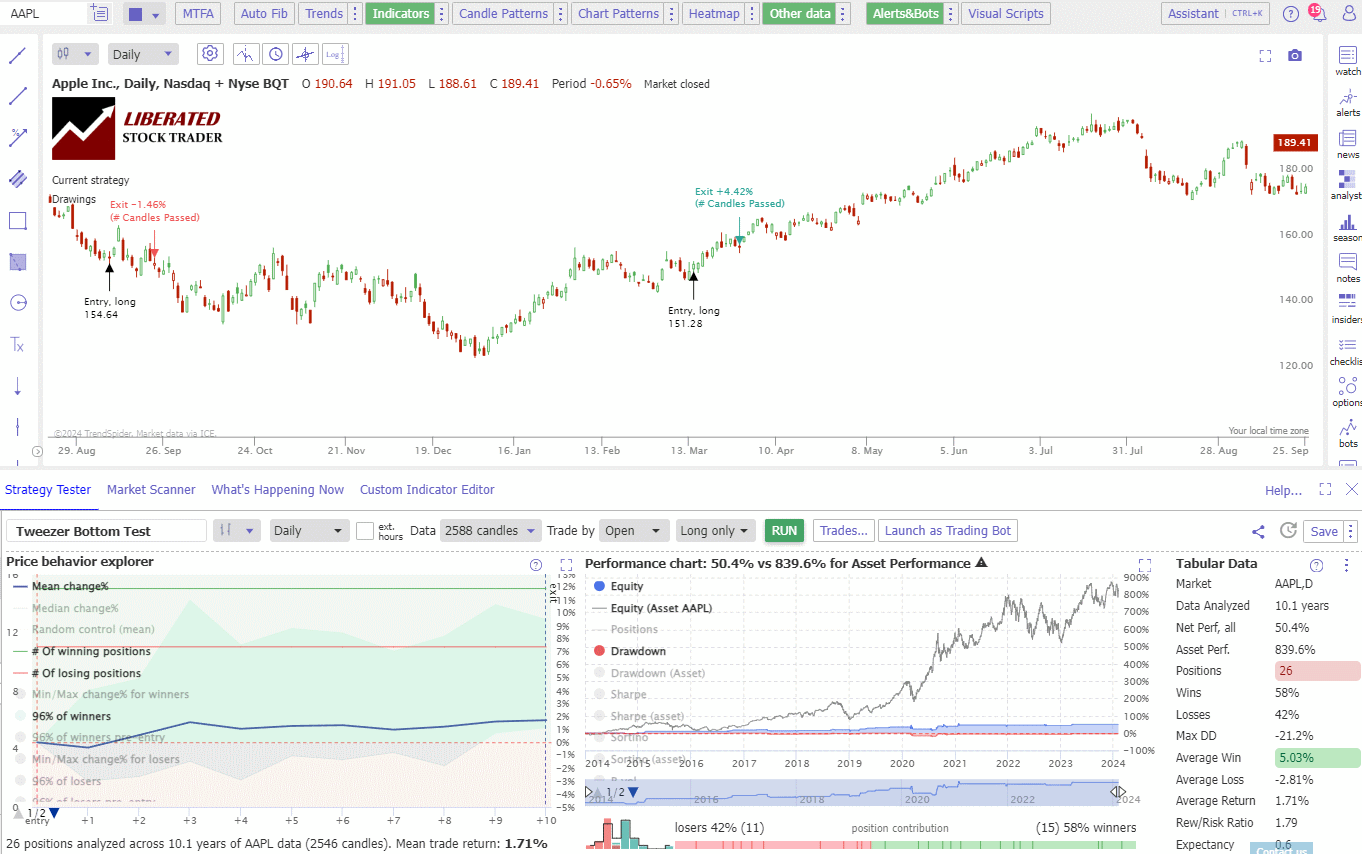
Based on thorough testing, a Tweezer Bottom candle strategy is, at best, break-even. Out of 914 trades, this strategy resulted in a 45% loss rate, with a reward-risk ratio of 1.2. Furthermore, the profit expectancy was notably low, measuring just 0.19. Considering these results, traders should avoid this particular pattern.
| Tweezer Bottom | Results |
| Data Analyzed (years) | 296.8 |
| Positions | 914 |
| Wins | 55% |
| Losses | 45% |
| Max DD | -23% |
| Max DD (Asset) | -47% |
| Average Win | 3.71% |
| Average Loss | -3.39% |
| Average Return | 0.52% |
| Rew/Risk Ratio | 1.20 |
| Expectancy | 0.19 |
Detailed Tweezer Bottom Test Result Summary
The backtesting results for the Tweezer Bottom trading strategy indicate poor performance, resulting in almost zero profitability. Out of 914 trades analyzed over 296.8 years, this strategy yielded a loss rate of 45%. The maximum drawdown for this strategy was -23%, indicating significant losses. The reward-risk ratio stood at 1.2, and the profit expectancy was only 0.19. These results suggest that traders should avoid utilizing the Tweezer Bottom pattern as it does not yield favorable outcomes.
Try Strategy Development with TrendSpider
Table: Tweezer Top & Bottom Performance
The table below illustrates that the Tweezer Top and Bottom patterns are unreliable strategies that yield zero profitability and the same reliability as flipping a coin. The average winning trades are 49%, and the average win and loss are almost identical at 3.4%.
| Tweezer Pattern Tests | Tweezer Bottom | Tweezer Top | Totals |
| Data Analyzed (years) | 296.8 | 296.8 | 593.6 |
| Positions | 914 | 978 | 1892 |
| Wins | 55% | 44% | 49% |
| Losses | 45% | 56% | 51% |
| Max DD | -23% | -33% | -28% |
| Max DD (Asset) | -47% | -47% | -47% |
| Average Win | 3.71% | 2.97% | 3.34% |
| Average Loss | -3.39% | -3.48% | -3.44% |
| Average Return | 0.52% | -0.65% | -0.07% |
| Rew/Risk Ratio | 1.20 | 0.95 | 1.07 |
| Expectancy | 0.19 | -0.13 | 0.03 |
Are Tweezer candle patterns profitable or reliable?
Based on my testing of 1,892 trades, the tweezer top and bottom patterns are highly unreliable and unprofitable. These patterns exhibit a reward-to-risk ratio of only 1.07, with 50% of trades resulting in losses. Relying on tweezers as a trading strategy yields poor results.
Is a Tweezer Pattern Accurate?
The tweezer candle is one of the least accurate patterns to trade. It results in 49% of trades winning and 51% losing. The average winning trade is 3.34%, and the losing trade is -3.44%. With a low reward/risk ratio of 1.07:1, it is not worth trading.
Can the Tweezer Candles be used for Buy and Sell Signals?
Our data shows that Tweezer candles should not be used for buy and sell signals. The Inverted Hammer or Bearish Marubozu are better alternatives with better reliability and profitability.
Technical Analysis and Tweezer Patterns
Technical analysis utilizes various tools and patterns to evaluate market movements and predict future price actions. The tweezer top and bottom patterns are among these tools, but because they are non-predictive, it is best to use other tools to confirm buy and sell signals.
Volume Analysis and Tweezers
Volume is critical in confirming the bullish or bearish signals suggested by tweezer patterns. A tweezer bottom pattern is more convincing if increased buy volume implies growing interest and potential for price rise. Conversely, the bearish tweezer top is corroborated by sell volume, highlighting traders’ urgency to exit and potentially auguring a downward price movement.
Risk Management in Trading Tweezer Patterns
Effective risk management is crucial to protecting capital and maximizing potential gains when trading Tweezer Top and Bottom patterns.
Setting Profit Targets
Traders should define clear profit targets to capitalize on the trend reversal indicated by Tweezer patterns. For a Tweezer Top, the target could be set above the opening price of the first candle, ensuring gains are locked in before a potential downtrend. Conversely, targets may be placed below the closing of the initial bullish candle for a Tweezer Bottom, capturing the upside before any new uptrend diminishes.
Using Stop-Loss Orders
Stop-loss orders are vital in the trader’s toolkit for mitigating losses during trend reversals. In the event of a Tweezer Top, the stop-loss can be placed just above the pattern’s high. For Tweezer Bottoms, it is prudent to position the stop-loss slightly below the low of the two-candle formation, preventing further losses if the expected upward trend fails to materialize.
Entry and Exit Points
When identifying entry points for a trade, one should look for precise patterns like the Tweezer Top and Bottom. For instance, an entry below the second candle of a Tweezer Top might indicate the beginning of a short position. Conversely, traders might interpret a Tweezer Bottom as an opportunity to enter a long position. Exit points should be determined by setting a stop loss, which limits potential losses if the market moves contrary to expectations. A common strategy is to place a stop loss just above the recent high in the case of shorting on a Tweezer Top or below the recent low for a long position after a Tweezer Bottom.
Avoiding False Signals
To enhance the reliability of their trading decisions, traders must be skilled in avoiding false signals. 50% of Tweezer patterns will lead to false signals; hence, confirmation with other tools, such as volume analysis and technical indicators, is essential. For a Tweezer Top, witnessing high trading volume on the second candle can reinforce the likelihood of a bearish reversal. Moreover, traders should look for longer wicks or shadows to filter out less significant candlestick formations, reducing the risk of misinterpreting market signals.
FAQ
How can I find tweezer candle patterns on charts?
You can easily automate candlestick pattern recognition using specialized software like TrendSpider or TradingView. These tools enable you to identify and analyze existing patterns and create custom patterns for automated trading and backtesting.
What is the best software for trading tweezer patterns?
TrendSpider is the ultimate software for trading candle patterns thanks to its robust point-and-click backtesting and exceptional pattern recognition capabilities. For those venturing into international markets, TradingView serves as an excellent alternative.
What implications does a tweezer bottom pattern have for traders?
The tweezer bottom theoretically indicates a bullish reversal possibility, but our real-world testing shows it is a poor pattern for trading and should be avoided.
What does a tweezer top pattern mean for traders?
The tweezer top theoretically indicates a bullish reversal possibility, but our real-world testing shows it is a loss-making pattern that traders should avoid.
Are tweezer candle patterns reliable?
No, our testing shows the tweezer top and bottom patterns are unreliable and yield no profitable outcomes. With a reward-to-risk ratio of only 1.07 and 50% of trades losing, tweezers are a poor strategy.
What are the common confirmations for a tweezer top reversal?
Common confirmations for a tweezer top include an increased trading volume on the day the pattern completes and subsequent bearish candlesticks. Traders often look for these to confirm the pattern's validity before trading.
In what market conditions are tweezer patterns most reliable?
Our 593 years of data covering bull and bear markets shows Tweezer patterns are unreliable in all market conditions and should be avoided.