12 Accurate Chart Patterns Proven Profitable & Reliable
Research shows that the most reliable chart patterns are the Head and Shoulders, with an 89% success rate, the Double Bottom (88%), and the Triple Bottom and Descending Triangle (87%). The Rectangle Top is the most profitable, with an average win of 51%, followed by the Rectangle Bottom with 48%.
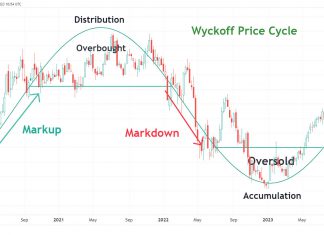
Wyckoff Method Explained: Accumulation & Distribution Trading
The Wyckoff Method is built upon three cardinal laws that govern the financial markets: the Law of Supply and Demand, the Law of Cause and Effect, and the Law of Effort versus Result.
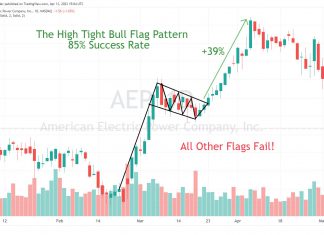
55% Of Bull Flags Fail. Trade a High Tight Flag’s 85%...
According to an analysis of 1,028 trades, most bull flags have a failure rate of 55%. The high-tight bull flag has a success rate of 85% and is the only flag pattern you should trade.
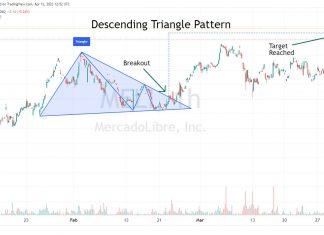
How to Trade a Descending Triangle’s 87% Success Rate
Twenty years of trading research show the descending triangle pattern has an 87% success rate in bull markets and an average profit potential of +38%.
Why Traders Should Avoid a Bear Flag Pattern Based On Data!
Be careful when trading bearish flags. According to published research, the bear flag pattern has a low success rate of 45%. This means you are flipping a coin when trading this pattern, as the odds are not in your favor. The high-tight bear flag is the only flag pattern you should trade.
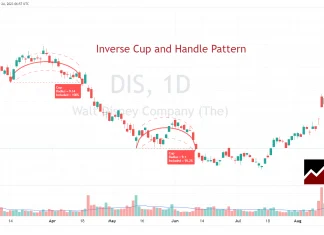
How to Short-Sell an Inverse Cup and Handle’s 82% Reliability
Two decades of trading research indicate that the inverse cup and handle pattern has an 82% success rate and average price drops of 17%. It is an ideal pattern for short-selling.
8 Bearish Chart Patterns for Traders Tested & Proven Reliable
Decades of research have proven the most predictable bearish chart patterns are the inverted cup-and-handle, with an average price decrease of 17%, the rectangle top (-16%), head-and-shoulders (-16%), and the descending triangle (-15%).
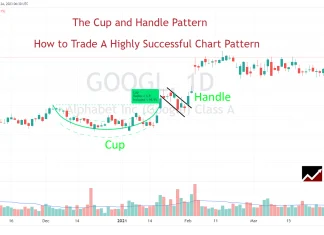
How to Trade a Cup and Handle’s 95% Reliability & 54%...
Twenty years of trading research show that the cup and handle pattern has a 95% success rate in bull markets and returns an average profit of +54%.
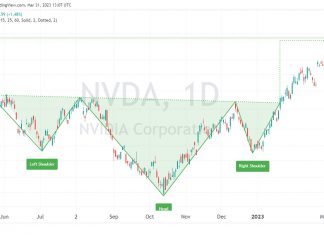
How to Trade the Inverse Head & Shoulders with 89% Accuracy
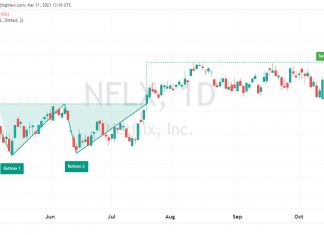
The inverse head and shoulders pattern is one of the most accurate technical analysis reversal patterns, with a reliability of 89%. It occurs when the price hits new lows on three separate occasions, with two lows forming the shoulders and the central trough forming the head.
Top 10 Best Bullish Patterns Tested & Proven Reliable
Research shows the most reliable and accurate bullish patterns are the Cup and Handle, with a 95% bullish success rate, Head & Shoulders (89%), Double Bottom (88%), and Triple Bottom (87%). The most profitable chart pattern is the Bullish Rectangle Top, with a 51% average profit.
How to Trade the Rising Wedge Pattern’s 81% Success Rate
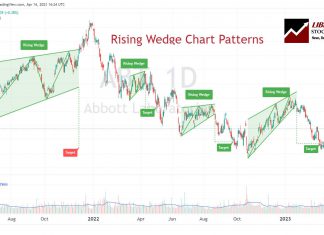
According to multi-year testing, the rising wedge pattern has a solid 81% success rate in bull markets with an average potential profit of +38%. The ascending wedge is a reliable, accurate pattern, and if used correctly, gives you an edge in trading.
Why Traders Must Avoid the Bear Pennant Pattern!
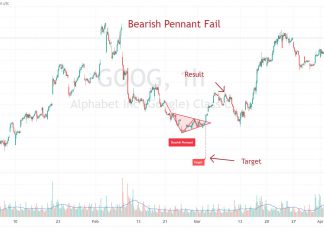
Traders should avoid using bear pennants. Decades of testing on over 1,600 trades show bearish pennants have a low success rate of 54% and a low price decrease of 6%.
How to Trade a Rectangle Pattern’s 85% Success Rate
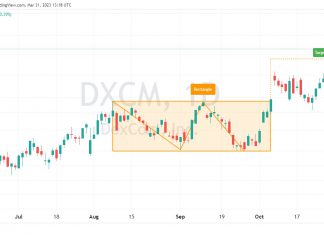
Decades of trading research show the rectangle pattern has an 85% success rate in bull markets and an average profit potential of +50%.
How to Trade a Double Bottom Pattern’s 88% Success Rate
Decades of research reveal the double bottom pattern has an 88% success rate in bull markets and an average profit potential of +50%. The double-bottom chart pattern is one of the most reliable and accurate chart indicators in technical analysis.
Head & Shoulders Pattern: Trade an 81% Success Rate
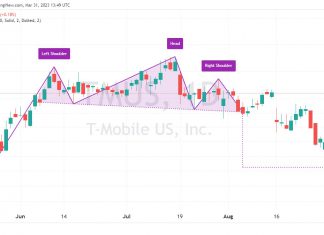
The head and shoulders pattern is one of the most accurate technical analysis reversal patterns, with a reliability of 81%. A head and shoulders top occurs when the price peaks on three separate occasions, with two peaks forming the "shoulders" and the central peak forming the head.
Why Traders Should Avoid Using Bull Pennant Chart Patterns
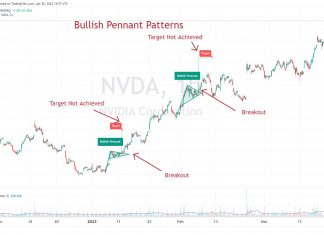
Traders must be cautious when using bull pennant chart patterns. Published research reveals a low success rate of 54% and a meager price increase of 7%.
How to Trade a Falling Wedge’s 74% Chance of a 38%...
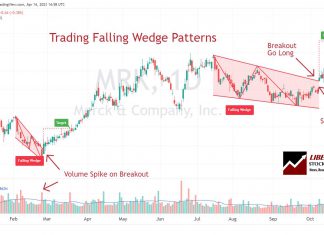
A falling wedge is a technical analysis pattern with a predictive accuracy of 74%. The pattern can break out up or down but is primarily considered bullish, rising 68% of the time.
How to Trade a Triple Bottom Pattern’s 87% Success Rate
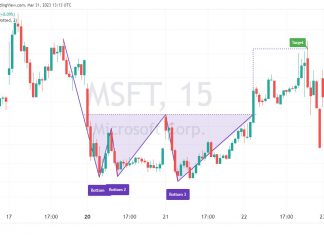
Decades of trading research show the triple-bottom pattern has an 87% success rate in bull markets and an average profit potential of +45%. The triple bottom chart pattern is popular because it is reliable and accurate and generates a good average profit for traders.
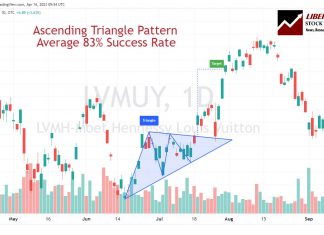
How to Trade an Ascending Triangle Pattern’s 83% Success Rate!
According to two decades of trading research, the ascending triangle pattern has an outstanding 83% success rate with an average potential profit of +43%. It's a well-known, reliable, accurate pattern that can generate good profits.
23 Best Stock Chart Patterns Proven Reliable By Data Testing
Published research shows the most reliable and profitable stock chart patterns are the inverse head and shoulders, double bottom, triple bottom, and descending triangle. Each has a proven success rate of over 85%, with an average gain of 43%.


