A bearish pennant is a continuation chart pattern used in technical analysis to predict future price movements. It is formed by two converging trend lines connecting the swing highs and lows of a stock’s price action.
Traders mistakenly use this pattern to anticipate a continuation of the previous downtrend, as it supposedly suggests that sellers are still in control and likely to push prices even lower.
Traders should avoid using bear pennants. Decades of testing on over 1,600 trades show bearish pennants have a low success rate of 54% and a low price decrease of 6%.
The evidence is clear: pattern trading bear pennants is not worthwhile.
Key Takeaways
- The bear pennant pattern looks like an inverse triangular flag with a pole.
- The pole is a sharp price decline; the flag is a price consolidation.
- A bearish pennant is a supposed continuation pattern, but in reality, it can also reverse.
- Bearish pennants should be avoided as they have a low probability of success.
- If a bearish pennant is successful, its average decrease is only 6%.
Bearish pennants are a subject of interest among traders; however, academic research suggests that caution should be exercised when employing pennant patterns.
What Is a Bearish Pennant Pattern?
A bearish pennant pattern is a chart formation that resembles a triangle with two converging trend lines. It often follows a downtrend and signals a possible continuation of the current trend.
The price action in this chart pattern typically begins with a sharp decrease followed by a period of consolidation, where the stock’s highs and lows begin to converge. A consolidation period is typically followed by another sharp decrease, which indicates the start of the bearish trend.
Is Trading Bearish Pennants Risky?
Though some traders may see the bearish pennant pattern as an opportunity to capitalize on a potential downward price movement in an asset, academic research suggests that these patterns can be unpredictable and thus risky. There is only a 54% chance the breakout will continue downwards and a small average price decrease of 6%.
Would you short-sell a trade setup with only a 54% chance of a 6% price decrease?
As such, investors must use additional technical indicators to confirm whether or not the bearish pennant is an accurate indicator. In addition, traders should also factor in risk management techniques such as setting stop-losses.
Bear pennants are popular with traders, but the truth is, you need to avoid them.
TradingView 4.8/5⭐ : The Best Trading Platform I’ve Tested in 20+ Years
With lightning-fast charts, powerful pattern recognition, smart screening, backtesting, and a global community of 20+ million traders — it’s a powerful edge in today’s markets.

If you want one platform that gives you an edge, this is it.
Why You Should Avoid Bearish Pennants
Although this pattern is generally seen as a continuation pattern, there are many scenarios in which it can be considered as a “false breakout” to the upside. This could occur if prices break out higher from the pennant and form a new high after the formation of the symmetrical triangle. This would indicate a bullish reversal and potentially suggest a small price increase.
Therefore, traders should be aware that the bear pennant pattern is unreliable and can sometimes lead to false breakouts in either direction.
How Reliable is a Bear Pennant?
A bearish pennant is not reliable or accurate, with a 54% success rate on a downside breakout, achieving an average 6% profit in bull markets. This pattern’s failure rate is 46%, which must be avoided.
| Chart Pattern | Success Rate | Average Price Change |
| Bearish Pennant | 54% | +6% |
Source Research Courtesy of Tom Bulkowski@The PatternSite.com.
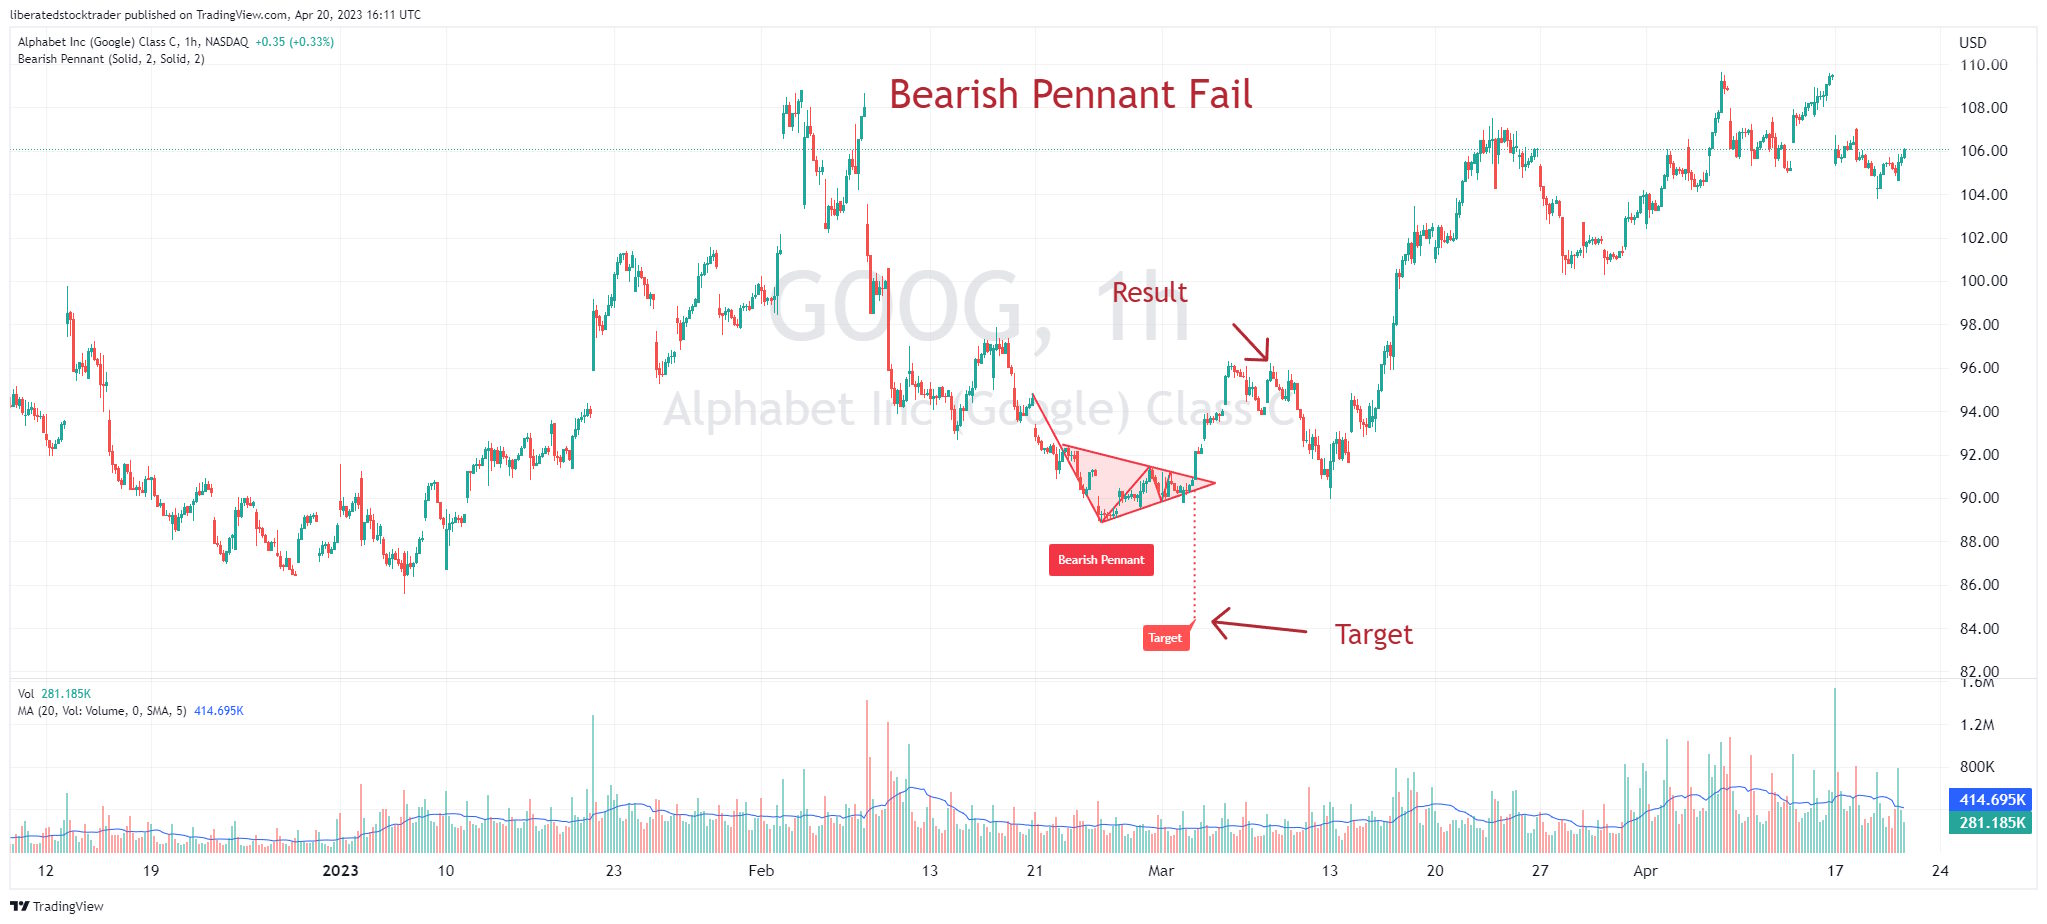
Why Do Most Bearish Pennants Fail?
Bearish pennants fail because the period of price consolidation after the price rise does not allow a strong imbalance in the supply and demand between buyers and sellers to form. Therefore, the pattern is weak and unreliable.
Auto-detect All Chart Patterns with TradingView
This bearish pennant chart has been autodetected using TradingView’s pattern recognition algorithms. Notice how the target price is automatically calculated.
Due to the nature of this pattern, it is difficult to determine which way prices will break out and if a breakout is likely at all. This makes it difficult to anticipate price movements and can lead to losses.
The pennant shape can resemble patterns like symmetrical or ascending triangles, which makes it tough to determine price movements accurately. Additionally, the pattern only applies for a short period, so there could be a loss if prices don’t break out before the timeframe expires.
Identifying a Bearish Pennant
A bearish pennant pattern is formed by two converging support/resistance lines that contain prices until they break out. It appears after a downtrend and must be followed by a breakout. When prices break through the lower trendline and continue lower, it confirms the pattern.
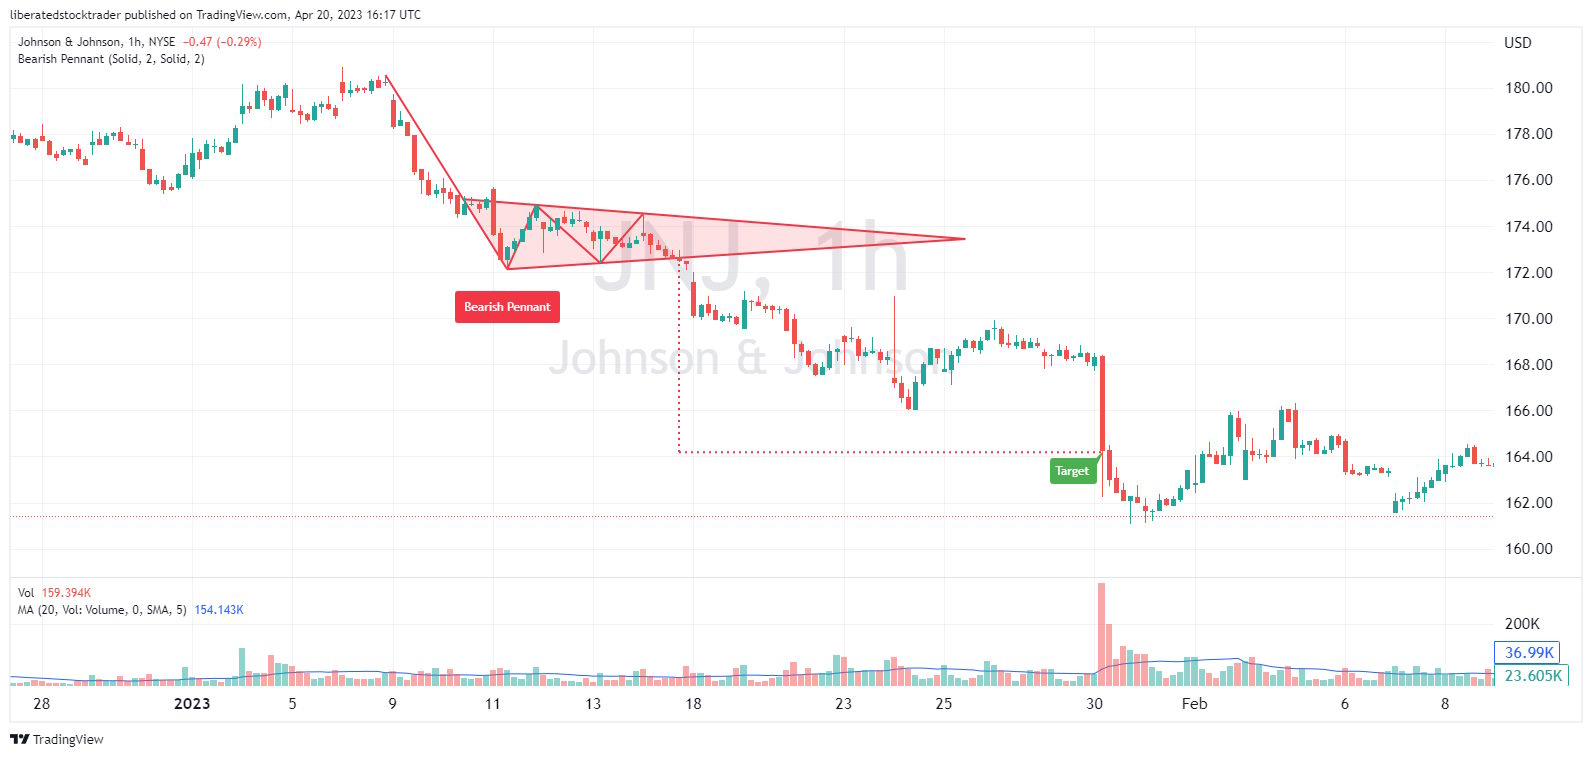
Above, we see an example of a bear pennant working. In this case, the price broke downwards and hit its target of -7%. TradingView’s algorithms automatically recognized the pattern, and the target, flagged in green, was met.
I would advise trading chart patterns with higher proven success rates, such as the rectangle or triple bottom.
Is the Bear Pennant a Continuation Pattern?
The bearish pennant pattern is considered a continuation pattern, but the evidence shows it is both a continuation and a reversal pattern. The bear pennant has a 50% chance of continuing or reversing the trend. Considering the average change after the breakout is only 6%, it is not worth trading this pattern. It would be better to trade the more successful cup and handle pattern.
Trading a Bear Pennant
Statistical evidence suggests you should not trade a bearish pennant. The bear pennant is an unreliable indicator, as evidenced by over 1,600 perfect trades tested in the Encyclopedia of Chart Patterns.
When trading a bear pennant chart pattern, traders should wait for the price to break out in either direction and place a tight stop loss because of the unreliability of this pattern.
It is important to note that traders should wait for a confirmed breakout before entering into a trade, as false breakouts above or below the flag triangle pattern can often occur.
Traders should pay attention to volume when trading a bearish pennant pattern. Higher volume on the downward breakout is often considered a trend confirmation. This means traders should be vigilant and wait for higher volumes before entering a trade on any breakout situation.
The Psychology of Bear Pennants
The bearish pennant’s psychology lies in the consolidation stage, which occurs during the pattern’s flag section and involves a struggle between buyers and sellers. During this stage, buyers aim to increase prices while sellers work to keep them down.
This leads to prices remaining in a tight range for several weeks. When sellers eventually triumph, prices break below the support, and a surge of new sellers usually enters the market. This results in higher trading volumes and lower prices. Traders can take advantage of this phase, known as the breakout stage.
The Bearish Pennant Timeframe
Bearish pennants can form on any timeframe but occur more frequently on intraday and hourly charts. Pennants happen quickly and usually last no longer than three weeks.
What Happens After a Bear Pennant?
Two decades of research by Tom Bulkowski show that after a bear pennant pattern is confirmed on a price breakout, there is a 54% chance of a successful trade averaging -6%. These are very poor probabilities and will negatively impact a trader.
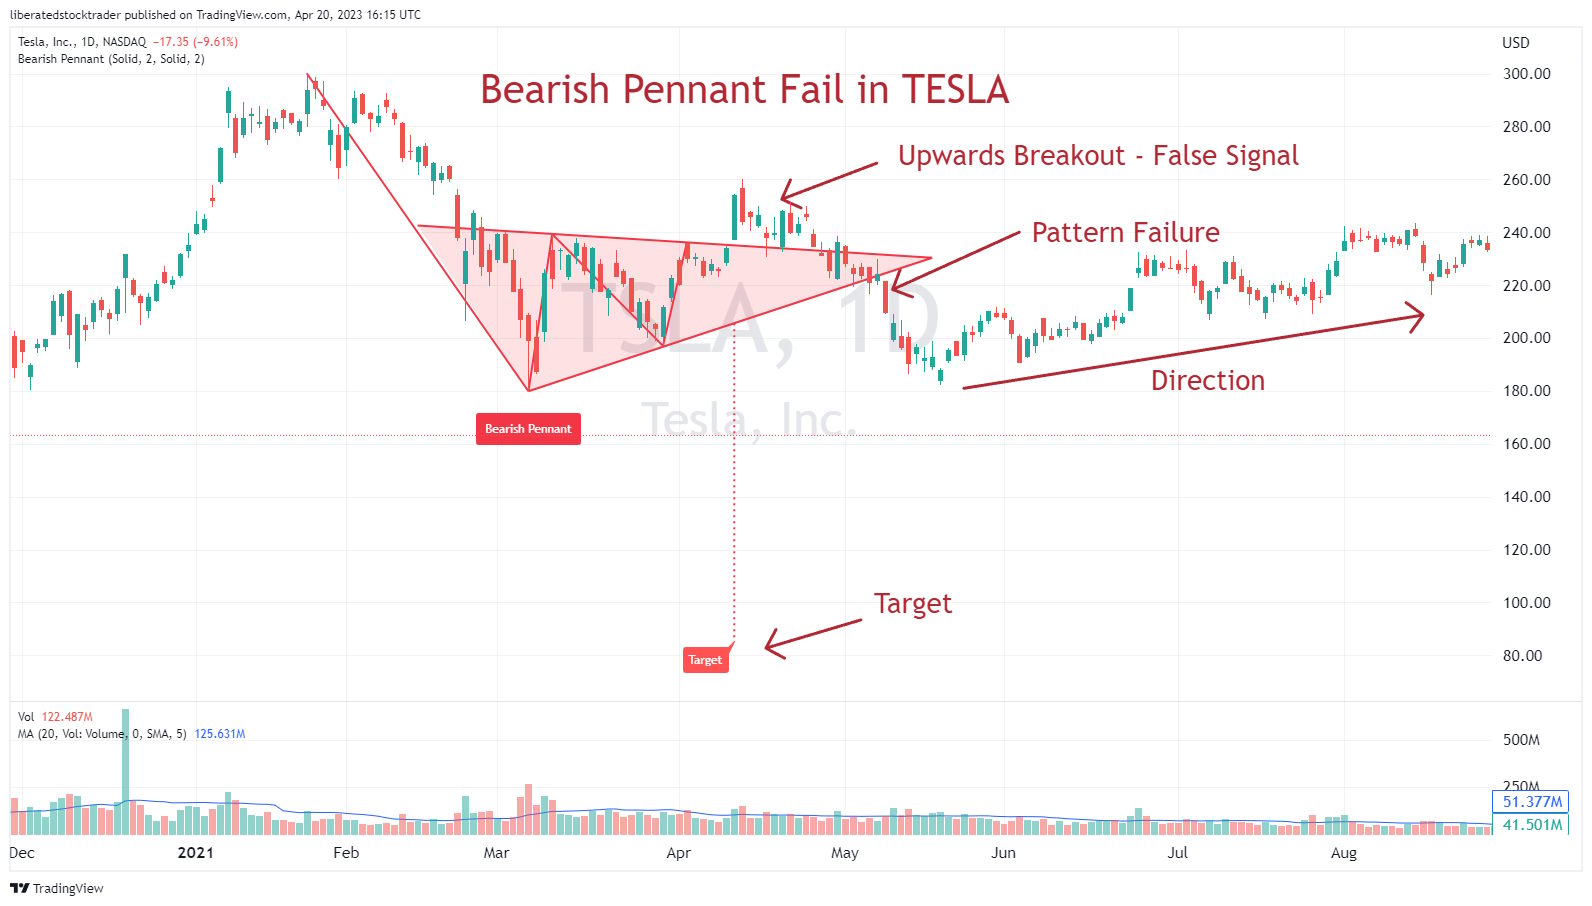
What Happens with a Failed Bear Pennant Pattern?
A bear pennant in a bull market rises 46% of the time. When a bear pennant pattern fails, the asset price fails to achieve the price target or reverses, pushing the trade into a loss situation. At this point, it makes sense to discard the pattern.
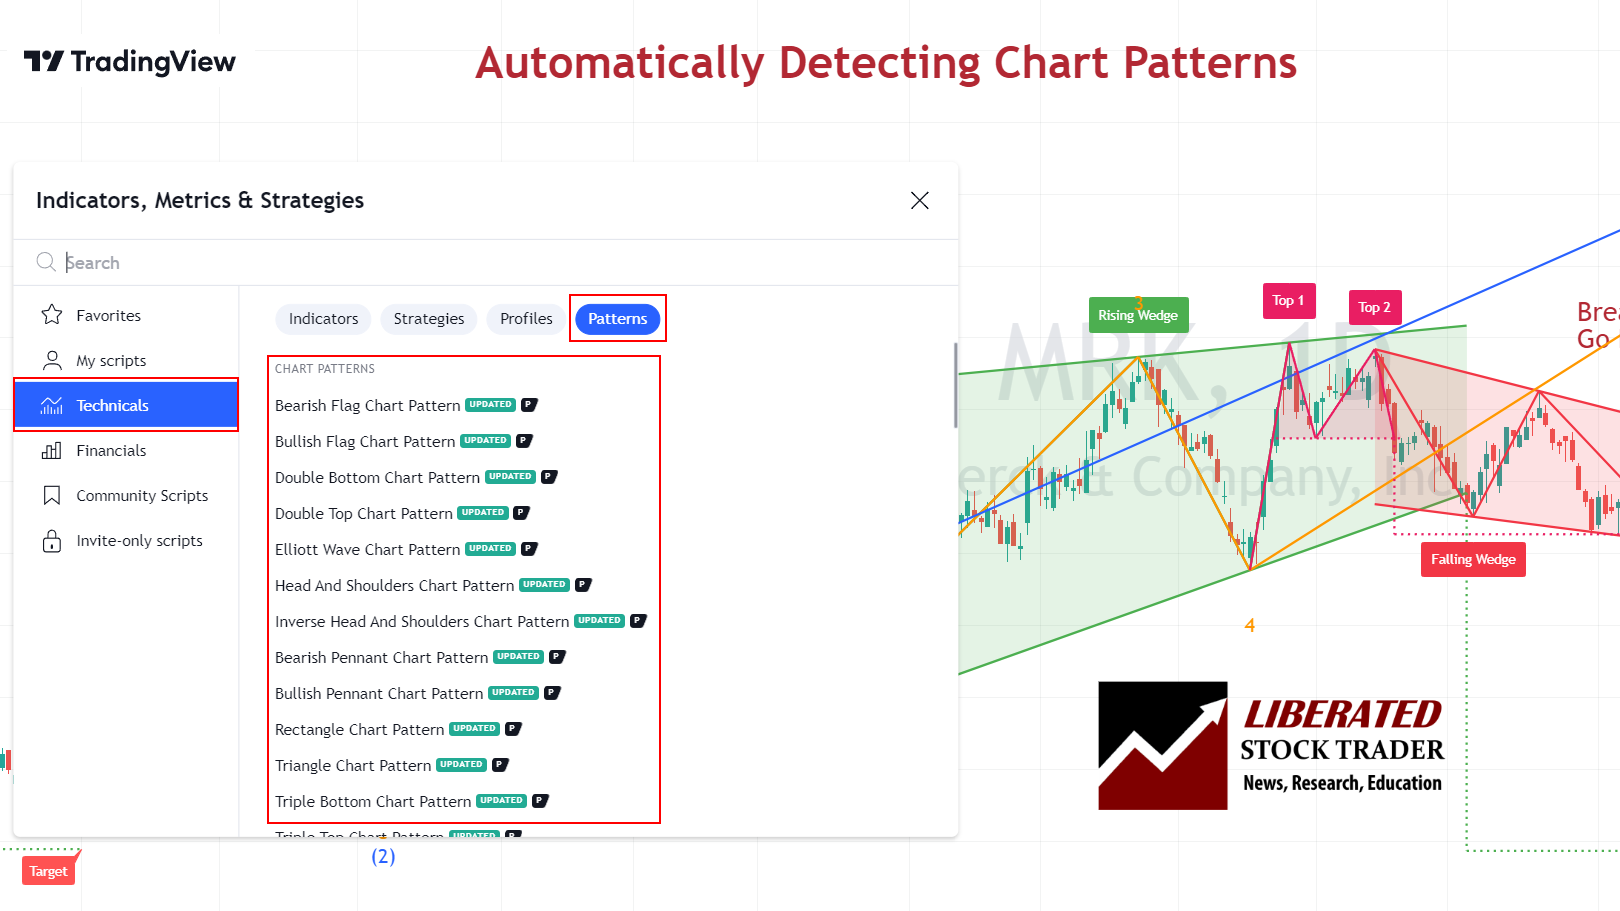
Automatically Identify Bear Pennants
Using TradingView, you can automatically identify bearish and bullish pennant patterns. Go to TradingView and click Indicators > Technicals > Patterns. Next, select Bearish Pennant Chart Pattern. Now, a chart with a bear pennant pattern will be clearly marked.
Auto-detect Bear Pennants with TradingView
What are the Bear Pennant Rules?
- Do not trade the bear pennant.
- The bear pennant patterns appear during moderate price declines.
- The bear pennant is more successful after an extreme price decline.
- If the price breaks out higher, the pattern has failed.
The Best Chart Pattern Scanners
Two trading platforms offer deep pattern scanning and screening: TrendSpider and FinViz. Finviz is a good free pattern scanner, whereas TrendSpider enables full backtesting, scanning, and strategy testing for chart patterns.
TrendSpider Chart Pattern Scanning
Scanning for chart patterns with TrendSpider is easy. Visit TrendSpider, select Market Scanner > All of the Following > Chart Pattern > Scan, and you will be presented with a list of stocks with bearish patterns.
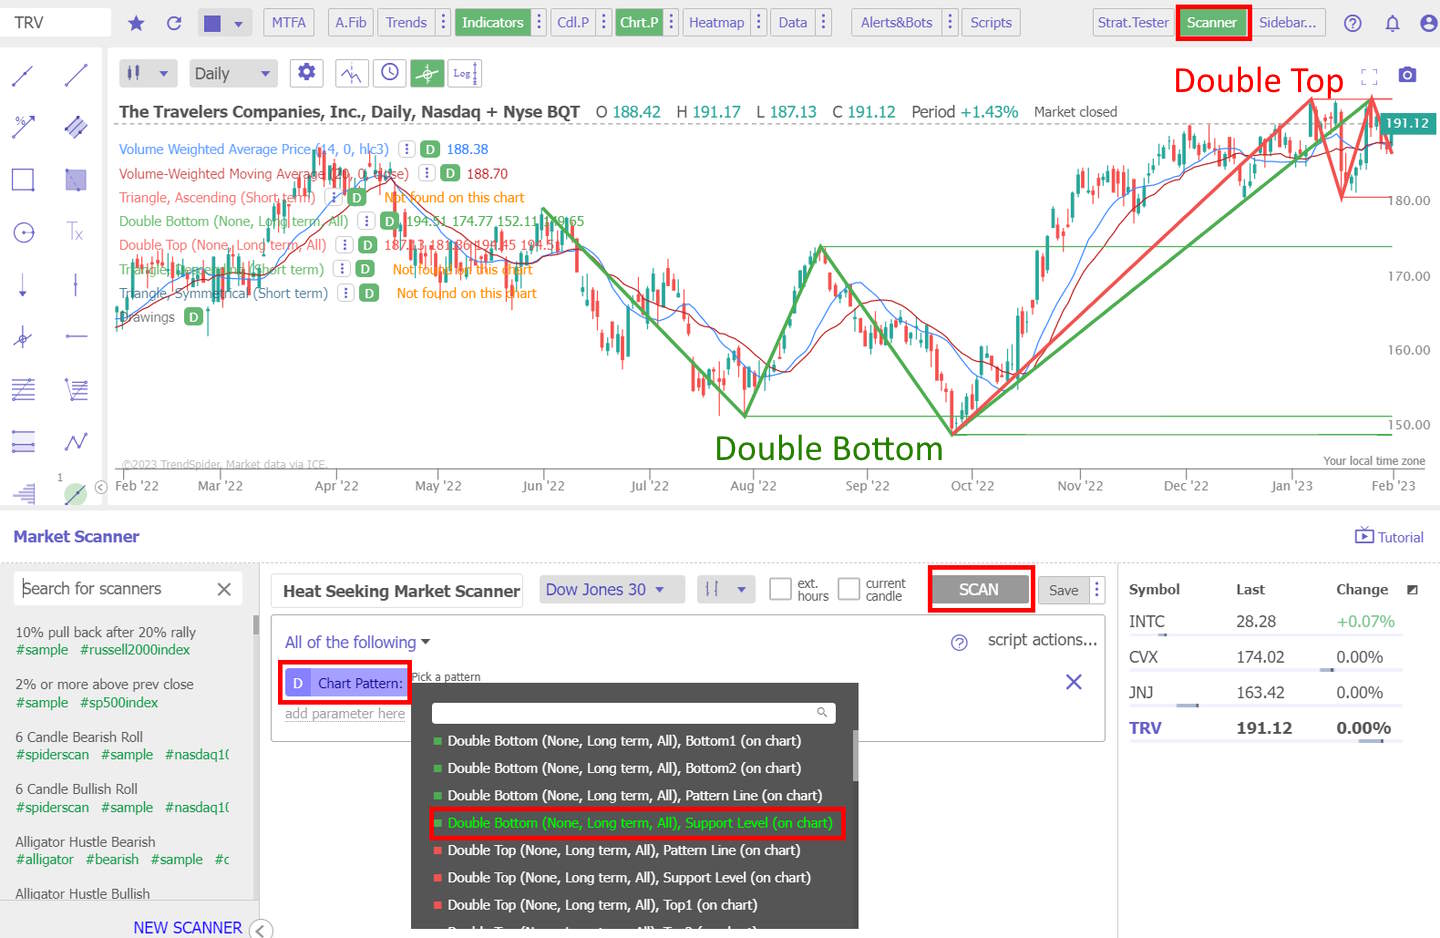
Scan for this Chart Pattern with TrendSpider
Using AI-Driven Technical Analysis
One of the primary advantages of using AI-driven technical analysis tools such as TrendSpider is the capability to backtest historical data. This enables traders to compare the efficiency of their strategy over different periods and markets.
With TrendSpider, you can revisit stocks portraying bearish pennant patterns and then use the platform’s sophisticated analytical tools to scrutinize how effectively this pattern worked for trading at any given time. Moreover, TrendSpider’s AI-driven algorithms help traders detect the most credible entry and exit points for patterns.
Scan for Profitable Patterns with FinViz
FinViz’s scan feature for chart patterns is an excellent tool for traders seeking to monitor potential trading opportunities. You can easily locate stocks exhibiting this pattern by setting a bear pennant as your scan criteria.
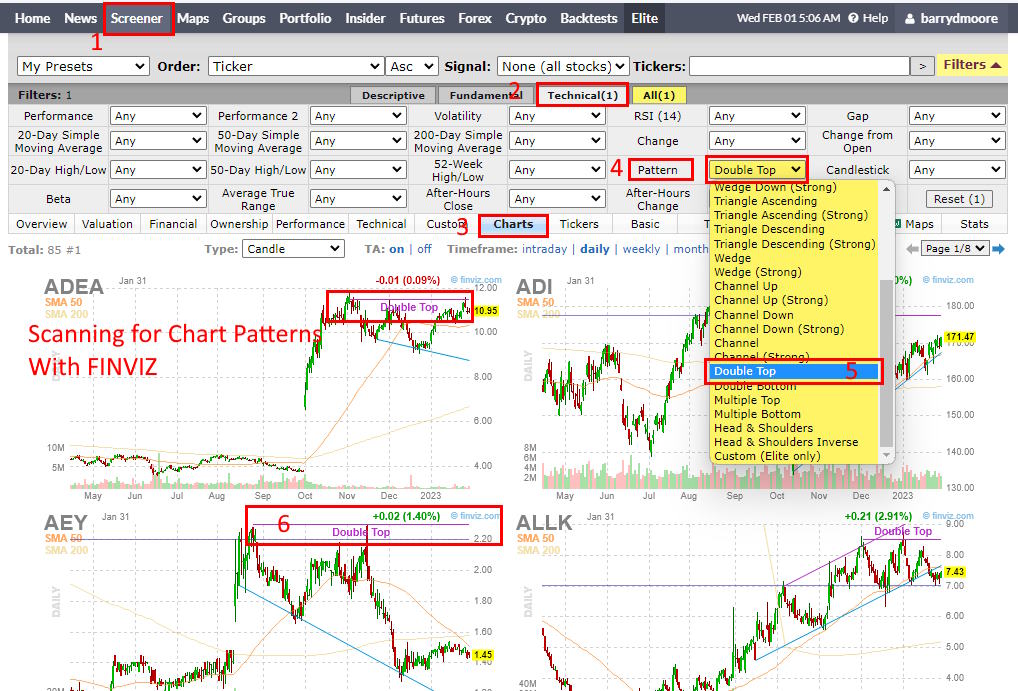
Scan for this Chart Pattern with FinViz
The first step to finding stocks with bearish patterns is to select a set of criteria. FinViz offers a range of pre-defined filters and sorting options, enabling traders to quickly narrow their search by sector, industry, market capitalization, and more. After selecting the desired criteria, traders can apply the filter to the Finviz screener.
Once the filter has been applied, traders can then view the results on a chart interface. Depending on the complexity of the search, several stocks may meet the criteria. By clicking on each stock name, traders can open up a chart.
FAQ
What are the risks of trading a bear pennant?
The biggest risk of trading a loose bearish pennant is a 46 percent chance of the pattern failing. Traders must ensure they identify a better-performing chart pattern with a higher success rate or the trade may fail.
Do bearish pennants hold?
Bearish pennant patterns hold only 54 percent of the time on either an up or down breakout, according to decades of research compiled by Tom Bulkowski in his book The Encyclopedia of chart patterns. This means it should be avoided in trading.
How to identify bearish pennants?
Bearish pennant patterns can be identified automatically with TradingView. Alternatively, you can manually identify it by looking for a sharp price decrease (flag pole) followed by a symmetrical triangle price consolidation (flag).
How to measure a bearish pennant pattern?
TradingView can automatically measure a bearish pennant pattern to set a price target. Alternatively, to measure manually, use an arithmetic chart and plot the length of the downtrend prior to the pennant. This distance will be the future price which you should annotate on the chart in the breakout direction.
Is a bearish pennant a continuation or reversal pattern?
Testing shows that bearish pennants are both reversal and continuation patterns. This means the pattern is not predictive, and the price could move in any direction, rendering the future trade invalid.
What are the best bearish pennant pattern scanners?
The best pennant pattern scanner is TradingView. Every chart you review in TradingView will automatically be scanned for pennants. TradingView also has backtesting and strategy development.
Is a bear pennant pattern profitable?
No, a bear pennant pattern is a weak signal for traders and is not profitable. It provides an inaccurate way to identify potential short-selling opportunities creating low-probability trades. Tom Bulkowski's research confirms an accuracy of 54 percent for bearish pennant patterns with an average profit potential of 6 percent.
Can a bearish pennant fail?
Yes, almost half of the bearish pennants fail. The typical bearish pennant identified has a weak trend after the pattern confirms, meaning the price has a high probability of retracing against the trade.
How reliable is a bearish pennant pattern?
The bearish pennant pattern is an unreliable chart indicator, with success rates of 54 percent during a bull market and a low average profit of 6%. It is one of the most inaccurate chart patterns.
Is a bearish pennant good or bad?
Considering the evidence, the bearish pennant is a bad pattern for traders to use. Do not trade bearish pennants, they have a 46% failure rate, and even if they succeed, they only average a 6% price decrease.
What is the success rate of a bearish pennant?
According to Tom Bulkowski's research, the success rate of a pennant is a 54 percent chance of a 6 percent price decrease in a bull market on a continuation of a downtrend. Traders should note this means a 46 percent failure rate.
How do you target stop losses in bearish pennant patterns?
Traders should set the approximate target stop loss level in a bearish pennant at the point above the breakout of the bearish pennant. The exact percentage stop loss depends on the price target expectations and the timeframe.
What are the benefits of trading bearish pennants?
There are no benefits to trading bearish pennant patterns. The bearish pennant setup provides a very limited 6% gain and an erratic trend. Additionally, traders cannot identify accurate target prices before entering the trade.
How accurate is a bearish pennant pattern?
Published research demonstrates most bearish pennants fail 46 percent of the time, and even if they succeed, there is only a minimal average price decrease of 6 percent, according to The Encyclopedia of chart patterns.
Can a bearish pennant be bullish?
Bearish pennants can be bearish or bearish, depending on the direction of the price breakout. But a bearish pennant is such a poor-performing pattern it can be misleading and cause many false breakouts and small losses.
Learn the Success Rates of 65 Chart Patterns
The Encyclopedia of Chart Patterns by Tom Bulkowski details the reliability and success rates of 65 chart patterns and shows you how to trade them. It is an indispensable resource for traders and investors seeking to enhance their profitability by leveraging stock chart patterns. This comprehensive reference book provides in-depth explanations and detailed illustrations of over 65 different patterns, including Head and Shoulders, Double Tops, Wedges, Flags, Gaps, and more.
