The Butterfly Pattern is one of six harmonic patterns in technical analysis. Based on Fibonacci ratios, it is employed by traders to pinpoint potential market reversal points.
Traders can leverage the Butterfly Pattern to pinpoint and profit from potential trend reversals. The pattern comprises four crucial pivot points: XA, AB, BC, and CD. These pivots are pinpointed through Fibonacci ratios, signaling precise price levels where traders can anticipate shifts in trends.
Butterfly wing patterns and harmonic patterns in financial markets share similarities. Traders use formations to forecast market movements. However, there is little evidence of structured backtesting of the butterfly pattern. I attempt to discover if it really works and if you should trade it.
Key Takeaways
- The Butterfly is a harmonic pattern based on the math of Fibonacci numbers.
- It is a technical analysis pattern that traders use to identify potential market reversals.
- The Butterfly is difficult to manually identify because its four key pivot points, XA, AB, BC, and CD, use specific Fibonacci ratios.
- Traders can use a TradingView Harmonics indicator to identify and backtest the pattern on charts automatically.
- The bullish butterfly performs well on daily charts for individual stocks.
- The bearish Butterfly should be avoided, based on my testing.
Butterfly Harmonic Pattern Explained
The Butterfly Harmonic Pattern is a complex chart price pattern used by technical analysts to predict potential trend reversals. It uses Fibonacci ratios to identify specific price points where reversals are likely to occur.
Bryce Gilmore identified it, and Scott M. Carney improved upon it in his book Harmonic Trading Volume One. However, when I read the book, no backtesting was performed, and there was little evidence that this pattern actually worked consistently. In this article, I will attempt to quantify its importance in trading.
Identifying the Butterfly Pattern
The Butterfly Pattern is composed of four distinct legs: XA, AB, BC, and CD.
- XA Leg: This initial leg marks the upward or downward movement.
- AB Leg: Retraces 78.6% of XA.
- BC Leg: Extends 38.2% to 88.6% of AB.
- CD Leg: Extends to 161.8%–224% of BC, culminating at the potential reversal zone.
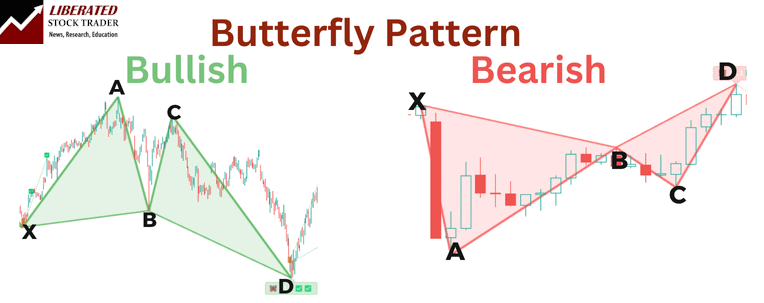
The use of Fibonacci ratios is critical, with the CD leg often considered the most crucial for identifying a reversal point. These exact measurements are crucial for the pattern’s accuracy.
The butterfly pattern expands on earlier harmonic concepts, notably the Gartley Pattern. Unlike the Gartley Pattern, the Butterfly pattern reverses near the start of the XA leg. This pattern utilizes precise Fibonacci measurements to identify potential reversal zones.
Automating Butterfly Pattern Identification
Harmonic patterns like the Butterfly are difficult to identify manually. However, you do not need to manually hunt for them because TradingView has a special indicator that can detect all harmonic patterns automatically.
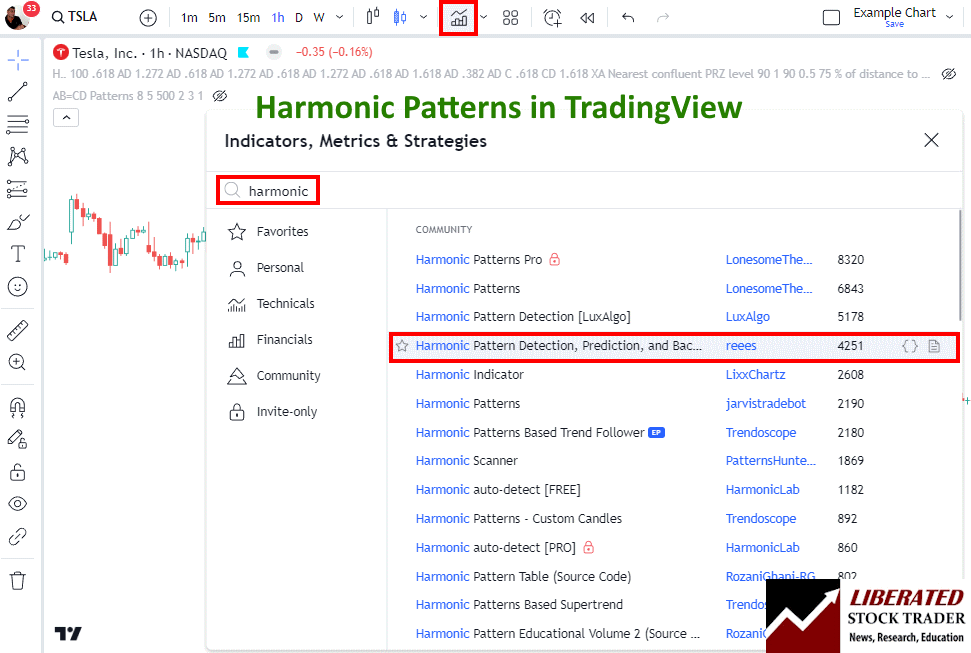
I have tested most of the harmonic indicators in TradingView, and the best one to enable is below.
To enable automated harmonic pattern detection in charts, follow these steps:
- Visit TradingView
- Select Indicators -> Search for Harmonic
- Select Harmonic Pattern Detection by User “Reees”
This script not only identifies the patterns but also performs backtesting automatically.
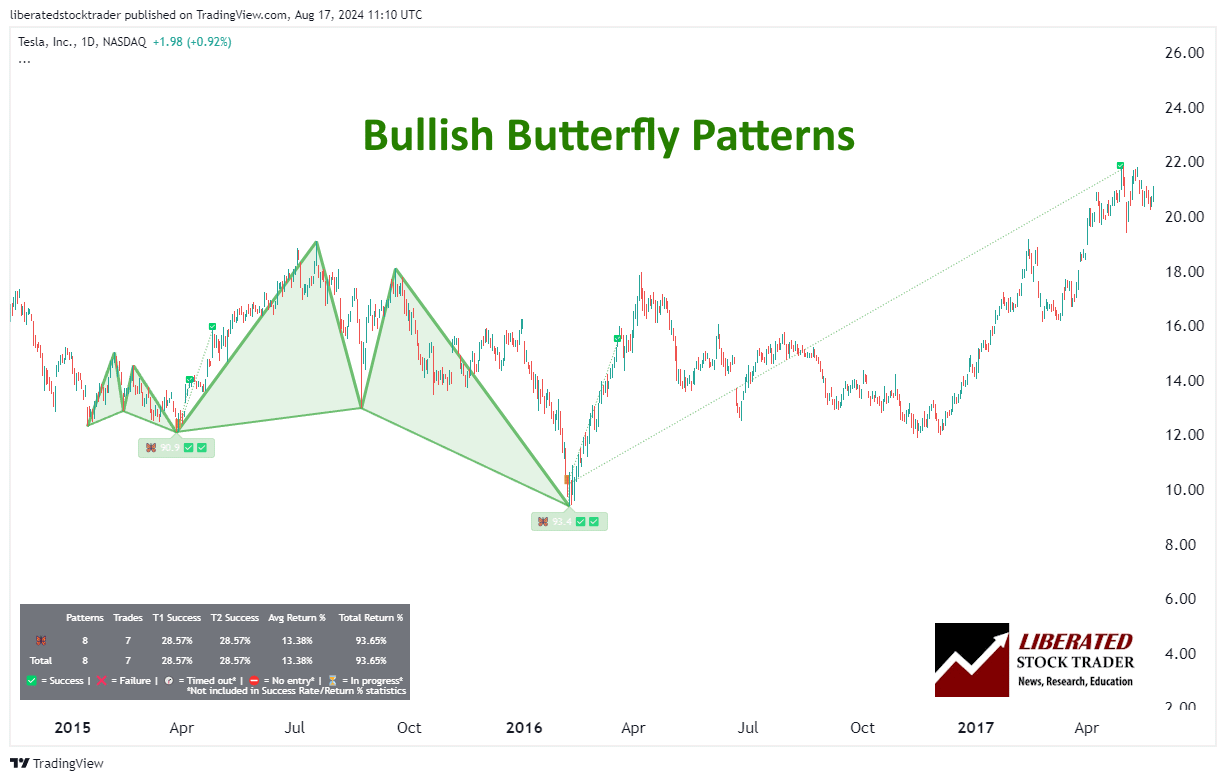
Trading a Bullish Butterfly
In a Bullish Butterfly Pattern, traders look for buying opportunities as the pattern suggests a reversal from a downtrend to an uptrend around the potential reversal zone. The pattern typically forms near significant support levels.
The Bullish Butterfly should be traded in a downtrend during a bull market. Here are six steps for trading it.
6 Steps for Trading a Bearish Butterfly
- Ensure the pattern occurs in a downtrend in a bull market.
- When point D is confirmed, wait for a price increase to begin.
- Set a stop-loss between point D and point X.
- The initial price target is a Fibonacci retracement of 61.8% of point CD. That means if point C was $10 and D was $5, you can expect the price target to be approximately $8.09. ($10-$5)*0.618 + $5 = $8.09
- Once the price reaches the initial target, consider taking partial profits and trailing your stop-loss to secure any gains.
- If the price continues to rise, you can use additional Fibonacci retracement levels as potential exit points or set a new take-profit point at a key resistance level.
Is the Bullish Butterfly Reliable & Profitable?
Yes, based on our backtested trades on 23 years of Nasdaq 100 exchange data, the bullish Butterfly pattern achieved its price target 53.33% of the time, with a 1.24% average return per trade.
Performance varies incredibly for each stock; for example, Meta Platforms Inc. had a 70% chance of hitting its price target, with a 2.99% average gain per trade. Moreover, Crowdstrike Holding Inc. boasted an 80% probability of reaching its price target, securing an average gain of 9.93% per trade.
Trading a Bearish Butterfly
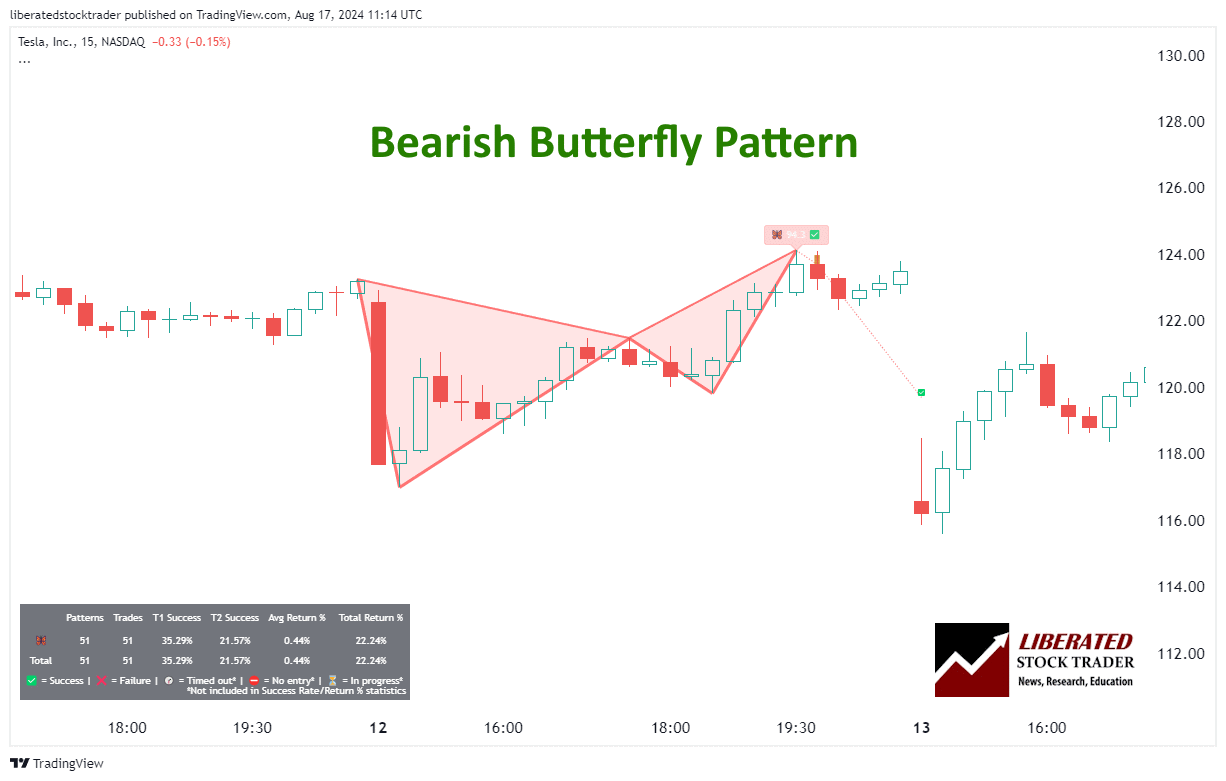
A Bearish Butterfly Pattern signals a selling opportunity, marking a likely reversal from an uptrend to a downtrend. The Bearish Butterfly should be traded in an uptrend during a bear market. Here are six steps for trading it.
Automatic Butterfly Pattern Recognition with TradingView
6 Steps for Trading a Bearish Butterfly
- Ensure the pattern occurs in an uptrend in a bear market.
- When point D is confirmed, wait for a price decrease to begin.
- Set a stop-loss between point D and point X.
- The initial price target is a Fibonacci retracement of 61.8% of point CD. That means if point C was $10 and D was $15, you can expect the price target to be approximately $13.36 ($15-$10)*0.618 + $10 = $11.91
- If the price reaches the initial target, consider taking partial profits and trailing your stop-loss to secure any gains.
- If the price continues to decrease, you can use additional Fibonacci retracement levels as potential exit points or set a new take-profit point at a key support level.
In both patterns, identifying the potential reversal zone through Fibonacci extensions ensures accurate predictions of market movements, making the Butterfly pattern a reliable tool for traders.
Is the Bearish Butterfly Reliable & Profitable?
No, based on our backtested trades on 23 years of Nasdaq 100 exchange data, the bearish Butterfly pattern achieved its downside price target 47.37% of the time, with a very low 0.13% average return per trade.
Performance varies incredibly for each stock; for example, using this pattern on Apple Inc. would have made a loss of 0.33% per trade.
Tesla Inc. had a 33% chance of hitting its price target, with a low 0.61% average gain per trade. Moreover, Netflix Inc. would have netted an average loss of 1.17% per trade.
Trading Strategies Using the Butterfly Pattern
In terms of butterfly trading strategy, I would recommend trading only bullish Butterflies and avoiding their bearish counterparts, as the backtesting data suggests.
Identifying Potential Reversal Zones
To identify Potential Reversal Zones (PRZ) within the Butterfly Pattern, traders look for convergence of Fibonacci retracements and extensions. For instance, the completion of the pattern often occurs when the last price leg reaches 127.2% Fibonacci extension of the XA leg and 78.6% retracement of the AB leg.
When both conditions are met, it indicates a high-probability reversal zone. Recognizing this helps traders anticipate where the trend is likely to change direction, providing a crucial edge in timing market entries and exits.
Setting Up Entry, Stop, and Target Points
After identifying the PRZ, setting up entry points involves placing buy or sell orders near these zones. For a bullish Butterfly Pattern, the buying point is set below point D. Conversely, for a bearish pattern, it occurs above the potential resistance level identified at point D.
Stop losses are essential for risk management and should be placed slightly beyond point D to account for market volatility. Target points are usually set at key Fibonacci levels, such as 38.2% and 61.8% retracements of the prior move, ensuring that traders capture potential profits effectively.
Integrating Technical Indicators
Incorporating technical indicators like the Relative Strength Index (RSI) and the Alligator indicator can enhance the accuracy of Butterfly Pattern trading. The RSI helps gauge the strength of the trend and identify overbought or oversold conditions that align with potential trend reversals indicated by the Butterfly Pattern.
These indicators add an additional layer of validation, helping traders navigate the market with greater precision and reliability.
Do Butterfly Patterns Work?
Yes, bullish Butterfly patterns work, but only between 48% and 80% of the time on individual stocks. The profit per trade can vary widely between stocks, from fractions of a percent to 6 or 7% per trade.
Testing the Butterfly on major Forex pairs did not yield strong results, with an average win percentage of 45% and a 0.29% average return.
Is the Butterfly Pattern a Good Trade?
Yes, the bullish Butterfly pattern shows strong numbers in our tests, but you should avoid trading the bearish Butterfly. After my backtesting, I can confirm bearish Butterfly is unreliable, with a low reward-to-risk ratio, and it is worth avoiding.
Try TradingView, Our Recommended Tool for International Traders
Try TradingView, Our Recommended Tool for International Traders
Global Community, Charts, Screening, Analysis & Broker Integration
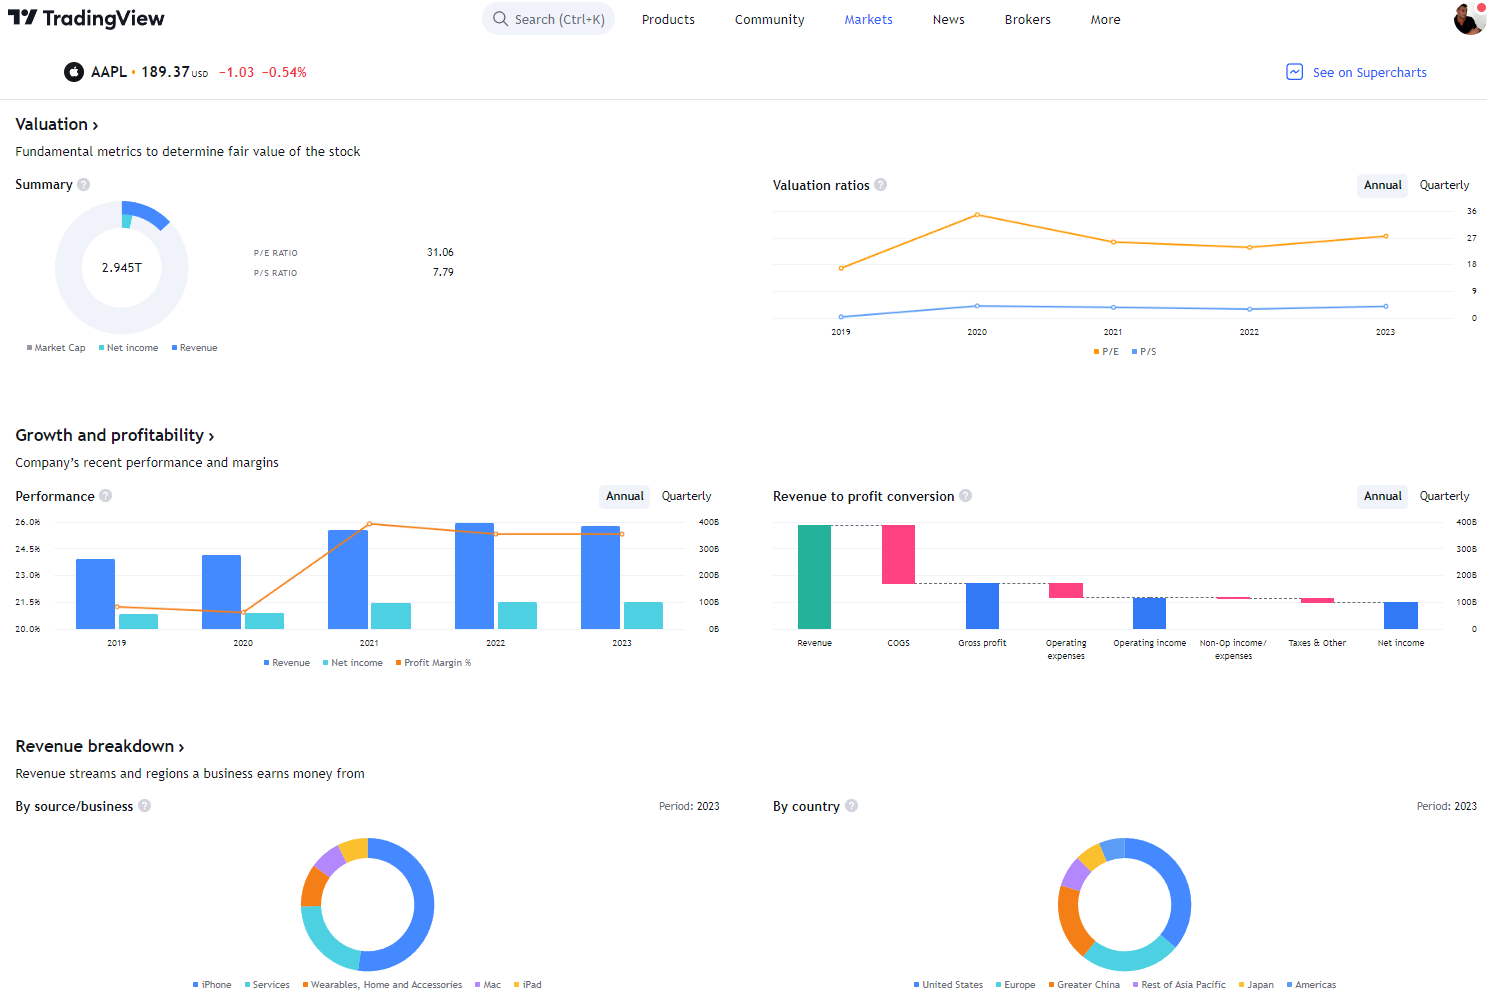
Global Financial Analysis for Free on TradingView
Other Harmonic Patterns
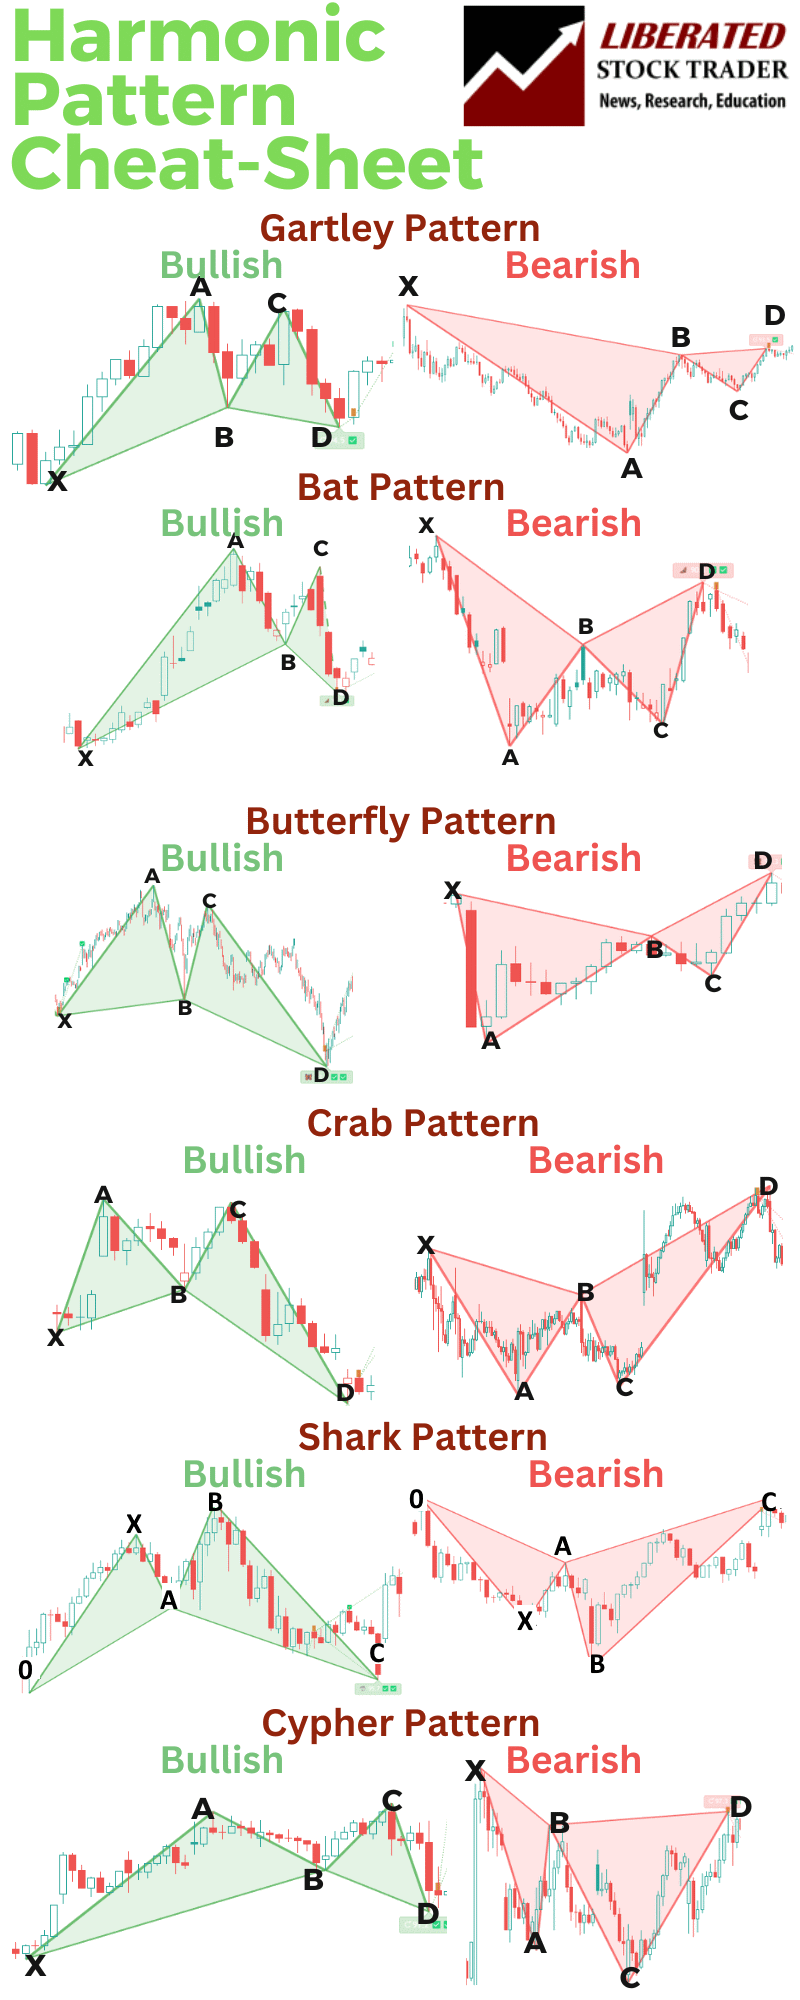
The six key harmonic patterns in technical analysis are Gartley, Bat, Crab, Butterfly, Shark, and Cypher. While the Gartley pattern is widely used, understanding all patterns is crucial for harmonic traders.
The Bat pattern resembles the Gartley but features deeper retracements of 88.6% instead of 61.8%. The Crab pattern goes even further with a retracement level of 161.8%, known for its reliability among short-term traders.
Butterfly and shark patterns involve retracements of 127% and 161.8%, respectively, presenting higher risks but also potential rewards for patient and disciplined traders.
The Cypher pattern, a recent inclusion, features a modest retracement level of 113%. While it adheres to specific rules and ratios, slight variations in its occurrence are possible.
Our Harmonic Patterns Cheat Sheet
FAQ
What is the best software for trading a Butterfly chart pattern?
After extensive testing, I personally use TradingView to backtest and trade harmonic patterns like the Butterfly. It has a custom indicator called Harmonics that automatically detects all harmonic patterns.
How do you identify a butterfly pattern in trading charts?
A butterfly pattern in trading charts is identified by its distinct shape. It consists of an initial leg (XA), followed by a retracement (AB), another leg (BC), and a final leg (CD). The crucial points are determined by Fibonacci ratios, which help spot the pattern.
What are the key characteristics of a butterfly pattern in technical analysis?
The butterfly pattern features specific Fibonacci ratios: The AB leg retraces 78.6% of the XA leg. The BC leg retraces 38.2% to 88.6% of the AB leg. The CD leg extends 127% to 161.8% of the XA leg, completing the pattern.
How do you draw a butterfly chart pattern for beginners?
To draw a butterfly pattern, start with the XA leg, then measure the AB retracement. Next, plot the BC and CD legs using Fibonacci extensions. Beginners should use charting tools that offer harmonic pattern drawing features to ease the process. Practice is essential to identify these patterns accurately.
What are the differences between bullish and a bearish butterfly patterns?
Both bullish and bearish butterfly patterns have the same structure but differ in their orientation. In a bullish butterfly, the CD leg forms a low point, suggesting a potential upward price movement. In contrast, a bearish butterfly's CD leg forms a peak, indicating a possible downward trend.
What are the essential rules to follow when trading with the Butterfly harmonic pattern?
When trading with the butterfly harmonic pattern, traders should:
- Confirm Fibonacci ratios precisely.
- Wait for a breakout or reversal signal before entering a trade.
- Use stop-loss orders to manage risk effectively.
- Ensure that the pattern aligns with broader market trends.
How to Trade the Gartley Pattern. I Test If It Really Works!
