Is the Inverted Hammer worth trading? To discover the facts, I backtested 1,702 trades spanning 20 years across multiple bull and bear markets.
My research shows the Inverted Hammer is the most accurate and profitable candlestick pattern. Based on 588 years of exchange data, it has a 60% success rate and an average win of 4.2%.
Prepare to learn to trade the Inverted Hammer pattern based on proven data!
RESEARCH SUMMARY
- The Inverted Hammer is the most reliable candle pattern, with a high win rate of 60%.
- The Inverted Hammer pattern predicts a bullish move with 60% accuracy.
- The profit per trade is 1.12%, which is twice the performance of the average candlestick we tested.
- Our testing suggests that the Inverted Hammer should be the core of any candle trading strategy.
What Is an Inverted Hammer Candle?
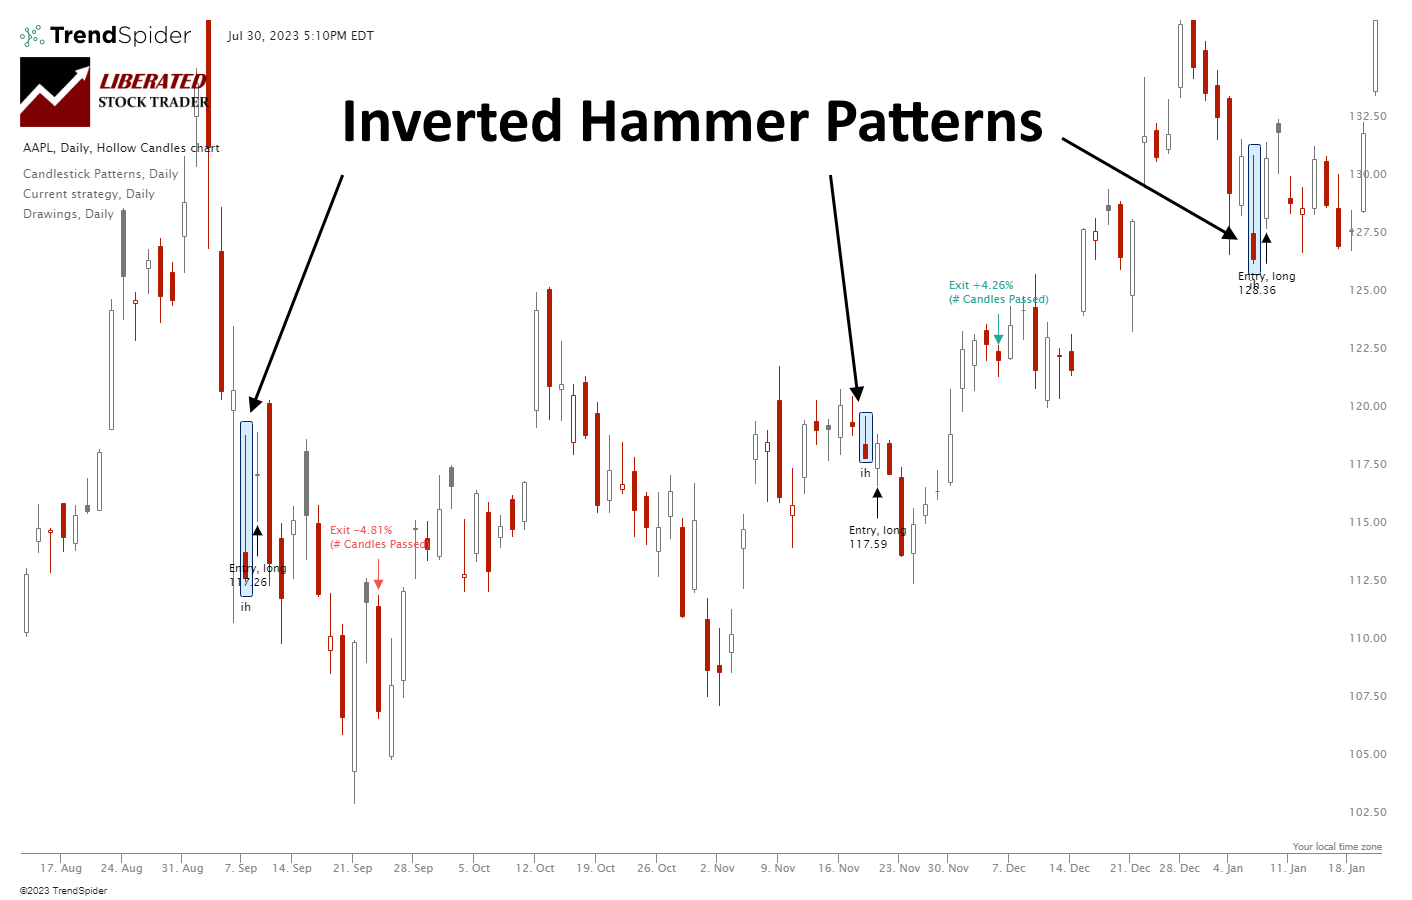
In technical analysis, the Inverted Hammer candle is a price pattern that signals a potential reversal in trend direction. It is characterized by a small body and a long upper wick, resembling an upside-down hammer, hence its name. The Inverted Hammer occurs when the open and close price of the candle body are at a similar level, and the candle’s upper wick (or shadow) is at least twice as long as the lower wick.
An inverted hammer candle is a lesser-known pattern in Japanese candlestick analysis, but according to our testing, traders should use it more often.
When an Inverted Hammer candle occurs, it represents a potential turning point in the market. Traders see it as a signal that the market could soon be reversing from a downtrend to an uptrend. This candlestick pattern indicates that the selling pressure at the opening of the trading period has been overcome by buying pressure, pushing the price back up above the low for the day but still closing near the bottom of the range.
Traders believe this signifies buyers gaining momentum against sellers, heralding a potential bullish trend. Our decades of research suggest this theory is correct.
TrendSpider 4.8/5⭐: My Pick for AI-Power & Auto-Trading
I’ve used TrendSpider for 7 years for my research and testing. It auto-detects trendlines, patterns, and candlesticks, backtests ideas, and lets you use AI to create unique strategies and launch trading bots—with no code.

Save 38% to 45% on TrendSpider
Our Top Rated 4.72 ⭐ Trading Tool
✅ Leader in AI Trading & Chart Pattern Recognition
✅ Scanning & Auto-Trading
Deal Ends In:
Types of Hammer Candle
There are two types of Hammer candles: the Hammer and the Inverted Hammer. The Hammer is a low-probability trade and one of the poorest-performing candlestick patterns we have tested. But the Inverted Hammer is the opposite; it is the best candlestick pattern with the highest win rate and profit per trade.
Inverted Hammer Candle Explained
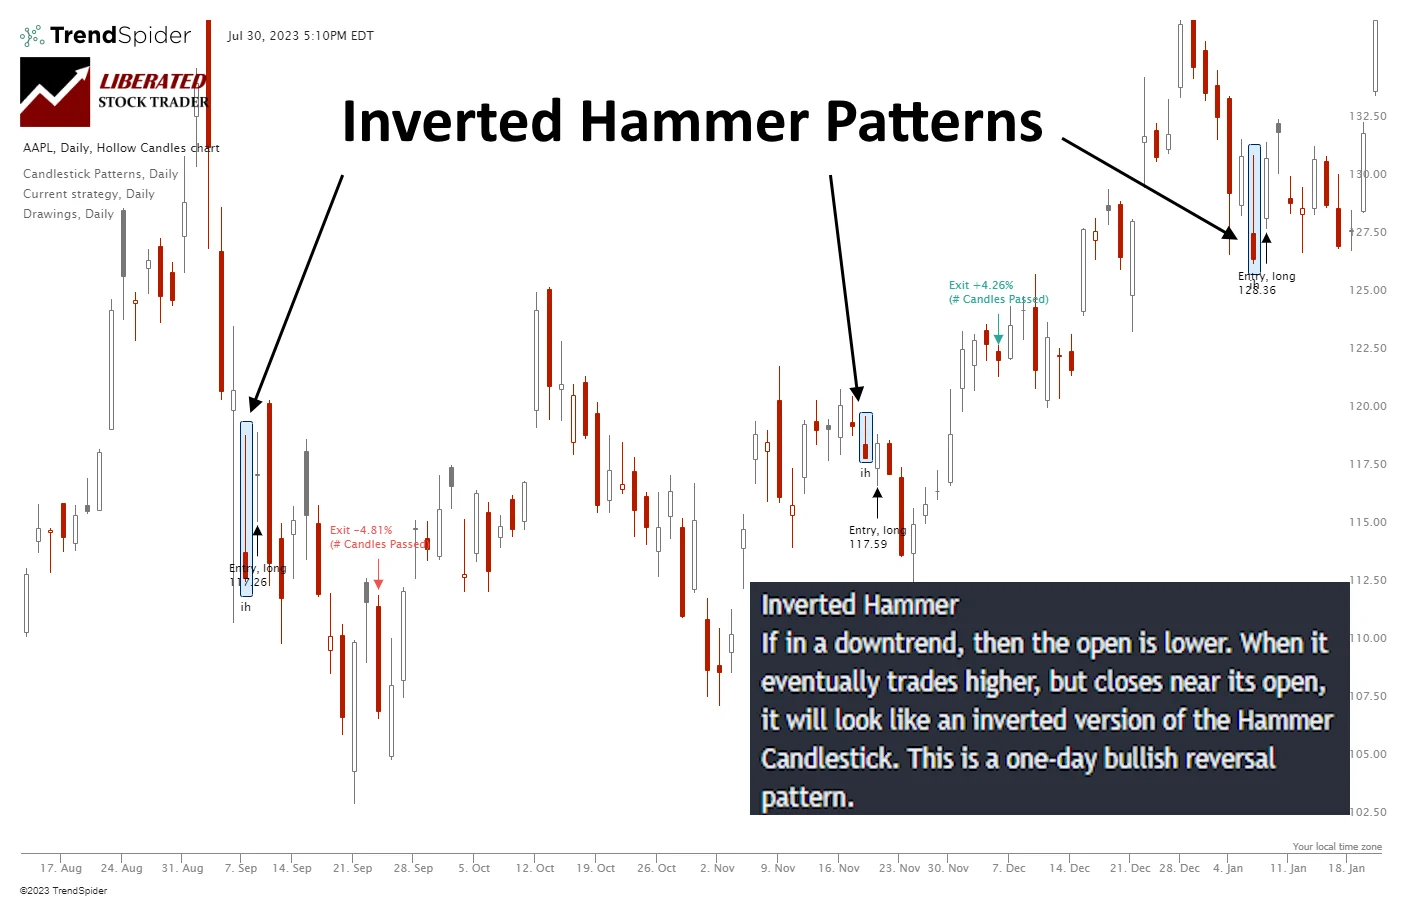
The Inverted Hammer typically manifests at the bottom of a downtrend, hinting at a potential shift in the price trajectory. It signals a bullish sentiment, denoting that the market is trying to push prices higher, as indicated by the extended upper wick. However, the sellers regain control by the close of the trading period, pushing the price down to close near the opening level, thus creating a small body at the bottom.
Candle Pattern Recognition with TrendSpider
In a downtrend, the market opens, and sellers push the prices down significantly, reflected by the long upper wick. However, buyers step in by the end of the trading period and push the price back off the low, creating a small body at the bottom of the candle.
The Inverted Hammer candle indicates bullish sentiment and a potential trend reversal, and our testing proves this theory correct.
The Psychology of the Inverted Hammer
The psychology behind the Inverted Hammer pattern is that sellers initially have a strong upper hand, driving prices significantly lower. However, the buyers eventually step in, and the price rallies, driving the price above the low. This shift in momentum indicates that the selling pressure has been exhausted, and a potential reversal might be coming. The Inverted Hammer Candle, therefore, represents a battle that leads to downside price exhaustion and a potential buy point, signaling the beginning of a bullish trend.
Is an Inverted Hammer Bullish or Bearish?
According to our testing, the Inverted Hammer is a strongly bullish pattern. The results from 1,702 tested trades show that the Inverted Hammer is bullish 60% of the time. The Inverted Hammer is 60% bullish and 40% bearish.
Is an Inverted Hammer a Reversal Pattern?
Our data shows that the Inverted Hammer is not a clear reversal or continuation pattern. As you can see in the charts above, Inverted Hammers occur during uptrends and downtrends, but they do not exclusively signal a price reversal; they can also be continuation patterns.
Trading an Inverted Hammer Based on Data
When trading Inverted Hammers, waiting for the next day’s open and observing a price increase before making a trade is important. Our tests show an Inverted Hammer has a 60% chance of a 4.2% profit over the next 10 days. If you improve your entry and wait for confirmation before trading, you can increase this profitability.
While the Inverted Hammer signifies a bullish end to the trading day, this does not guarantee the next day will be positive, but it suggests that 60% of the time, the next 10 days will be a bullish uptrend.
Auto-Trade Candles with TrendSpider
Trading the Inverted Hammer: Apple Inc. 20-Year Test
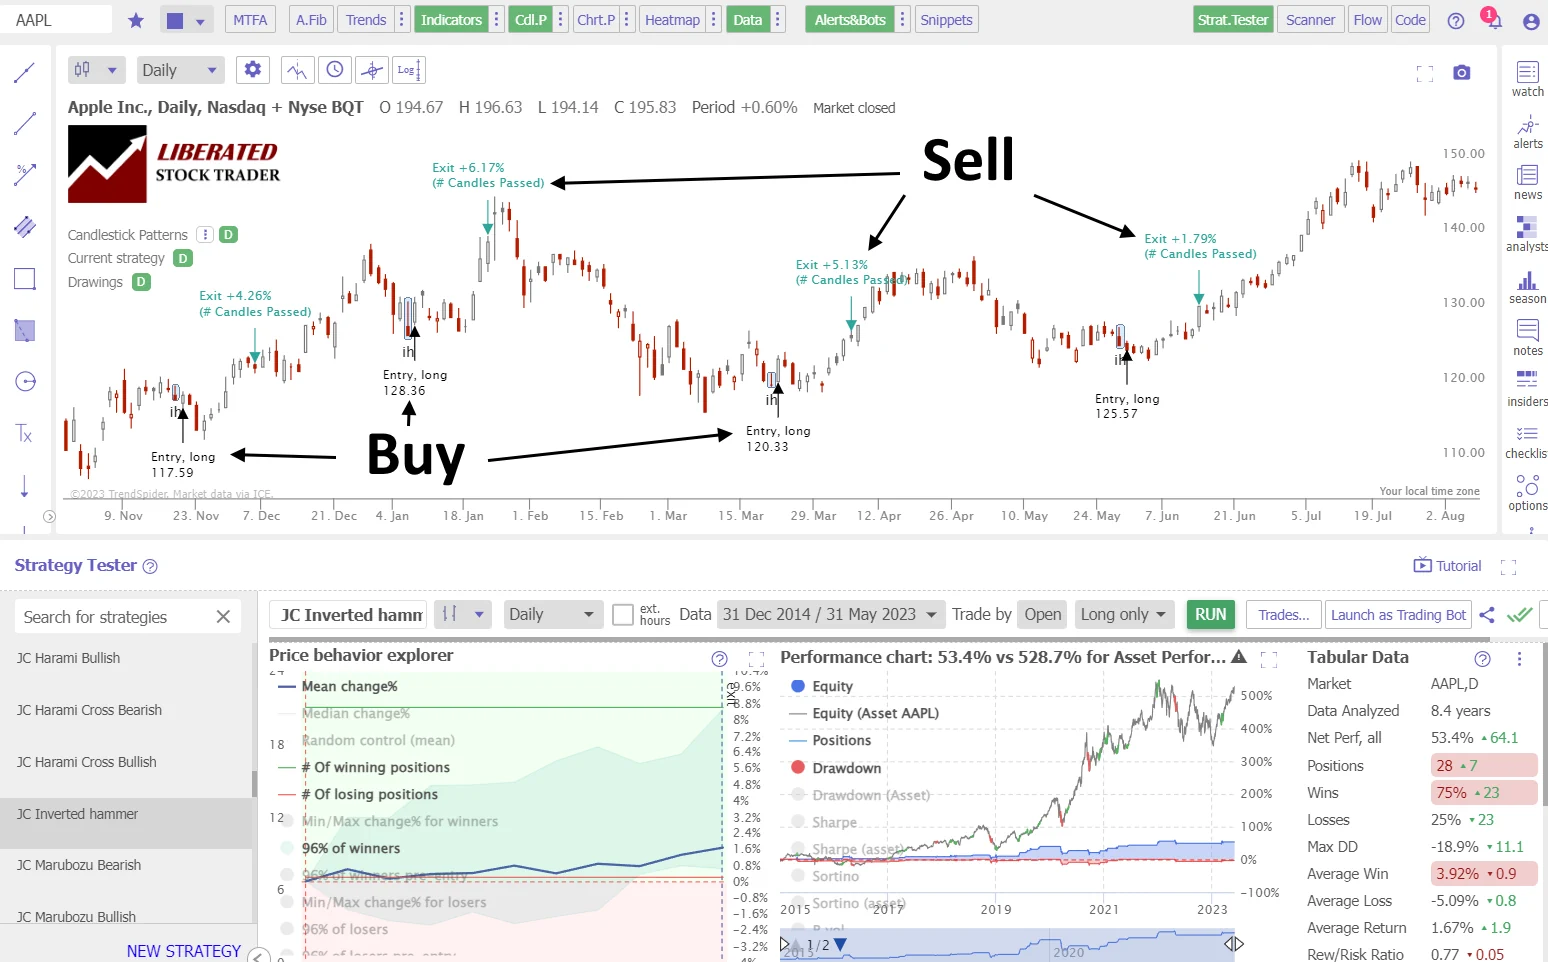
Our backtesting data on Apple Inc. (above) shows four winning trades in a row on Apple Inc. Each trade was 10 days long; the results were +4.2%, +6.1%, 5.1%, and 1.8%.
Thanks to TrendSpider’s strategy tester, we can see the Inverted Hammer’s high 75% win rate and profit of 3.92% per winning trade. The average gain across all winning and losing trades was 1.67%, which is very good.
Enhancing an Inverted Hammer Trading Strategy
When engaging in Inverted Hammer trading, combining this strategy with reliable indicators like the Relative Strength Index (RSI), Rate of Change (ROC), or Volume could be even more profitable. By optimizing your approach with these techniques, you can enhance both the quality and effectiveness of your trading strategy. Of course, you need to test this for yourself, preferably using TrendSpider.
My Inverted Hammer Testing
Using TrendSpider, I tested 30 Dow Jones Industrial stocks over 20 years. This amounted to 1,702 Inverted Hammer trades and 588 years of data. The Inverted Hammer must be fully formed to enter a trade, and the buy signal must be executed on the next trading day’s open price. Each trade was exited at the open exactly ten days later.
Candle Testing Methodology:
- Pattern: Inverted Hammer
- 30 DJIA Stocks
- Daily Chart
- Strategy: Buy Long
- Test Period: 2003 to 2023
- Buy at the next open
- Exit after 10 days
- Pattern Recognition performed by TrendSpider
Backtesting the Inverted Hammer
Using TrendSpider for trade identification and execution gives fast and precise results. To evaluate candlestick patterns and strategies independently, follow the instructions below and check out the screenshot for reference.
- Register for TrendSpider.
- Buy Signal: Select Strategy Tester > Entry Condition > Add Parameter > Condition > Candlestick pattern > Inverted Hammer > Evolved.
- Sell Signal: Add # Candles Passed = 10.
- Click “RUN” to execute the backtest.
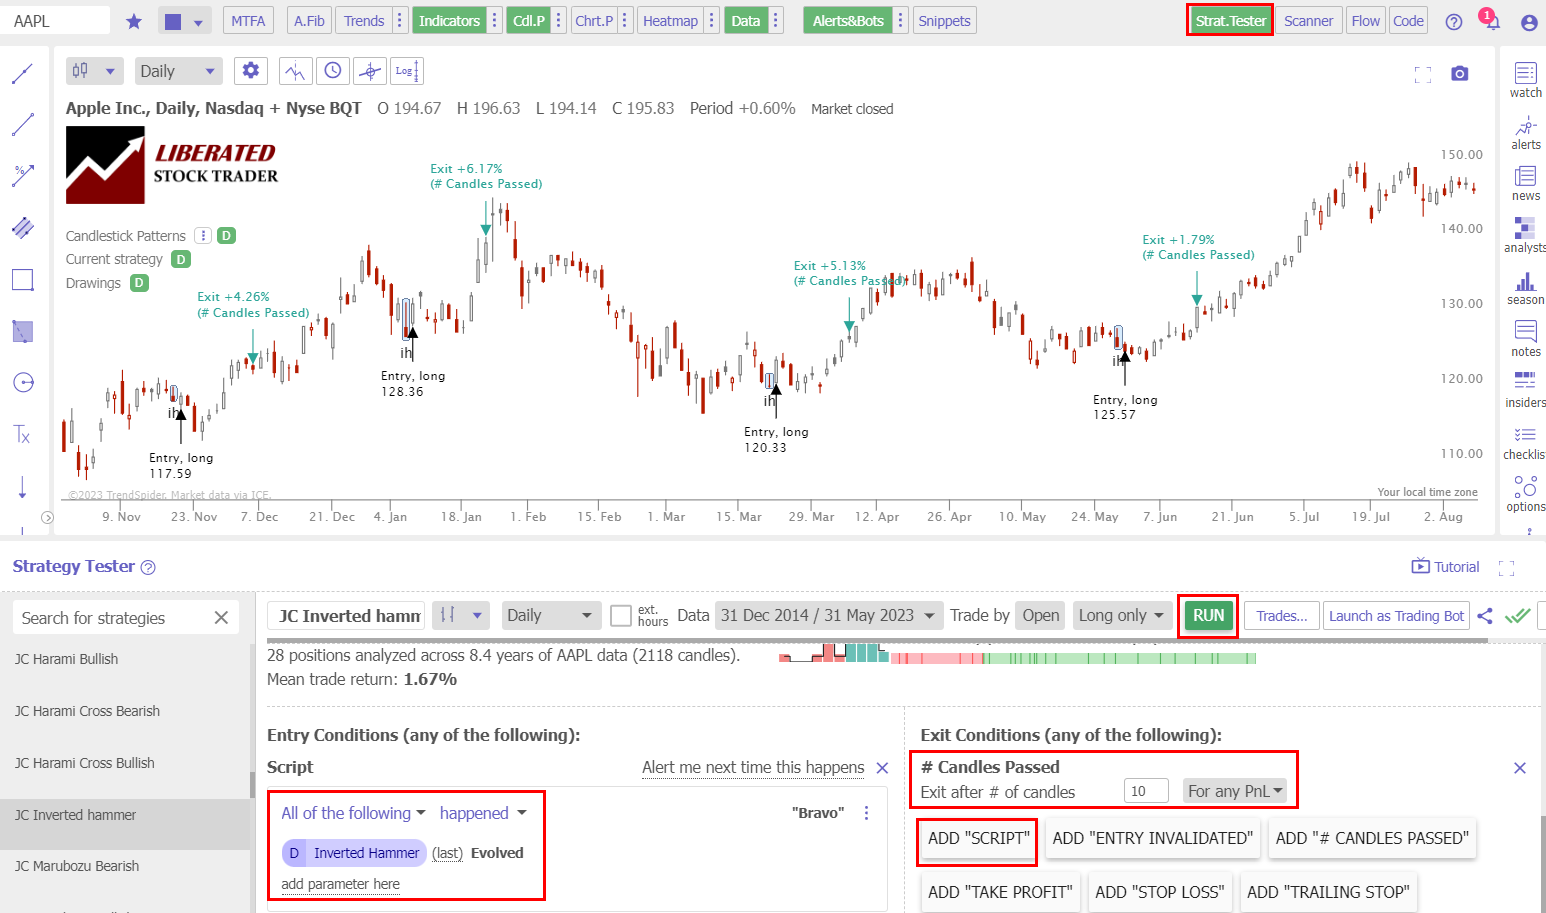
Backtesting Done with TrendSpider
Test Results
After conducting 1,702 trades on 588 years of data, we confirm the Inverted Hammer profit per trade to be 1.12%. A 1.12% win rate means that trading an Inverted Hammer long will net you an average of 1.12% profit per trade if you sell after ten days. Conversely, short-selling an Inverted Hammer, you should expect to lose 1.12% per trade. This proves this pattern is strongly bullish.
The percentage of Inverted Hammer winning trades was 60% versus 40% losing trades, significantly higher than the 55.8% average performance across all candlestick types. The Max Drawdown was -29.6%, versus the stock’s drawdown of -59.4%, which shows less volatility than a buy-and-hold strategy.
The average winning trade was 4.2% over ten days, and the average losing trade was -3.5%; this represents a reasonable profit margin, especially when combined with the 60% successful trades.
The reward-to-risk ratio is 1.12, the highest of the 25 candles we tested. We have only seen better Reward/Risk ratios in our testing of “The most successful chart patterns.”
Test Results Summary
Ultimately, for every long trade you make after an Inverted Hammer appears on a daily stock chart, on average, you should make 1.12% after holding for ten days. This solid result makes the Inverted Hammer the best candlestick pattern to trade.
Conversely, the worst candlestick for trading is the Hammer, with a profit per trade of 0.18%. We compare both the Hammer and the Inverted Hammer in the table below.
Performance Data Table: Inverted Hammer vs. Hammer
Our combined testing of 1,137 years of data shows the Inverted Hammer vastly outperforms the Hammer by a factor of 5 to 1.
| Test Results | Inverted Hammer | Hammer |
|---|---|---|
| Data Analyzed (Years) | 588 | 549 |
| # Trades | 1702 | 2219 |
| Wins | 60% | 52.1% |
| Losses | 40% | 47.9% |
| Max Drawdown | -29.6% | -36.2% |
| Max Drawdown (Asset) | -59.4% | -58.2% |
| Average Win | 4.2% | 3.6% |
| Average Loss | -3.5% | -3.6% |
| Average Return Per Trade | 1.12% | 0.18% |
| Reward/Risk Ratio | 1.28 | 1.01 |
| Sharpe Ratio | 0.15 | -0.05 |
| Sortino Ratio | 0.52 | 0.25 |
My groundbreaking research into the profitability and success rates of chart patterns and technical indicators is built on the most powerful backtesting platforms available. If you want to design original, profitable trading strategies, our exclusive review of the best backtesting software will help you find the perfect solution to give you a real edge in the markets.

Does the Inverted Hammer Work?
Yes, the Inverted Hammer works well in trading, producing a 60% success rate. The average profit per trade is the highest of all candles, with 1.12% after 10 days. If you sell it short, it will average a 1.12% loss.
Is an Inverted Hammer Accurate?
Yes, an Inverted Hammer is one of the most accurate candle patterns to trade; it results in 60% of trades winning and 40% losing. The average winning trade is 4.2%, and the losing trade is -3.5%. Using an Inverted Hammer is a distinct advantage in candle trading.
Can the Inverted Hammer Candle be used for Buy and Sell Signals?
Yes, our data shows the Inverted Hammer can be used for buy and sell signals. It’s 60% accuracy across 1,702 trades shows the Inverted Hammer provides a solid bullish signal.
Inverted Hammer Reliability
Yes, the Inverted Hammer is reliable. According to 1,702 tested trades, an Inverted Hammer is 60% reliable for bullish trades. It has a good 1.12% average profit, and the average winning trade was 4.2% over 10 days.
Summary
In conclusion, the Inverted Hammer is the most reliable and profitable pattern in Japanese candlestick analysis. It has a good accuracy of 60%, resulting in a profit per trade of 1.12%. Our data proves it has bullish predictive qualities.
All traders would benefit from investing in a comprehensive trading training course to help them make more informed decisions while managing their risks properly. So why not check out Liberated Stock Trader’s advanced investing course today?
You want to be a successful stock investor but don't know where to start.
Learning stock market investing on your own can be overwhelming. There's so much information out there, and it's hard to know what's true and what's not.

Liberated Stock Trader Pro Investing Course
Our pro investing classes are the perfect way to learn stock investing. You will learn everything you need to know about financial analysis, charts, stock screening, and portfolio building so you can start building wealth today.
★ 16 Hours of Video Lessons + eBook ★
★ Complete Financial Analysis Lessons ★
★ 6 Proven Investing Strategies ★
★ Professional Grade Stock Chart Analysis Classes ★
FAQ
What is the best software for trading Inverted Hammer candles?
TrendSpider is the best software for trading candlestick patterns due to its integrated candle backtesting and pattern recognition. If you value a large global community of traders sharing ideas and strategies, then TradingView is a great alternative.
Is the Inverted Hammer Profitable?
Yes, the Inverted Hammer is the most profitable of all candles. Our testing shows it has an average return of 1.12% across 1,702 trades spanning 588 years of test data. So, for every 10-day trade, you should average a 1.12% profit.
What is an Inverted Hammer Candle?
The Inverted Hammer is a Japanese candlestick pattern representing a potential bullish market turning point. Traders believe the market could soon reverse from a downtrend to an uptrend. Our data-based research confirms these popular beliefs.
How can I recognize an Inverted Hammer Candle?
To identify a Hammer, look for a small square body at the bottom of the candle, which can be either red or green. Next, observe the presence of a long upper wick, at least twice the size of the body, resembling an upside-down hammer.
What software automatically detects Inverted Hammers?
TrendSpider, TradingView, and Finviz are pioneering candlestick pattern recognition software. See how they compare in our best pattern recognition software comparison review.
Is the Inverted Hammer candle popular?
According to Google search data, the Inverted Hammer candle is less popular than Dojis or Harami patterns. Traders should know that the inverted Hammer is more reliable and profitable than Doji or Harami patterns.
Is the Inverted Hammer candle important in trading?
Yes, the Inverted Hammer, according to our research, is the most important of all candlestick patterns due to its 60% success rate and average winning trade of 4.2%.
Is the Inverted Hammer Candle reliable?
Yes, the Inverted Hammer's reliability for predicting market direction is 60%, making it good for consistent profits. Conversely, according to our data, the Hammer pattern is the most unreliable candle pattern, with a 52% win rate and 0.18% profit per trade.
What indicators should I use with Inverted Hammer Candles?
In conjunction with Inverted Hammer patterns, it is advisable to use indicators such as relative strength index (RSI), moving averages, and rate of change (ROC). Our research and analysis have proven these indicators successful.