I analyzed 4,994 Marubozu trades, spanning over 1,136 years of historical data encompassing both boom and bust markets. Get ready to master trading the Marubozu pattern, backed by reliable and time-tested data!
My research shows Bearish Marubozu candles are among the most profitable patterns. Based on 568 years of data, it has a 56.1% success rate and an average win of 4.1%. Conversely, the Bullish Marubozu is one of the worst.
RESEARCH SUMMARY
- The Bearish Marubozu is a reliable candle pattern with a win rate of 56.1%.
- The Bearish Marubozu average winning trade is 4.1%.
- The Bullish Marubozu has a low Reward/Risk Ratio of 0.97, making it a poor pattern to trade.
- Across 5,000 trades, a Bullish Marubozu averages a 0.28% profit, but a Bearish Marubozu makes 0.8%.
- The Bearish Marubozu is the only one worth trading and is the second-best-performing candle overall.
What is a Marubozu Candle?
A Marubozu is a candlestick analysis chart pattern that indicates strong and decisive sentiment in the market, either bullish or bearish. The pattern is formed when a candle’s open and close prices are at or near the extreme ends of the price range. A Marubozu candle usually signals a long white body (for an uptrend) or a long black body (for a downtrend).
TrendSpider 4.8/5⭐: My Pick for AI-Power & Auto-Trading
I’ve used TrendSpider for 7 years for my research and testing. It auto-detects trendlines, patterns, and candlesticks, backtests ideas, and lets you use AI to create unique strategies and launch trading bots—with no code.

Save 38% on TrendSpider
Our Top Rated 4.72 ⭐ Trading Tool
✅ Leader in AI Trading & Chart Pattern Recognition
✅ Scanning & Auto-Trading
Deal Ends In:
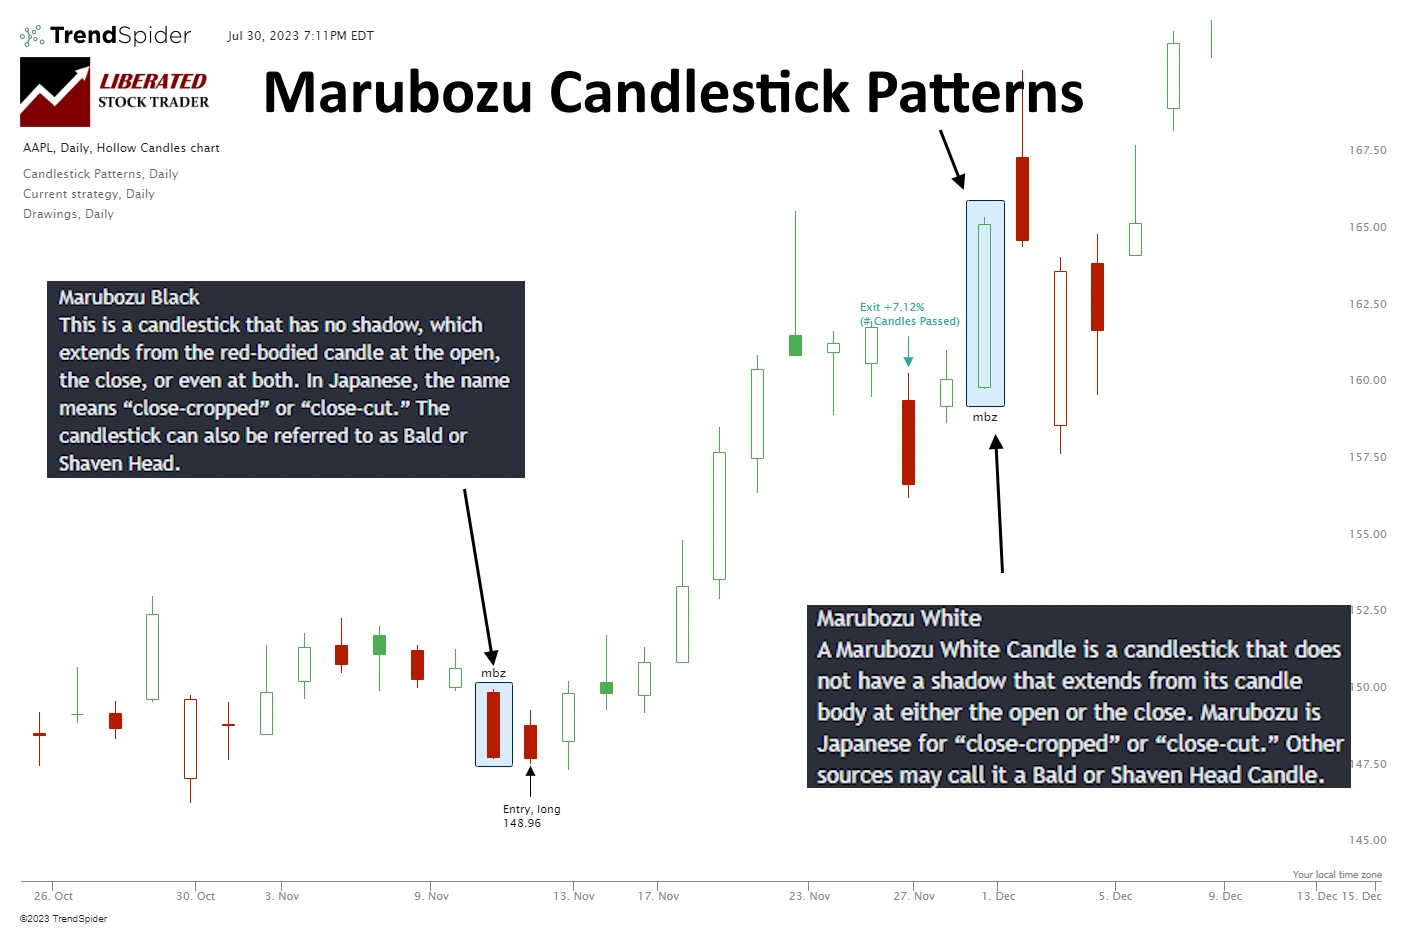
Marubozu candles have been used in Japanese candlestick charting for centuries. The term Marubozu translates from Japanese as “bald head,” which is a fitting description of the candle since it has no wicks or shadows to its form. This type of candle offers traders clear signals about price activity in the market, making it an invaluable tool for technical analysis.
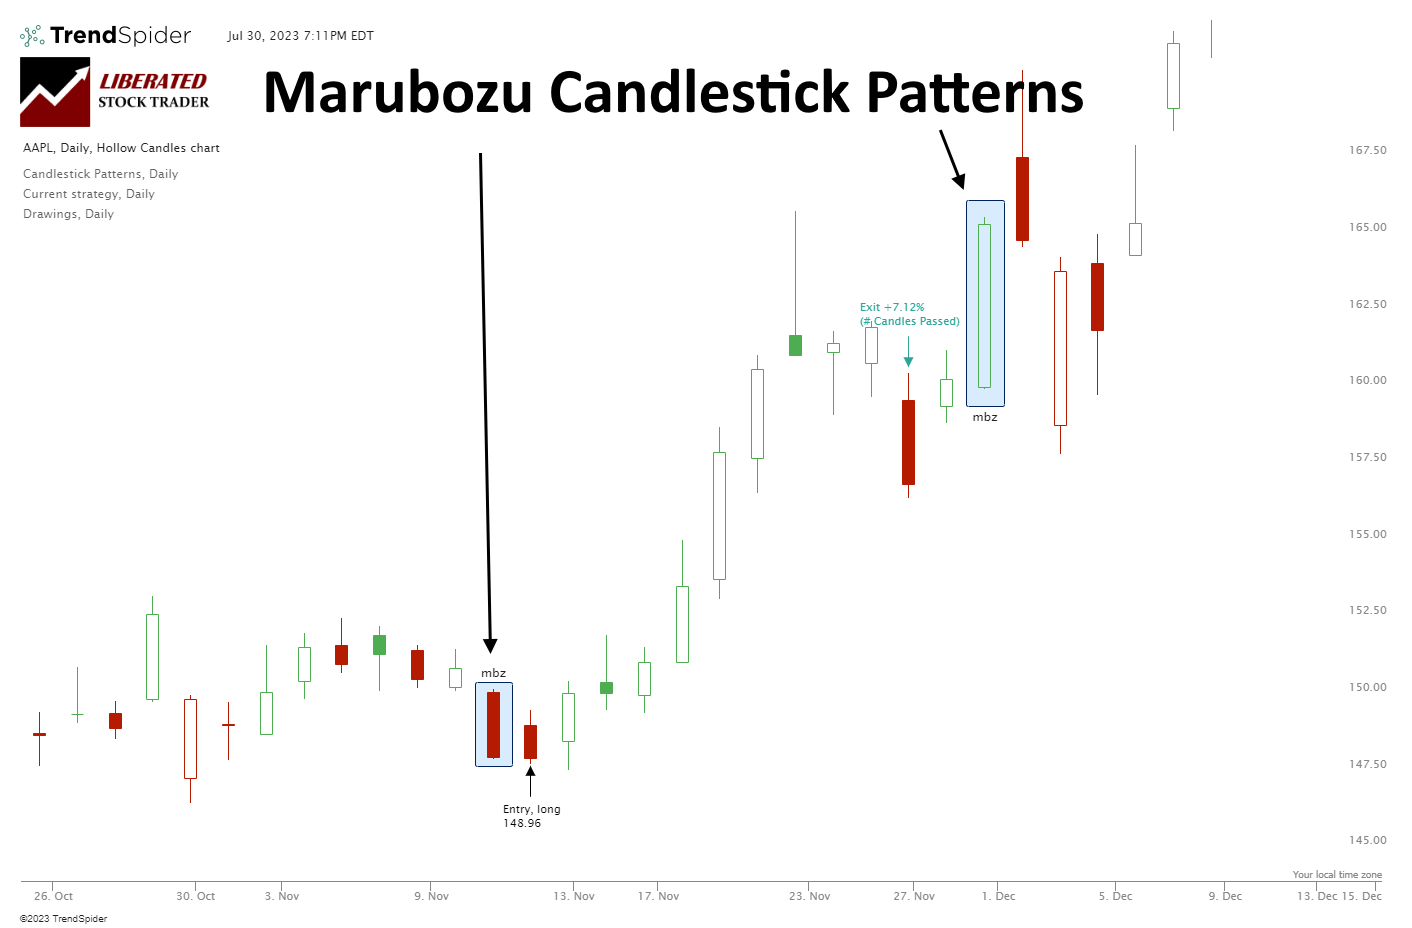
Two Marubozu Candles: Bullish & Bearish
There are two Marubozu candles, bullish (white) or bearish (black). If prices open at the high and close at the low, this is a bearish (black) Marubozu. An open at the low and close at the high indicates a bullish (white) Marubozu.
The Bullish Marubozu’s name suggests that if you observe this pattern, the trend will be bullish, and the stock price will increase. Our testing shows this not to be the case. The Bearish Marubozu is the strongest performing of the two patterns.
The Bearish Marubozu
A Bearish (Black) Marubozu signals a strong downward price movement. It forms when the open price is the highest for the period (day, hour, etc.) and the close price is the lowest. In other words, bears controlled the price from the start to the end of the timeframe, reflecting the dominance of selling pressure throughout the entire period. (See image below – left).
The trading psychology behind a Bearish Marubozu is quite informative. The appearance of this pattern indicates that sellers have not only taken control but maintained it throughout the entire trading period. Their sustained dominance manifests as a lack of an upper shadow or wick, as prices never rebounded above the opening level.
This can be interpreted as a strong bearish sentiment among traders, which may lead to continued selling pressure in the subsequent trading periods.
Our test data show this theory as false; the bearish Marubozu is paradoxically an extremely bullish signal for the following trading days.
Get Candle Pattern Recognition with TrendSpider
The Bullish Marubozu
The Bullish Marubozu suggests strong buying pressure has been present for the entire trading period. When this pattern appears on a chart, buyers have taken control and never relinquished it throughout the entire time frame. As such, prices open and drive higher until they close. (See image above – right).
The trading psychology behind a Bullish Marubozu points to buyers taking control and maintaining this dominance throughout the entire trading period.
The theory suggests that the sustained bullish momentum suggests strong buyer sentiment and the potential for continued buying pressure in the subsequent trading periods. But again, our research shows that the Bullish Marubozu is not a signal for a positive market move; it does not provide any clear signals.
All will be revealed in our test data.
What Does a Marubozu Candle Mean?
When a Marubozu candle occurs, it means either buyers or sellers have had complete control of the trading session. The Marubozu is a powerful pattern that indicates extreme fear or greed during the period. Greed drives prices up, and fear pushes them down.
But does the sentiment continue through the next trading days?
Our research suggests it does not. An extremely Bullish Marubozu leads to no clear trend over the next 10 trading days, whereas a Bearish Marubozu leads to a distinct rally, according to the data.
Only one of these patterns is worth trading; the Bearish Marubozu.
Marubozu Candle Testing
Using TrendSpider, I tested 30 Dow Jones Industrial stocks over 20 years. This amounted to 1,702 Marubozu trades and 588 years of data. The Marubozu must be fully formed to enter a trade, and the buy signal must be executed on the next trading day’s open price. Each trade was exited at the open exactly ten days later.
Candle Testing Methodology:
- Pattern: Marubozu (Bearish & Bullish)
- 30 DJIA Stocks
- Daily Chart
- Strategy: Buy Long
- Test Period: 2003 to 2023
- Buy at the next open
- Exit after 10 days
- Pattern Recognition performed by TrendSpider
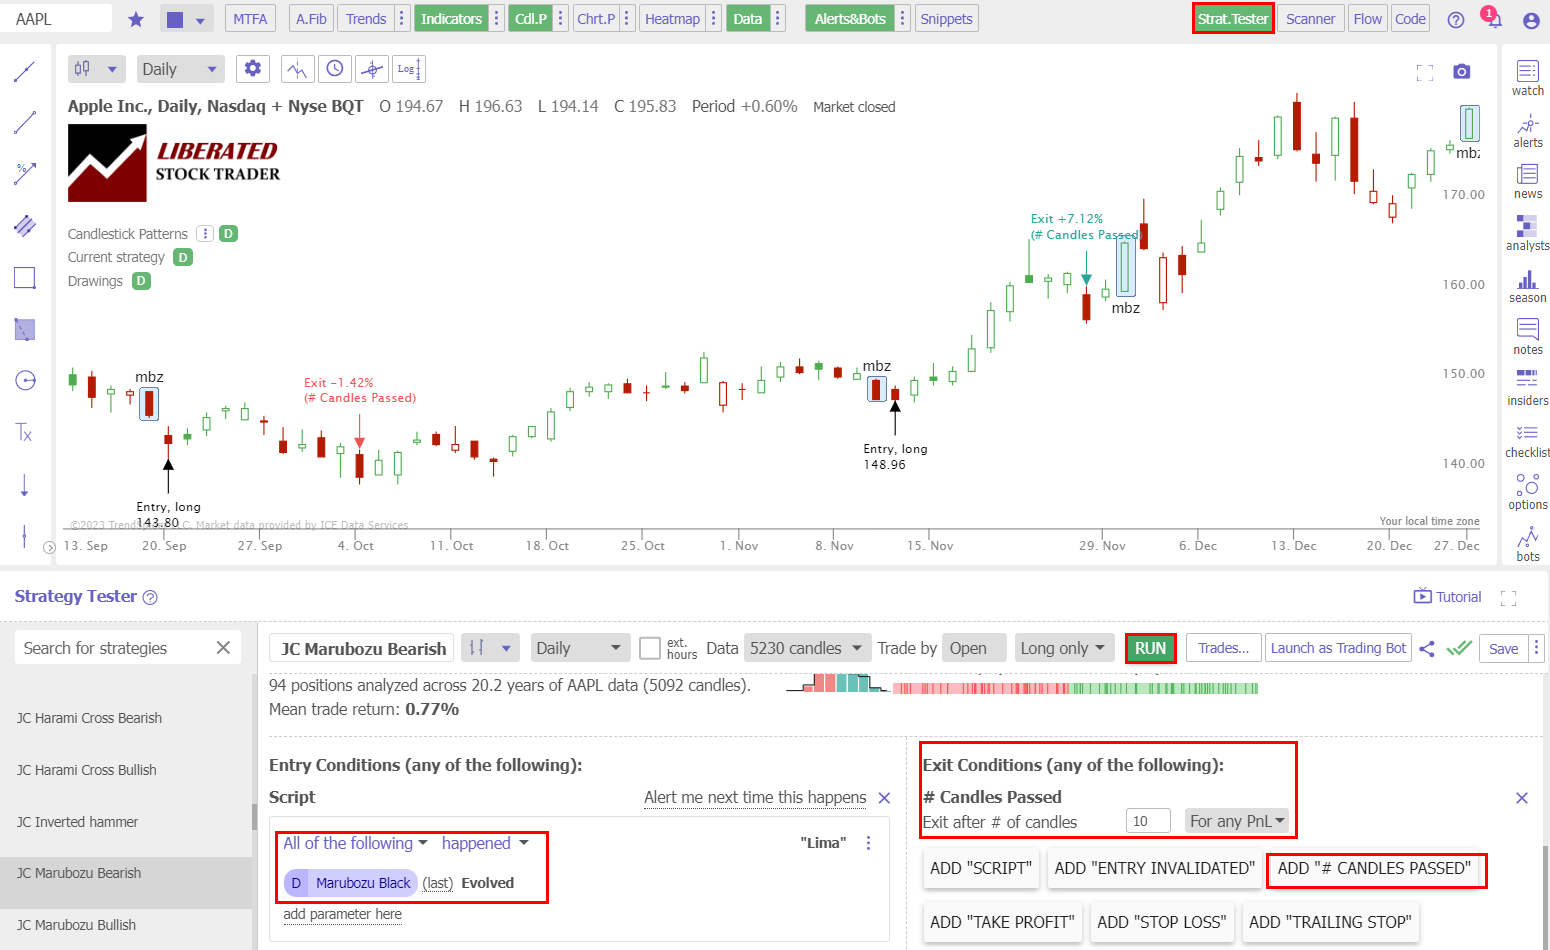
How I Backtest the Marubozu Candle
Utilizing TrendSpider for trade identification and execution can achieve swift and accurate results. To independently evaluate candlestick patterns and strategies, please follow the instructions below and refer to the accompanying screenshot.
- Register for TrendSpider.
- Buy Signal: Select Strategy Tester > Entry Condition > Add Parameter > Condition > Candlestick pattern > Marubozu (Black or White) > Evolved.
- Sell Signal: Add # Candles Passed = 10.
- Click “RUN” to execute the backtest.
Backtesting Done with TrendSpider
Test Results
After conducting 4,994 trades on 1136 years of data, we confirm the superior Bearish Marubozu profit per trade to be 0.8%. A 56.1% win rate means that trading a Bearish Marubozu long will net you an average of 0.8% profit per trade if you sell after ten days. Conversely, short-selling a Bearish Marubozu, you should expect to lose 0.8% per trade. This proves this bearish pattern is paradoxically bullish.
Bearish Marubozu – Good
The percentage of Bearish Marubozu winning trades was 56.1%, with an average winning trade equalling 4.1%, significantly higher than the average performance across all candlestick types. The Max Drawdown was -31%, versus the stock’s drawdown of -59.7%, which shows less volatility than a buy-and-hold strategy.
The average winning trade was 4.1% over ten days, and the average losing trade was -3.5%; this represents a reasonable profit margin, especially when combined with the 56.1% successful trades. The average win for all trades was 0.8% per trade.
The Bearish Marubozu’s reward-to-risk ratio is 1.21, the highest of the 25 candles we tested. We have only seen better Reward/Risk ratios in our testing of “The most successful chart patterns.”
Bullish Marubozu – Bad
The percentage of Bullish Marubozu winning trades was 55% versus 45% losing trades, lower than the 55.8% average performance across all candlestick types. The Max Drawdown was -37%, versus the stock’s drawdown of -59.3%, which shows less volatility than a buy-and-hold strategy.
The average winning trade was 3.6% over ten days, and the average losing trade was -3.8%, suggesting a negative average return, especially when combined with the 55% successful trades. The average win for all trades was 0.28% per trade, which is extremely bad, making this one of the worst-performing candle patterns.
Test Results Summary
Ultimately, for every long trade you make after a Bearish Marubozu appears on a daily stock chart, on average, you should make 0.8% after holding for ten days. The same trade on a Bullish Marubozu is 0.28%, which will be unprofitable after slippage and fees.
Performance Data Table: Bullish vs. Bearish Marubozu
Our combined testing of 1,137 years of data shows the Bearish Marubozu vastly outperforms the Bullish Marubozu by profit per trade factor of 3 to 1. (See table below)
| Marubozu Results | Bullish Marubozu | Bearish Marubozu |
| Data Analyzed (Years) | 568.3 | 568.3 |
| # Trades | 2634 | 2360 |
| Wins | 55.0% | 56.1% |
| Losses | 45.0% | 43.9% |
| Max Drawdown | -37.1% | -31.8% |
| Max Drawdown (Asset) | -59.3% | -59.7% |
| Average Win | 3.6% | 4.1% |
| Average Loss | -3.8% | -3.5% |
| Average Return Per Trade | 0.28% | 0.80% |
| Reward/Risk Ratio | 0.97 | 1.21 |
| Sharpe Ratio | -0.01 | 0.14 |
| Sortino Ratio | 0.32 | 0.53 |
My groundbreaking research into the profitability and success rates of chart patterns and technical indicators is built on the most powerful backtesting platforms available. If you want to design original, profitable trading strategies, our exclusive review of the best backtesting software will help you find the perfect solution to give you a real edge in the markets.

How to Trade a Marubozu Based on Data
Our research confirms that you should trade only the Bearish Marubozu candle, which returns an average of 0.8% per trade, making it one of the best-performing candle patterns. Avoid the Bullish Marubozu as it only returns an average of 0.28% per trade, which is unprofitable and one of the worst candles to trade.
When trading a Bearish Marubozu, you can expect a 56.1% chance that the price will rise by 4.1% over the next 10 days. Across all winning and losing trades, this pattern will average a 0.8% profit.
How to Trade the Marubozu Candle Based on Researched Data.
Get TrendSpider – The King of Backtesting
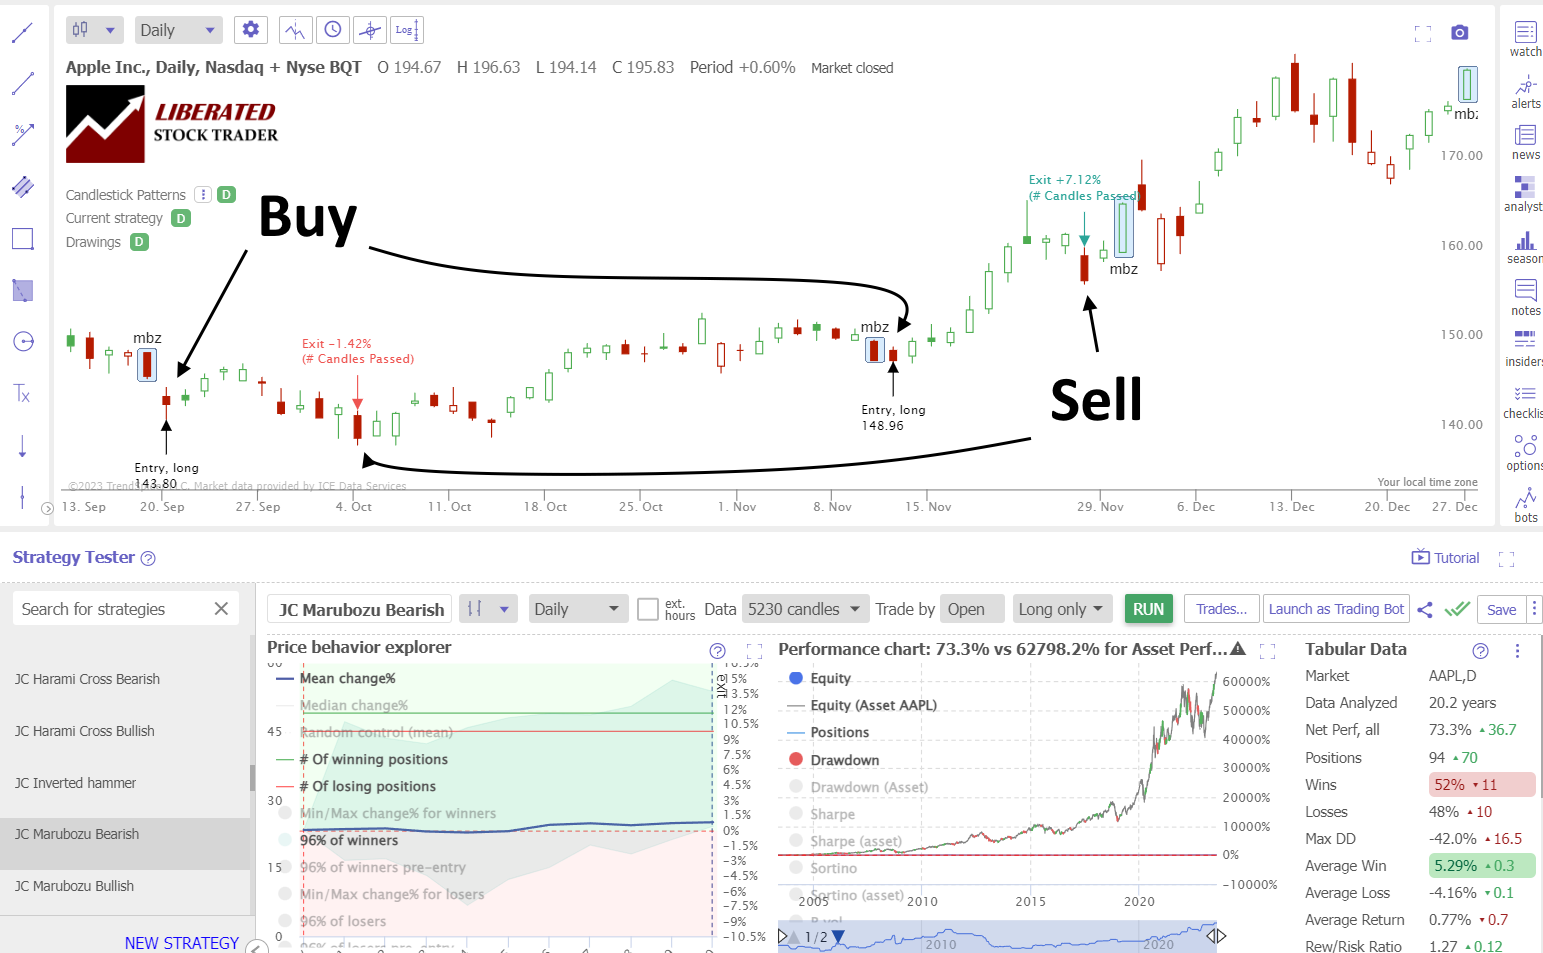
Trading the Bearish Marubozu: Apple Inc. 20-Year Test
Thanks to TrendSpider’s strategy tester, we can see the Bearish Marubozu’s high 5.29% average winning trade on Apple Inc. The average gain across all winning and losing trades was 0.77%, which is very good. Over 20 years, there were 94 trades, 52% profitable, with a healthy 1.27% reward/risk ratio.
Enhancing a Marubozu Trading Strategy
When engaging in Marubozu trading, combining this strategy with indicators our testing has proven successful could be even more profitable, like the Relative Strength Index (RSI), Rate of Change (ROC), or Volume. Additionally, we have extensively tested traditional chart patterns and found they can be highly profitable.
By optimizing your approach with these techniques, you can enhance both the quality and effectiveness of your trading strategy. Of course, you need to test this for yourself using TrendSpider.
Is a Marubozu Bullish or Bearish?
According to our testing, the Bearish Marubozu is a strongly bullish pattern in the following trading days. The results from 2,360 tested trades are 56% bullish and 44% bearish. Conversely, the Bullish Marubozu is also bullish but much less profitable.
Is a Marubozu a Reversal Pattern?
Our data shows that Marubozu is a reversal and a continuation pattern. The charts above show Marubozus occur during uptrends and downtrends, but they do not exclusively signal a price reversal; they can also be continuation patterns.
Does the Marubozu Candle Work?
Yes, the Bearish Marubozu works well in trading, yielding a 0.8% profit across all trades. But traders must avoid the Bullish Marubozu, which has a low 0.28% win and is unprofitable. Both Marubozu patterns are predominantly bullish and work if you buy long.
Is a Marubozu Candle Accurate?
The Bearish Marubozu is one of the most accurate candle patterns to trade; it results in 56.1% of trades winning and averaging +4.1% per trade. However, take care to avoid the unprofitable Bullish Marubozu.
Can the Marubozu Candle be used for Buy and Sell Signals?
Yes, our data shows the Bearish Marubozu can be used for buy and sell signals. Its 56.1% win rate and average win per trade of 4.1% across 2,360 trades show it provides a solid bullish buy signal.
Is a Marubozu Candle Reliable?
The Bearish Marubozu proves to be a trustworthy pattern. Extensive analysis of 2,360 trades conducted on the 30 Dow Jones stocks over a 20-year period demonstrates an average profit of 0.8% per trade, including both winning and losing trades, solidifying its reliability as a trading tool.
Summary
In conclusion, the Bearish Marubozu is one of the most reliable and profitable Japanese candlestick patterns. It has a good accuracy of 56.1%, resulting in a profit per trade of 0.8% and an average winning trade of 4.1% over 10 days. Our data proves the Bearish Marubozu has bullish predictive qualities. Finally, traders should avoid the Bullish Marubozu, which has proven unreliable and unprofitable.
Enhancing trading skills through a comprehensive training course is crucial for all traders. It enables them to make well-informed decisions while effectively managing risks. Discover the comprehensive trading training Liberated Stock Trader offers to elevate your trading journey. Start today and unlock new opportunities!
You want to be a successful stock investor but don't know where to start.
Learning stock market investing on your own can be overwhelming. There's so much information out there, and it's hard to know what's true and what's not.

Liberated Stock Trader Pro Investing Course
Our pro investing classes are the perfect way to learn stock investing. You will learn everything you need to know about financial analysis, charts, stock screening, and portfolio building so you can start building wealth today.
★ 16 Hours of Video Lessons + eBook ★
★ Complete Financial Analysis Lessons ★
★ 6 Proven Investing Strategies ★
★ Professional Grade Stock Chart Analysis Classes ★
FAQ
What is the best software for Marubozu candles?
TrendSpider is the best software for trading all candlestick patterns due to its integrated backtesting and pattern recognition. If you value a large global community of traders sharing ideas and strategies, then TradingView is a great alternative.
Is the Marubozu profitable?
Yes, the Bearish Marubozu is among the most profitable candle patterns. Our testing shows it has an average return of 0.8% across 2,390 trades spanning 568 years of test data. So, for every 10-day trade, you should average a 0.8% profit.
What is a Marubozu candle?
A Marubozu candle is a candlestick pattern signifying dominant buying or selling activity on a trading day. A Bullish Marubozu candle indicates significant buying pressure, whereas a Bearish Marubozu suggests strong selling pressure.
How can I recognize Marubozu candles?
The Marubozu candle has a long body with a flat top and bottom. It resembles a long rectangle, either hollow (white) or filled (black). The candle is bullish if the open price is at the low of the day and bearish if the close price is at the high.
What software automatically detects Marubozu candles?
TrendSpider, TradingView, and Finviz are our recommended candlestick pattern recognition software. They can recognize and backtest the majority of popular candlestick trading patterns.
Is the Marubozu candle popular?
According to Google search data, the Marubozu candle is much less popular than Dojis or Harami patterns. Traders should know that the Bearish Marubozu is significantly more reliable and profitable than Doji or Harami patterns.
Is the Marubozu candle important in trading?
Yes, the Bearish Marubozu, according to our research, is an important candlestick pattern due to its 0.8% average trade profit and average winning trade of 4.1%.
Is the Marubozu Candle reliable?
Yes, the Bearish Marubozu reliably predicts market direction 56% of the time, making it good for a consistent 0.8% per trade profit. Conversely, our data shows the Bullish Marubozu pattern is an unreliable candle pattern, with an average return per trade of 0.28% per trade.
What indicators should I use with Marubozu Candles?
In conjunction with Marubozu patterns, it is advisable to use indicators such as relative strength index (RSI), moving averages, and rate of change (ROC). Our research and analysis have proven these indicators successful.