Knowing when to exit a trade matters just as much as timing your entry, so understanding sell signals is a must for anyone dabbling in stock trading.
A sell signal gives traders a heads-up on when to consider closing positions, helping them lock in gains or cut losses using actual triggers, not just hunches.
You’ll spot these signals through technical indicators like the Relative Strength Index (RSI), moving averages, or by keeping an eye on shifts in a company’s fundamentals.
If you can read and evaluate sell signals with some consistency, you’ll probably navigate choppy markets better and sharpen your overall approach. Picking the right tools and learning the context around these signals lets you act more decisively—and manage risk with a bit more confidence.
Key Takeaways
- Sell signals tell you when it might be time to exit a stock.
- Both technical and fundamental tools can help spot solid signals.
- It’s important to judge the quality of signals for steady trading decisions.

What Is a Sell Signal?
A sell signal in stock trading is basically an alert or clue that it might be a good moment to get out of a position. If you can spot these, you can avoid bigger losses or secure profits by sticking to specific criteria instead of just guessing.
Types of Sell Signals
Sell signals usually fall into two main buckets: technical and fundamental.
Technical sell signals come from chart patterns, trend indicators, and oscillators. For instance, if a stock dips below its moving average or the RSI shows it’s overbought, that’s often a cue to start thinking about selling. These kinds of signals are popular because they’re clear and rule-based.
Fundamental sell signals focus on what’s happening with the company or the broader market. Signs like declining earnings, negative news, or insider sales can all be red flags. These point to underlying problems that might drag prices down further.
Some traders also rely on risk management triggers—think stop-loss orders or preset price targets. Those help you stick to an exit plan, no matter what’s going on in the news or your emotions.
Key Indicators And Tools For Identifying Sell Signals
Traders figure out sell signals by reading technical patterns, watching sentiment, and paying attention to economic triggers. Mixing different indicators and data points helps you decide when it’s time to bail, based on what’s actually happening, not just a feeling.
Technical Indicators Used For Sell Signals
Technical indicators are the bread and butter for spotting possible sell moments. Moving averages—especially when a short-term average crosses below a longer-term one—can warn you about a trend reversal. For example, the so-called death cross (50-day moving average dropping below the 200-day) is a classic bearish signal.

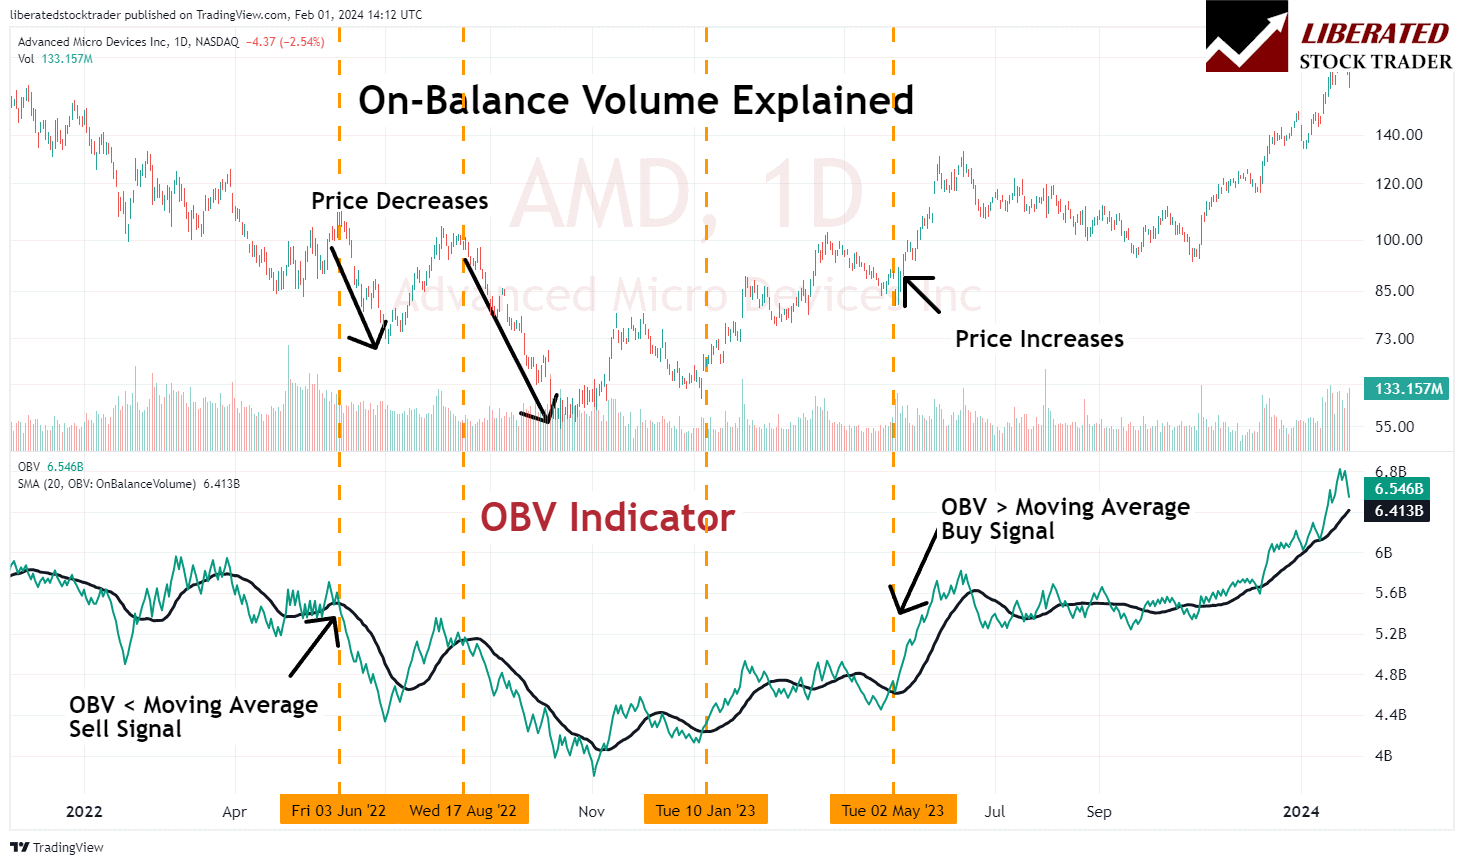
The Moving Average Convergence Divergence (MACD) helps spot momentum shifts. When the MACD line falls below the signal line, that’s often a prompt to consider selling. Other go-tos: the Relative Strength Index (RSI) and Stochastic Oscillator. If either flashes “overbought,” it might be time to get out. Volume indicators like On-Balance Volume (OBV) can back up your decision if dropping prices are matched by strong selling volume.
Market Sentiment and Volatility Measures
Gauging market sentiment gives you a sense of how the crowd’s positioned. When everyone’s super bullish—shown by sentiment surveys or put/call ratios—it can actually be a warning sign. If enthusiasm gets out of hand, corrections often follow, and that’s when sell signals can pop up.
Volatility indices like the VIX flag periods of high uncertainty. Spiking volatility usually means more risk of prices tumbling. Looking back at what happened during past volatility spikes can help you plan exits. Short interest and options data also come into play. If put options are surging or short interest is climbing, that might signal growing negativity and a reason to think about selling.
Fundamental and Economic Factors
Sometimes, sell signals show up because of fundamental or big-picture shifts. Weakening earnings, poor guidance, or ugly surprises in the news can hit a stock or sector hard. Economic indicators—like a slowdown in GDP, rising jobless numbers, or falling consumer confidence—often hint at trouble ahead for the broader market.
Political stuff—elections, global tensions, you name it—can make traders defensive, especially in sensitive areas like currencies or commodities. By tracking company updates, sector health, and economic releases, you get a clearer sense of when risk is rising and selling might make sense.
Evaluating And Acting On Sell Signals
You can’t just spot a sell signal and hope for the best. Getting good results means checking how reliable a signal really is, and then actually following through with a plan.
Assessing Accuracy and Reliability
To judge a sell signal’s accuracy, traders dig into historical performance and backtesting. They look for things like win rate, profit factor, and whether the signal holds up in different markets.
Signals that match up with tried-and-true indicators—like moving averages or RSI—tend to be more trustworthy. If you can confirm a signal with several indicators or market conditions, you’re less likely to get fooled by a fluke.
Here’s a simple table to compare signals:
| Metric | Signal A | Signal B |
|---|---|---|
| Win Rate | 62% | 57% |
| Profit Factor | 1.7 | 1.3 |
Honestly, it’s better to stick with proven, backtested signals than to chase after hot tips or random patterns that haven’t stood the test of time.
Implementing Sell Signals in a Trading Strategy
To actually use a sell signal, you need risk management and clear rules. Figure out your position size based on how strong the signal is and your account size. Stop-loss orders and preset exits help you avoid big hits.
Setting profit targets keeps you from bailing out too early or hanging on long after a sell signal. Some traders use formulas or base their exits on support and resistance levels—it doesn’t have to be fancy, just consistent.
Here’s a rough process:
- Double-check the signal with a few indicators.
- Set your stop-loss and profit targets.
- Decide how much to trade.
- Place your order according to your plan.
Sticking to your process is key, especially when markets get wild.
Choosing And Evaluating Signal Providers
Picking a good signal provider means understanding what each platform actually brings to the table. Strong, reliable trading signals and solid data tools can make a big difference in your timing and results.
Using TrendSpider for Sell Signals
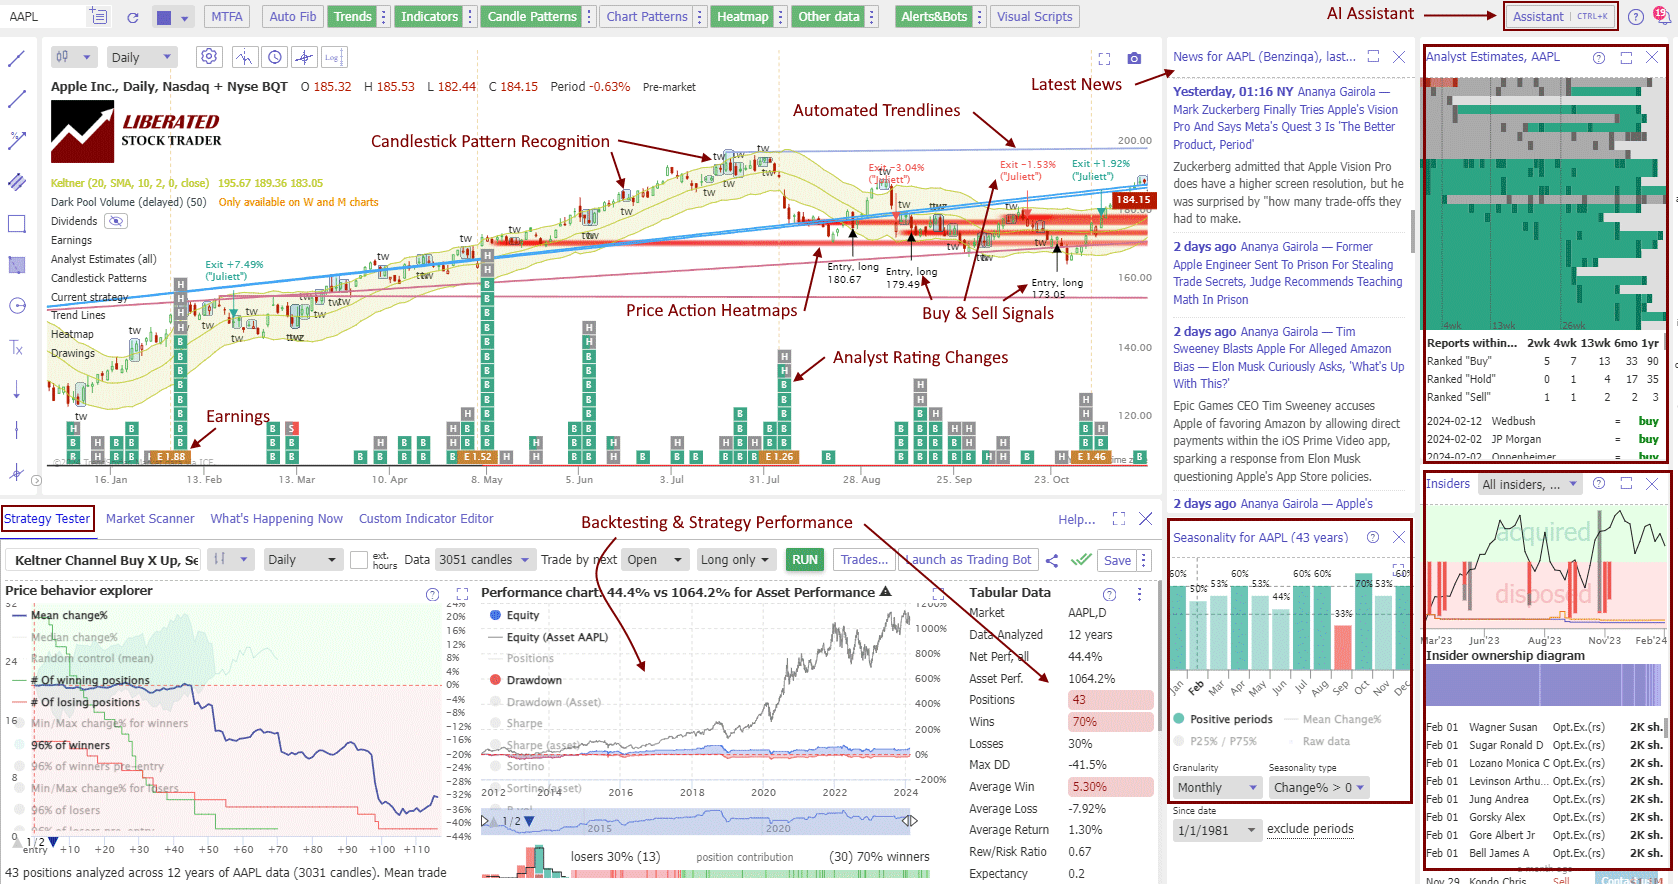
TrendSpider packs in automated technical analysis tools that help you spot possible sell signals quickly. Its algorithms chew through price action, volume, and trends in real time, pinging you when things match your criteria.
You can set up automated alerts for key events like trendline breaks, crossovers, or candlestick patterns that often hint at reversals. The backtesting feature lets you see how your strategies would’ve worked in the past, which is pretty handy for making decisions with some actual data behind them.
TrendSpider’s visual tools—multi-timeframe analysis and heatmaps—make it easier to confirm signals and cut down on emotional mistakes. If you want, you can even connect it to your broker for smoother trade execution.
TrendSpider – The Smartest AI-Powered Trading Tool on the Planet

- Explore 220+ charts and indicators for next-level analysis
- Master 150+ candlestick patterns to spot opportunities
- Unlock powerful seasonality charts for smarter decisions
- Stay ahead with news and analyst ratings at your fingertips
- Let AI-Powered Chart Analysis turn raw data into winning insights
- Test any trading idea in seconds with easy point-and-click backtesting
- Transform ideas into action with auto-trading bots ready to execute your strategies!
Using the Trade Ideas Platform for Sell Signals
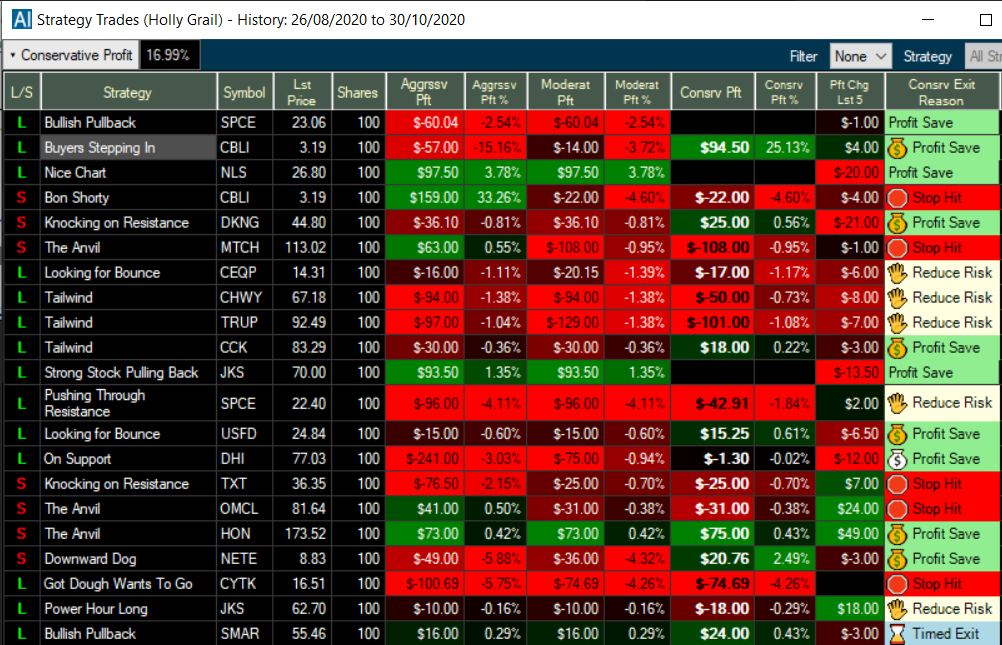
Trade Ideas uses AI to deliver high-probability trade signals from a constant stream of market data. Their AI, “Holly,” scans thousands of stocks all day and spits out trade ideas—including sell signals—by weighing technical, fundamental, and some proprietary factors.
With pre-built or customizable alert windows, you can zero in on sell setups that fit your risk and strategy. Each signal comes with suggested entry, exit, and stop loss points, so you’re not flying blind.
They also give you detailed performance stats and event-based simulations, so you can see if the signals actually work. That kind of transparency is great for figuring out which signals to trust and for tightening up your trading game.

Using TradingView for Sell Signals
TradingView has a huge charting suite and tons of user-created and official scripts that can send out automated sell signals. You can tweak open-source indicators or build your own to match your approach, whether you’re trading stocks, forex, or crypto.
The platform’s alerts system lets you set up notifications for technical events—moving average crossovers, RSI levels, support/resistance breaks, and so on. You’ll get these alerts in real time by email, SMS, or browser pop-up.
There’s also a big community for sharing and discussing trade ideas, which is great for cross-checking and getting other perspectives. With all its tools and collaboration features, TradingView’s pretty flexible for anyone wanting timely, reliable sell signal alerts.
My thorough testing awarded TradingView a stellar 4.8 stars!
With powerful stock chart analysis, pattern recognition, screening, backtesting, and a 20+ million user community, it’s a game-changer for traders.

Whether you’re trading in the US or internationally, TradingView is my top pick for its unmatched features and ease of use.
FAQ
How can traders accurately identify entry opportunities in the stock market?
Most traders rely on a mix of price action, technical indicators, and the broader market context to spot solid entry opportunities. Moving averages, support and resistance, and volume spikes are some of the big ones for flagging potential buy setups.
Screening for momentum or breakout patterns can boost your chances of getting into trades with a decent risk-reward setup.
What strategies are crucial for evaluating profitable exit points in trading?
Having set profit targets and stop-loss levels is a big deal for sticking to disciplined trade exits. Trailing stops can help you catch more of a trend if things go your way.
Some folks use reversal signals—like bearish candlestick patterns, overbought RSI, or negative oscillator divergences—to figure out when to close positions.
Are there specific chart patterns that indicate high probability trading setups?
Definitely, classic patterns like head and shoulders, double tops/bottoms, flags, and triangles often point to high probability buy or sell situations. These usually signal shifts in sentiment and can come before big price moves.
Which indicators are most reliable for triggering sell signals in stock trading?
Relative Strength Index (RSI) and Moving Average Convergence Divergence (MACD) are go-tos for spotting sell signals. An RSI above 70 or a bearish MACD crossover often means momentum’s fading.
Other useful tools: moving average crossovers, Stochastic Oscillator, and volume analysis for double-checking sell triggers.
What is the 90% rule in trading, and how does it apply to selling strategies?
The 90% rule in trading basically says that about 90% of new traders end up losing money, usually because they lack discipline, ignore risk management, or let emotions call the shots. It really drives home why you need some kind of structured sell strategy. If you don’t have clear exit rules and risk controls, you’re probably just setting yourself up for the same mistakes over and over.
So, if you take this rule seriously, you’ll want to have a predetermined exit plan and actually stick with it, even when the market tries to mess with your head.
