The KDJ is a stochastic oscillating technical analysis indicator that helps traders predict price reversals.
According to my detailed research, the KDJ is a reliable indicator, with a 63% success rate when properly configured. The best settings for the KDJ are the standard 9, 3, 3, 3, -2, and using Wilder’s Moving Averages.
If KDJ is set up poorly, it can cause significant losses and a poor reliability of 5%. My KDJ testing demonstrates how to utilize the KDJ indicator effectively.
Using TrendSpider’s strategy backtesting engine, I scientifically tested the accuracy and success rate of the KDJ indicator and its optimal settings.
Research Highlights
- KDJ is very reliable when using a Heikin-Ashi chart and the optimally tested settings.
- It is a possible buy signal when the J line crosses up through K and D.
- When the J line crosses down through K and D, it is a sell signal.
- KDJ produces many false signals.
- Testing shows KDJ is better on daily charts.
Many chart indicators are not profitable, but KDJ is, although it has its weaknesses. Learn everything you need to know about trading the KDJ indicator.
What Is the KDJ Indicator?
The KDJ is an oscillating technical analysis indicator based on momentum and volatility. It creates buy and sell signals in asset prices, focusing on the overbought/oversold regions. The KDJ uses the principles of a stochastic oscillator, but is implemented with a third J line. It can be a volatile indicator, so choosing the right settings for your trading style is important.
The KDJ indicator is based on the Stochastic Oscillator, created by George Lane in the 1950s, to identify market trend reversals.
KDJ is an acronym for the three components of the indicator that make up its unique line – K, D, and J.
- K stands for the “K-line,” a smoothed version of the price relative to previous trading ranges over a certain period.
- D stands for “D-line,” a smoother version of the K-line used to show long-term trends.
- J stands for “J-line,” a derivative of the K and D lines that indicate potential overbought or oversold levels relative to past KDJ readings.
The combination of these three components creates a unique J signal line.
KDJ Chart Example
The KDJ indicator has three elements: %K (fast stochastic), %D (slow stochastic), and J Line, the ‘signal line.’ The %K and %D lines are momentum indicators that measure how quickly the price moves over a certain period. The J Line is a signal line created by combining %K and %D lines, generating a buy or sell signal when it crosses the two lines.
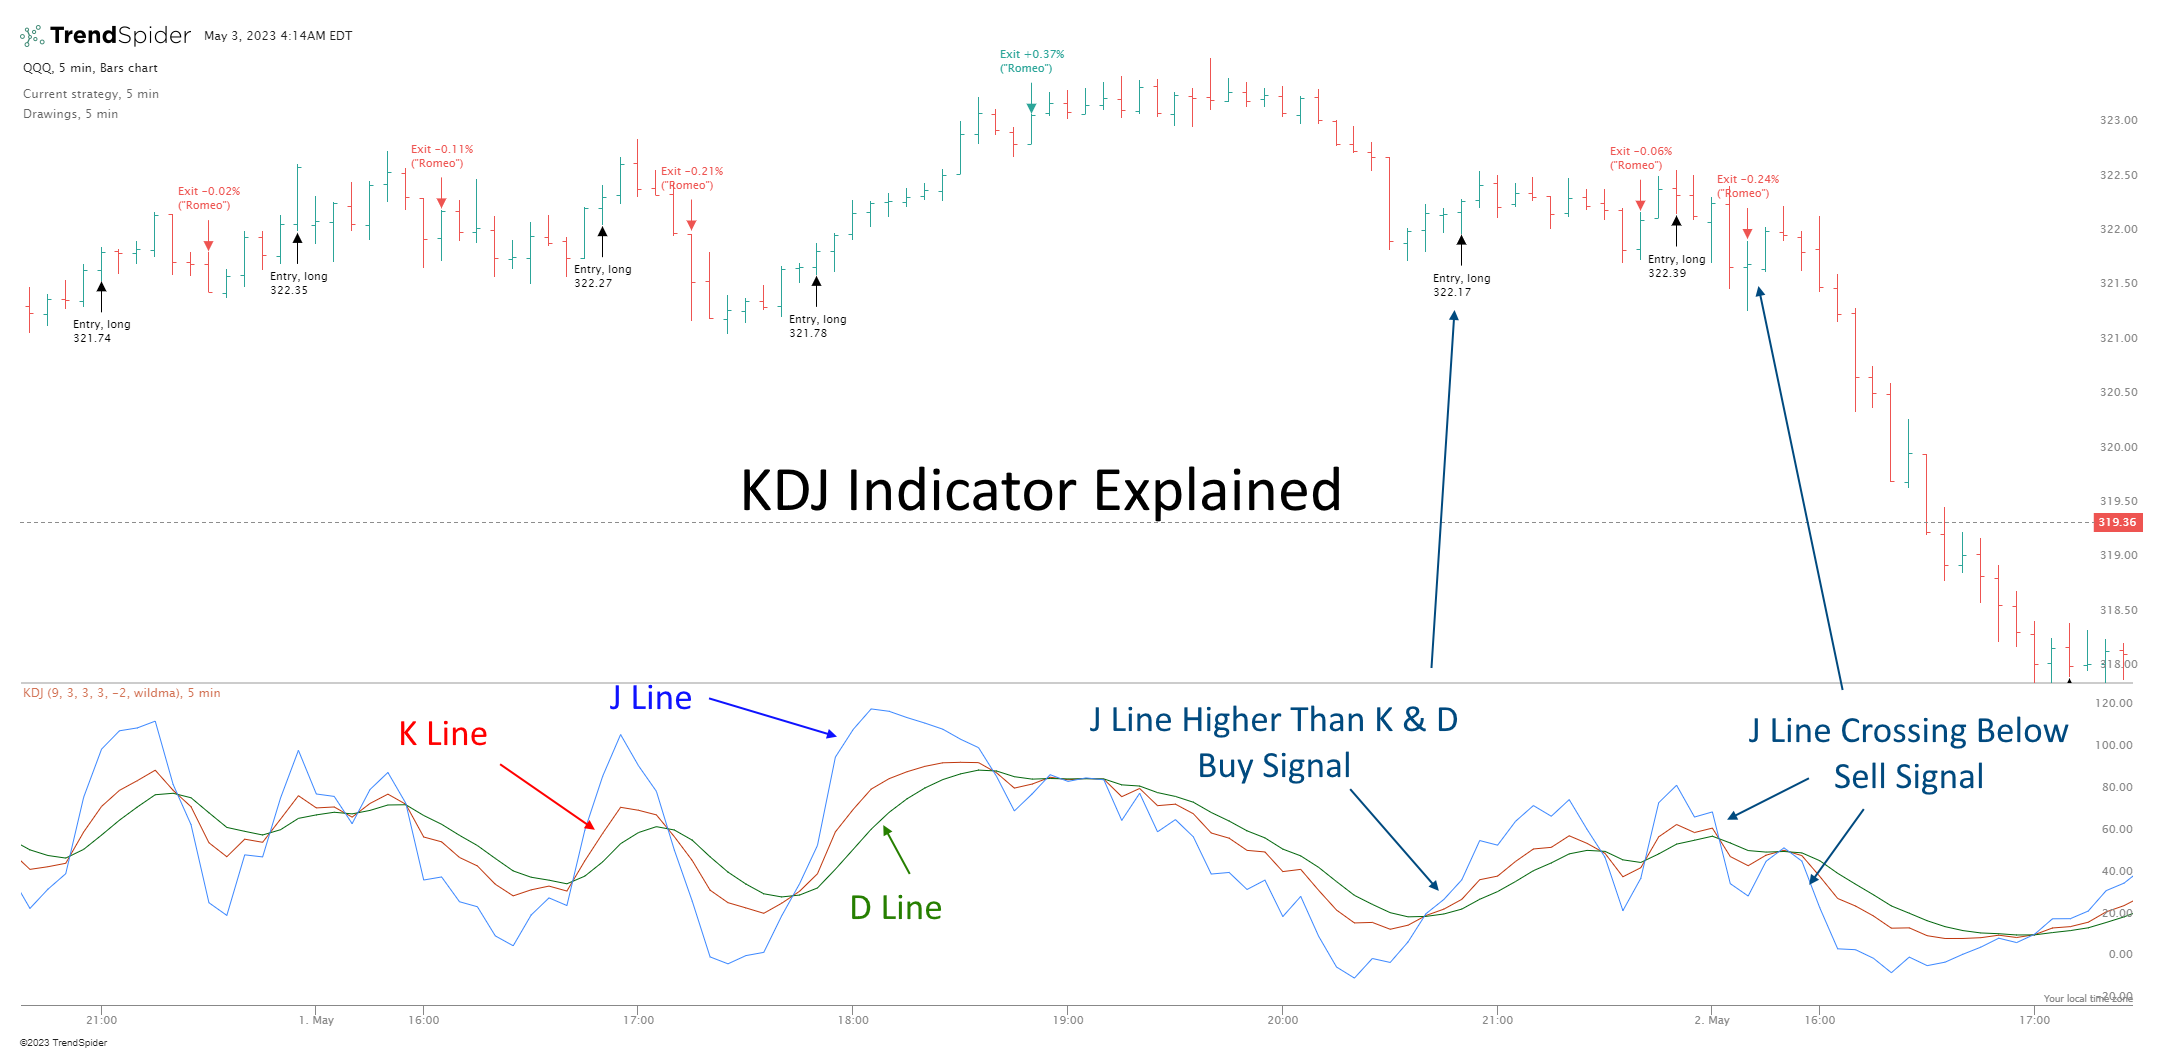
KDJ Indicator Explained
The KDJ indicator is a momentum oscillator that plots an asset’s relative strength using three separate lines. %K (fast stochastic) measures the current price level relative to its recent highs and lows, while %D (slow stochastic) is a smoothed version of %K. The J line is a derivative of the two, calculated as a 3-period moving average of %K and %D.
Combining these three components creates a unique J signal line that indicates potential overbought or oversold levels relative to past KDJ readings. When the J line is above 80, it may indicate an overbought market; when it’s below 20, it may indicate an oversold market. Traders can use this signal line to spot potential entry and exit points for trades.
Additionally, traders often consider divergence between %K and %D as a possible buy or sell signal. If the direction of the two lines diverges (i.e., one is trending up while the other is trending down), it can indicate a potential reversal in price. For example, if %K is trending up and crosses above the %D line, this could signal an upcoming bullish trend. Conversely, if %K is trending down and crosses below the %D line, this could signal an upcoming bearish trend.
KDJ can be useful for traders to take advantage of the market’s momentum and possible price reversals. However, it is important to note that no trading system is perfect, and these signals should not be used as the sole basis of any trading decisions.
TrendSpider 4.8/5⭐: My Pick for AI-Power & Auto-Trading
I’ve used TrendSpider for 7 years for my research and testing. It auto-detects trendlines, patterns, and candlesticks, backtests ideas, and lets you use AI to create unique strategies and launch trading bots—with no code.

Save 38% to 45% on TrendSpider
Our Top Rated 4.72 ⭐ Trading Tool
✅ Leader in AI Trading & Chart Pattern Recognition
✅ Scanning & Auto-Trading
Deal Ends In:
Pros:
- On a daily Heikin Ashi chart using a standard setting, the KDJ has a good performance track record in backtesting.
- KDJ is a very responsive indicator.
- KDJ has many settings that can be optimized.
Cons:
- The KDJ indicator is very volatile and produces many small losses.
- KDJ generates a low reward-to-risk ratio of 1.85.
- KDJ is not suitable for trading stable assets with low price volatility.
- Testing shows the KDJ should not be used with Candlestick charts.
How to use KDJ in Trading?
To read a KDJ chart, look for the J line crossing up through the K and D lines and interpret that as a buy signal. Conversely, when the J line crosses down through the K and D lines, it is a trend reversal signaling to exit a trade or sell short.
The KDJ indicator is calculated by taking the current price and subtracting the value of a given period (usually 14 days). This value is then divided by the value of the same period to measure the percentage change.
A positive indicates that prices are increasing, while a negative one suggests that prices are declining.
Traders can use this to identify areas of support and resistance. When the indicator is above zero, it suggests that prices are increasing and provides a level of support. Conversely, when the indicator is below zero, it suggests that prices are decreasing and provides a level of resistance. Additionally, traders may look for divergence between the price action to identify potential reversals.
Is KDJ Accurate?
When set up correctly, the KDJ indicator can be accurate, but it can cause many small losses. Backtesting the KDJ indicator on 30 Dow Jones Industrial Average stocks over 20 years resulted in a 63% win rate, outperforming a buy-and-hold strategy. The KDJ indicator can produce many small losses but spot larger wins on longer timeframes.
KDJ Indicator Backtesting Methodology
To backtest the KDJ indicator, I used TrendSpider, the leading AI stock trading software with pattern recognition and a codeless backtesting engine. Testing was configured with a Heikin Ashi daily chart, and the exit criteria were set to the next trading day, HL2 (Price High + Low /2).
| Testing Criteria | Daily Settings | 5-Minute Settings |
| Index: | DJIA | DJIA |
| Date Range | 20 Years/5000 Candles | 3 Months/5000 Candles |
| Settings: | 9,3,3,3, -2, WildersMA | 9,3,3,3, -2, WildersMA |
| Entry Criteria: | J is 10% > K & D Lines | J is 10% > K & D Lines |
| Exit Criteria: | J is 10% < K & D Lines | J is 10% < K & D Lines |
| Sell: Next Open | (Price High + Low /2) | (Price High + Low /2) |
I test all indicators, including the KDJ, using their standard recommended settings, different timeframes, and different chart types; this provides an unbiased result. Also, the entry and exit prices use an average of the high and low prices for the day, making the testing more realistic.
KDJ testing for day trading was done using a standard OHLC candle chart and a Heikin Ashi chart. The KDJ is a volatile indicator, so I added the condition that the J line must be at least 10% higher than the other lines for a buy signal or 10% lower for a sell signal. Without this condition, KDJ produces too many false signals and huge losses over time.
Results for Day Trading
As you can see, while the day trading margins were tight, the Heiken Ash chart was a superior setting for day trading than the OHLC candles. KDJ beat buy and hold on 22 of the DJ30 stocks, giving a ratio of 73%, versus the OHLC trade, which had only a 30% success rate.
| KDJ 3-Month Backtest | OHLC Chart | Heikin Ashi Chart |
| Timeframe: | 5-min | 5-min |
| Average Reward/Risk Ratio: | 1.45 | 1.7 |
| % of Tickers Beating Buy & Hold | 30% | 73% |
| Average # Trades | 340 | 275 |
| Winning Trades %: | 40% | 42% |
| Average Win: | 0.4% | 0.48% |
| Average Loss: | -0.2% | -0.22% |
I tried many backtesting solutions, but this testing was only possible using TrendSpider.
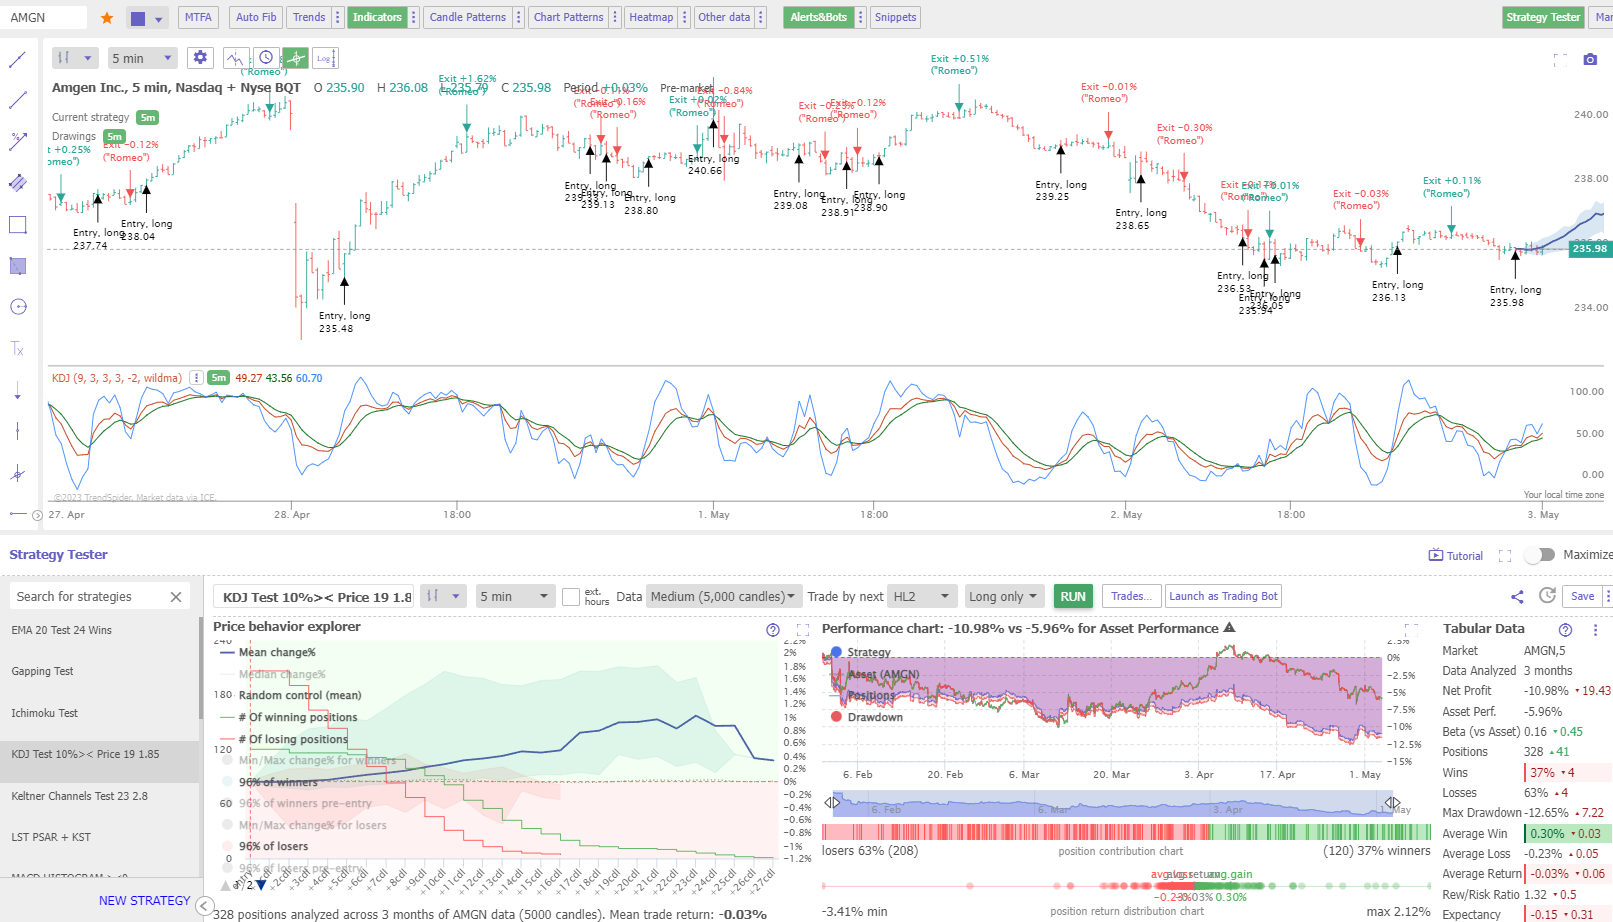
Testing KDJ on OHLC Charts Example
In this typical example of KDJ on an OHLC chart, day trading a 5-minute bar on AMGEN produced significant losses over three months. The trader would have lost 10.98%, while a buy-and-hold investor would have lost only 5.96%. This makes KDJ a poor choice for day trading on a candlestick chart.
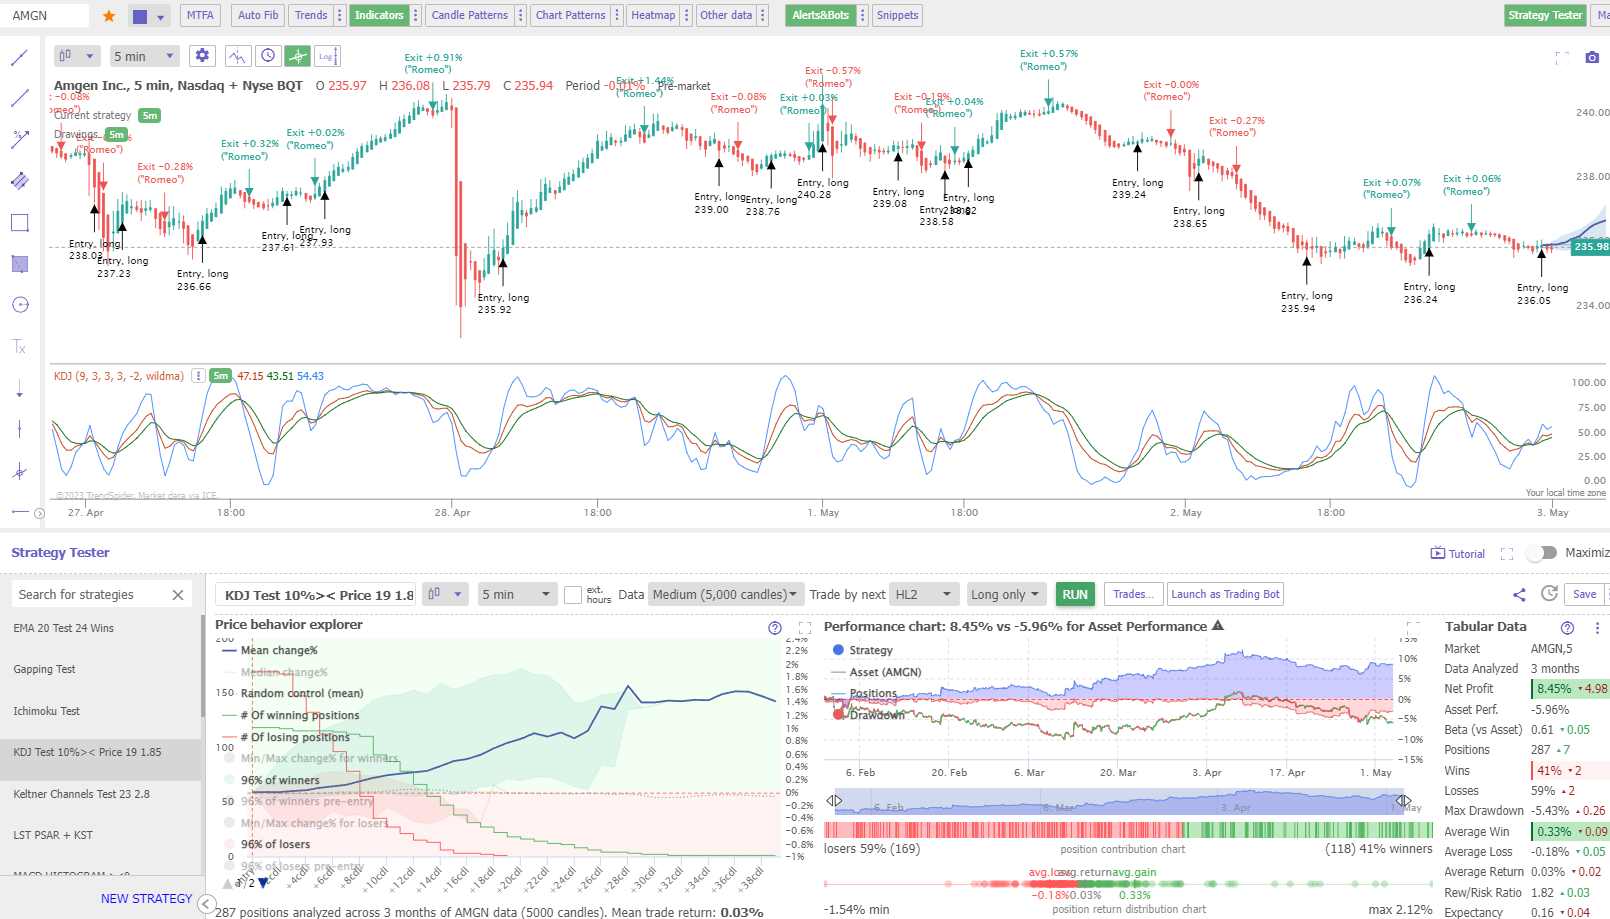
Testing KDJ on Heikin Ashi Charts Example
Testing KDJ on a 5-minute Heikin Ashi chart on AMGEN produced an 8.45% win over three months. A buy-and-hold investor would have lost 5.96%. The smoothing effect of the Heikin Ashi chart means fewer false signals, resulting in 287 trades, as opposed to the previous example of 328 trades.
Powerful Point & Click Backtesting With TrendSpider
Results for Daily Charts
Using the standard KDJ settings on a candlestick/OHLC chart was a disaster, with 29 (97%) of the 30 DJIA stocks failing to beat a buy-and-hold strategy. Using a Heikin Ashi chart, the results were impressive, with KDJ beating a buy-and-hold strategy 66% of the time.
| KDJ 20-Year Backtest | OHLC Chart | Heikin Ashi Chart |
| Timeframe: | Daily | Daily |
| Average Reward/Risk Ratio: | 1.6 | 1.7 |
| % of Tickers Beating Buy & Hold | 3% | 66% |
| Average # Trades | 310 | 275 |
| Winning Trades %: | 40% | 42% |
| Average Win: | 4.2% | 5.2% |
| Average Loss: | -3.1% | -2.5% |
I tried many backtesting solutions, but this testing was only possible using TrendSpider.
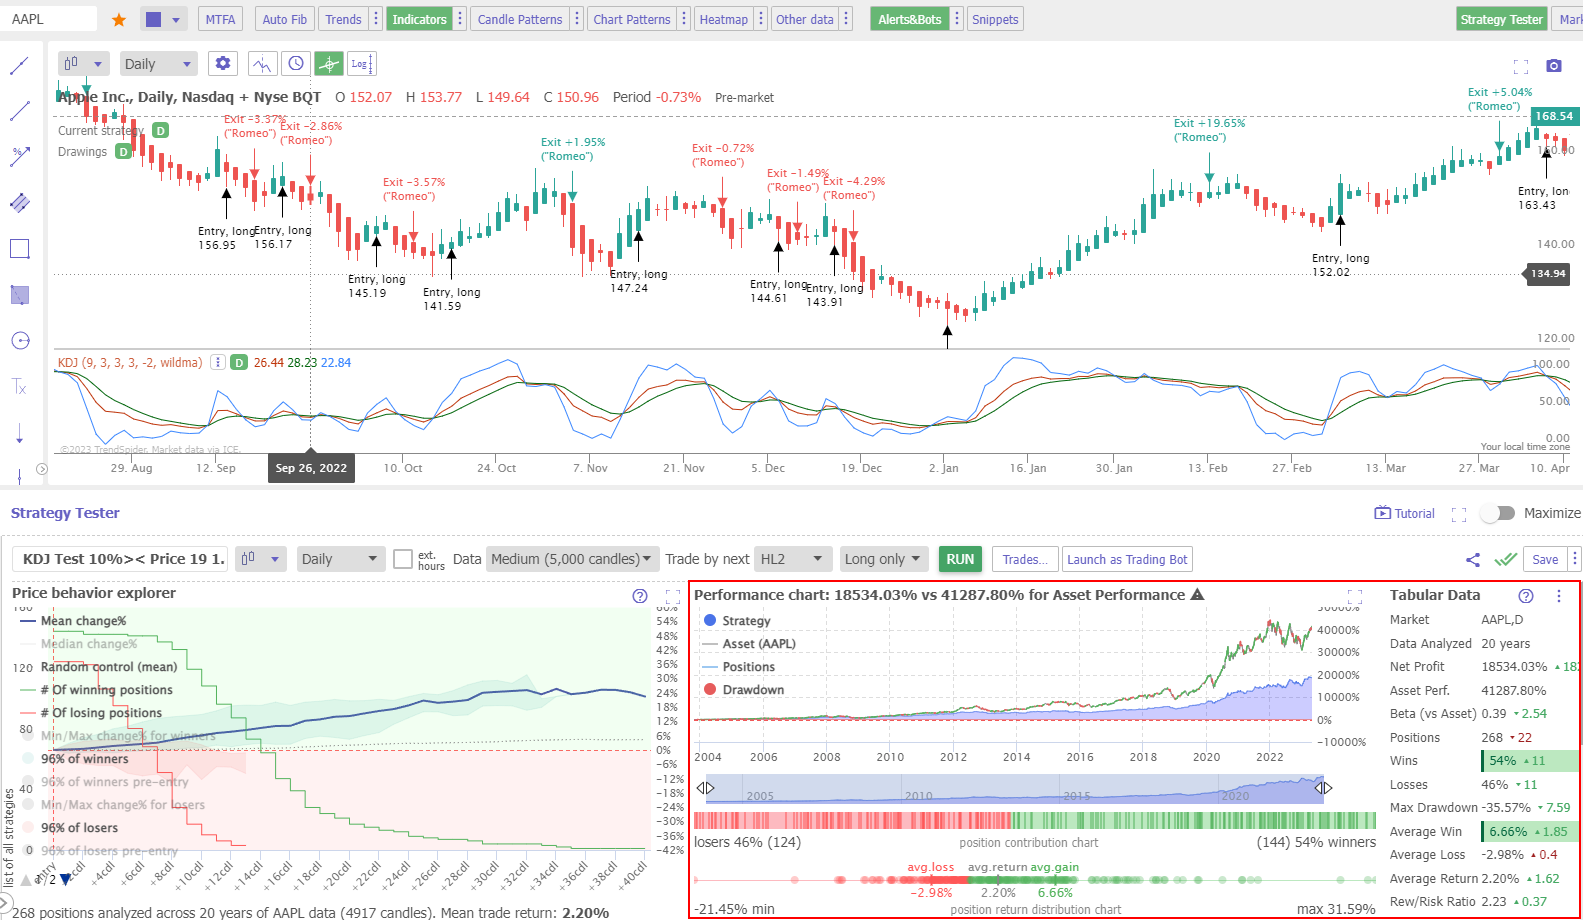
Testing KDJ on a Daily Apple Inc. Chart Example
This backtesting example shows that KDJ failed to beat a buy-and-hold strategy on Apple’s stock chart. While the average win and the reward-to-risk ratios were OK, the stock’s strong trend meant that buy-and-hold was the best strategy.
Testing Performed With TrendSpider
Testing KDJ on a Daily Intel Corp. Chart Example
This test demonstrates that using KDJ on the right stock can produce good profits. While Intel has made a buy-and-hold loss of 5.34% over the last 20 years, KDJ returned a profit of 280%.
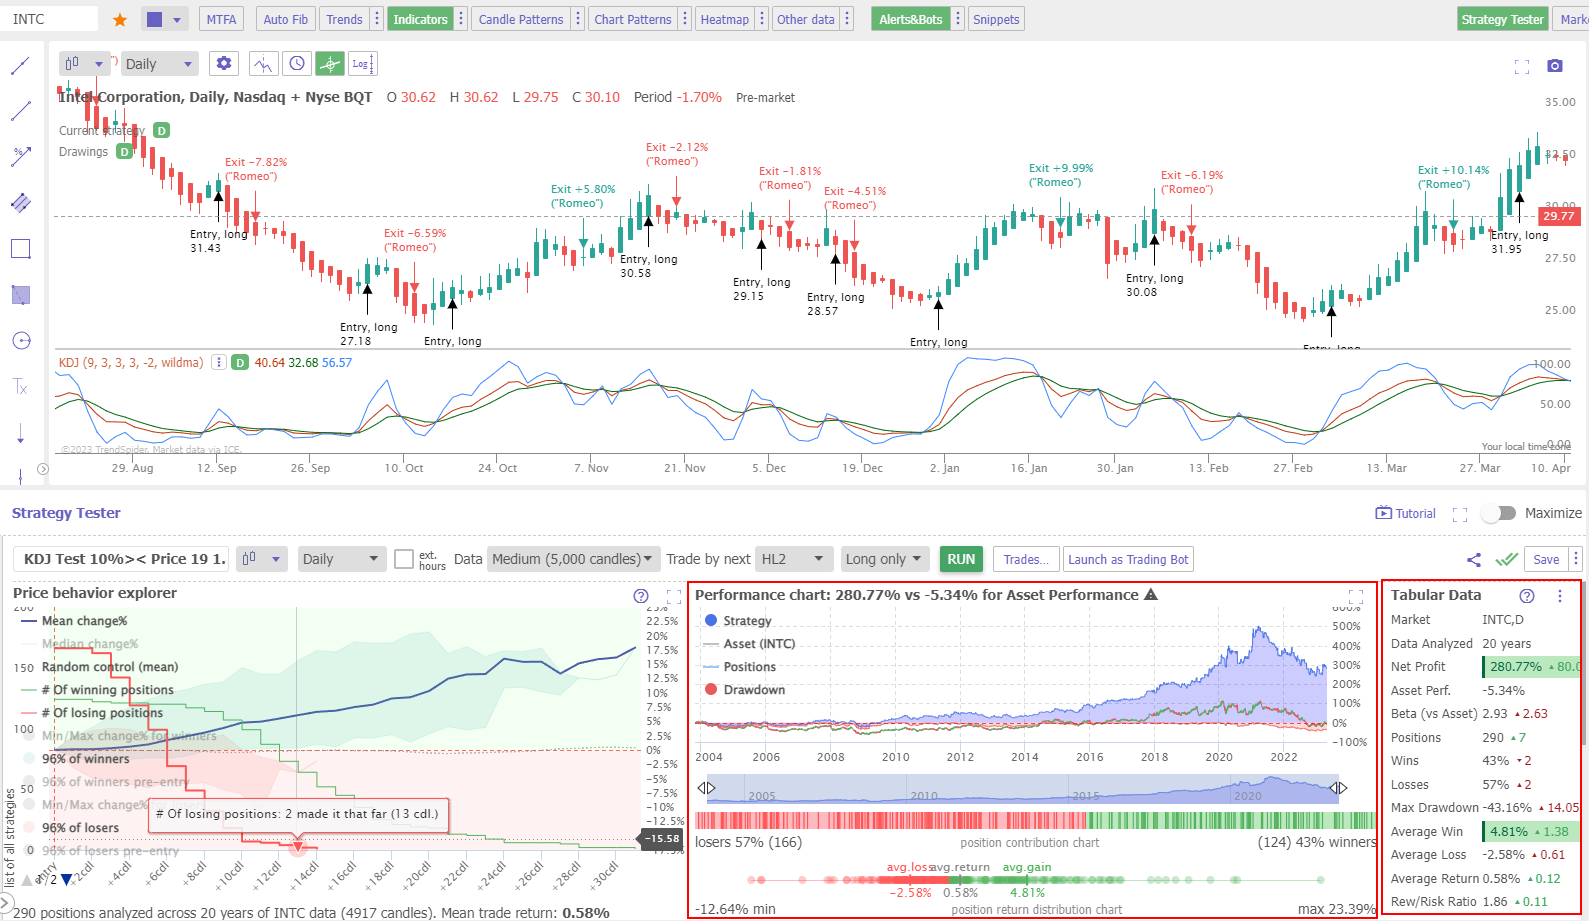
Testing Performed With TrendSpider – The Best Software for Traders
Why are Heikin Ashi’s KDJ results better?
Why does Heikin Ashi perform well with KDJ and other indicators like Keltner Channels and Price Rate of Change? I believe it is because price averaging removes the extreme price highs and lows associated with traditional OHLC bars. This leads to fewer trades in consolidating markets and fewer small losses.
Professional traders may assume, as I did, that the Heikin Ashi chart distorts the pricing because it averages the OHLC of the candles. But I can achieve realistic entry and exit criteria by using TrendSpider’s HL2 setting, meaning the average of the price candle high and low. I proof-checked individual trades, and they were reasonable.
Using KDJ as Trend Confirmation
A positive KDJ J line validates a bullish trend, whereas a negative J line confirms a bearish one. However, due to KDJ’s inherent volatility, it is worth testing longer moving averages and smoothing criteria. Alternatively, the trend can be confirmed by ensuring the L line is a certain percentage above the K and D lines.
Combining KDJ with Moving Averages
The KDJ can be combined with other chart indicators, such as moving averages or the best chart patterns. For example, most indicators perform well when a stock is trending either up or down. But when the price consolidates, KDJ provides many false buy and sell signals, causing small losses in trading. Make sure not to trade this indicator in consolidating markets.
Can the KDJ be used for Buy and Sell Signals?
My research backtesting shows that the KDJ is an excellent indicator for identifying buy and sell signals independently of other indicators. Over 20 years, beat a buy-and-hold strategy on 66% of the Dow Jones Industrial Index stocks by a significant margin.
How to Use KDJ in Trading
Traders can also use KDJ to signal price divergences, but this isn’t easy to backtest and is unproven. For example, if prices are making higher highs, but the KDJ is making lower highs, it could suggest that price momentum is weakening, and a reversal may be imminent. Similarly, if prices are making lower lows, but the KDJ is making higher lows, it suggests that prices could soon reverse and start to increase. Additionally, you can combine KDJ with KST to achieve improved results.
KDJ Indicator Strategy
MY research confirms that the best KDJ strategy for day trading is to use a Heikin Ashi chart and set an entry/exit signal when the J line is 10% above or below the K and D lines. It is essential to avoid using the Japanese Candlestick chart or OHLC bars when employing a KDJ strategy, as the volatility results in numerous small losses.
The Best Settings for KDJ
According to my testing, the best settings for KDJ are the standard 9,3,3,3, -2, and using Wilder’s Moving Averages. Combining these settings with a daily Heikin-Ashi chart provides a setup with a 66% chance of outperforming a buy-and-hold strategy. Avoid using OHLC bar charts with KDJ, as this can result in many small losses.
The KDJ Formula
K = (RSV – L9) * 100 / (H9 – L9)
D = (K1 + K2 + K3 + K4 + K5)/5
J = 3*K – 2*D; Where RSV = (Closing Price – Lowest Low/ Highest High – Lowest Low) * 100; L9 = lowest low of the past 9 days; H9 = highest high of the past 9 days.
K1, K2, K3, K4, and K5 refer to the previous 5 periods of K values.
KDJ Indicator Calculation
The KDJ indicator helps traders identify potential market turning points by combining momentum, trend, and volatility. It does this through its three components: K, D, and J.
The K line measures recent price trends, the D line is a 3-day moving average of the K line, and the J line is a 3-day weighted moving average of the K line.
Summary
The KDJ is a mixed bag of results for traders, with proven accuracy and success rates under very limited conditions. Traders should always perform backtesting and strategy analysis before trading any asset.
FAQ
What is the best software for backtesting chart indicators?
Our detailed testing and research on chart indicators has been performed with TrendSpider, which I believe is the best trading software for backtesting and strategy development. Our list of backtesting software will help you make a choice.
How to read KDJ?
To interpret a KDJ chart, locate the J line crossing up through the K and D lines, indicating a buy signal. Conversely, when the J line crosses down through the K and D lines, it is a trend reversal signaling the need to exit a trade or sell short.
How does KDJ work?
KDJ is a technical analysis indicator that combines the asset price into a series of moving averages, called stochastic measurement. KDJ focuses on assessing overbought and oversold conditions in the market. The J line is the one to watch; when it surges upwards, it signals a buying opportunity.
What is the KDJ trading strategy?
The KDJ trading strategy involves buying an asset or stock when the J line moves above the K and D lines. Traders can also use the opposite strategy to sell short or buy put options when the J line reverses and moves below the other lines. Beware, shorting strategies are far less profitable than long strategies in trading.
Does KDJ work?
Yes, according to our testing, KDJ works best using Heiken Ashi charts on a daily timeframe. However, using KDJ on an intraday OHLC or Candlestick chart is a poor predictor of price trends and direction reversals.
How accurate is KDJ?
The KDJ indicator is often inaccurate, especially with a standard OHLC, line, or candlestick chart. Our research indicates that, on a daily or 5-minute chart, KDJ has a loss rate of 97 percent. Although marketed as a good strategy, the rate of change and moving averages tend to be more effective.
How to make money trading the KDJ system?
Our research demonstrates that making money using a KDJ system is difficult, especially when day trading. 5-minute charts using KDJ typically lose 60% of trades with a reward-to-risk ratio of less than 2, so it is nearly impossible to make money using KDJ.
How to use KDJ with Crypto or Forex?
You can use KDJ with cryptocurrency or Forex trading, but our tests show the results are poor, with only a 10 to 60% success rate, and 60% of trades are losers. Whether you choose stocks, crypto, or forex for trading, you must avoid the KDJ strategy or perform testing to optimize the setting.
Is KDJ a good indicator?
No, our research shows that KDJ is not a good indicator on standard settings using standard charts. Using a Heikin Ashi daily chart can boost the effectiveness of KDJ, but you also need to play with the change rates of the J line. It has a low success rate of 10 to 60%, with an average of 60% of losing trades.
What are better indicators than KDJ?
There are many better indicators than KDJ, such as the rate of change and moving averages. Our testing has proven these indicators to be much more effective, work on many timeframes, and are more successful in trading strategies.
Is KDJ the best indicator?
No, KDJ is not the best indicator; it is one of the worst indicators in technical analysis. It has a low success rate and an average of 70 percent losing trades when trading the Dow Jones Industrial Average. If you want to be successful in trading, learn how to backtest trading strategies.
What is the best time frame for KDJ?
The best timeframe for a KDJ strategy is daily. We conducted time-based research and found that the KDJ system underperformed the market on all timeframes from 5 minutes to daily charts. However, the KDJ failure rate was lower with daily charts.
How reliable is KDJ?
The KDJ is a moderately unreliable chart indicator. Our 20 years of backtests on 30 major US stocks show a 30% chance of beating a buy-and-hold strategy on a daily candlestick chart and a 3% chance on a 5-minute chart. Testing confirms it is an unreliable indicator and should be avoided.
What is the best software for trading KDJ?
Our rigorous analysis of KDJ trading was executed utilizing TrendSpider, the best trading software for backtesting and strategy development, in my professional opinion.