The simple moving average (SMA) technical analysis indicator helps identify stock price trends. It calculates an arithmetic average of prices, offering a smooth line that eliminates short-term price volatility. SMAs can be used as potential support and resistance lines.
But does the SMA work? Is it a profitable and reliable tool for traders?
To find out, I backtested 960 years of data and 68,040 trades to test the success rate of trading the 20, 50, 100, and 200-day moving averages.
What is a Simple Moving Average?
A Simple Moving Average (SMA) is a technical analysis indicator that helps traders analyze prices over time. The SMA calculates the average closing price of an asset over a given period, typically between 5 to 200 days. It is used to smooth out short-term price fluctuations and filter out noise from the underlying trend.
The simple moving average supposedly helps traders identify trends in the market and make decisions about their trades, but in reality, it performs very poorly.
Traders should avoid using the SMA to determine when to buy and sell an asset based on its historical performance. Instead, they should use the SMA only as a support or resistance indicator to better understand potential price movements.

KEY TAKEAWAYS
- The SMA is a simple calculation based on averaging the previous price closes.
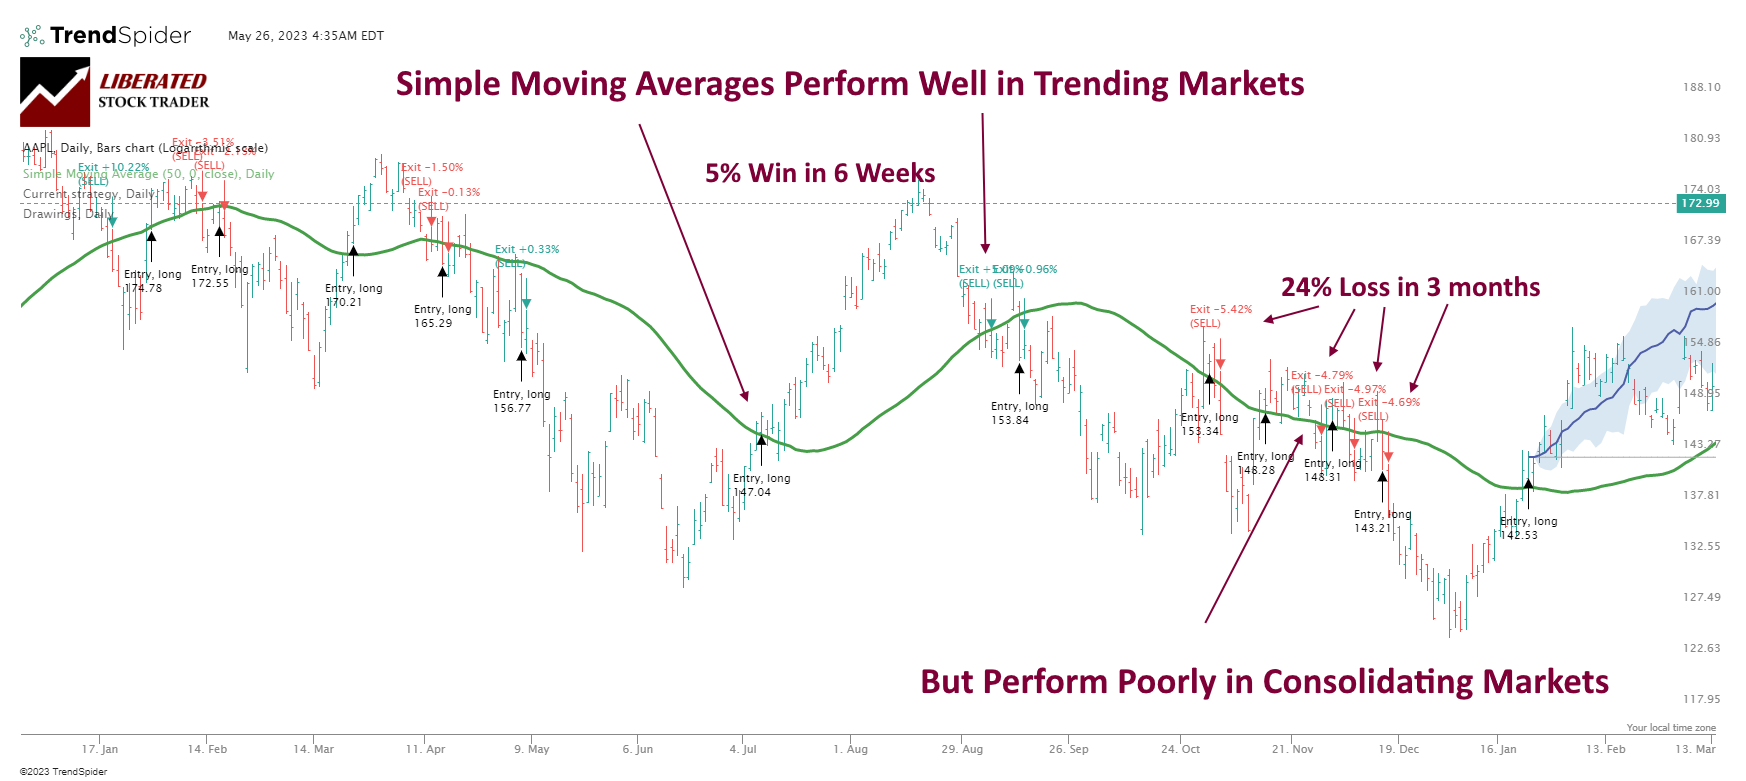
- SMAs work well on strongly trending markets and equities.
- SMAs perform very poorly in range-bound markets, and traders should be aware of this.
- Traders should use longer SMAs to identify the overall trend and shorter SMAs for more short-term price movements.
- By combining moving averages, traders can increase their chances of success in trending market conditions.
Understanding Simple Moving Averages?
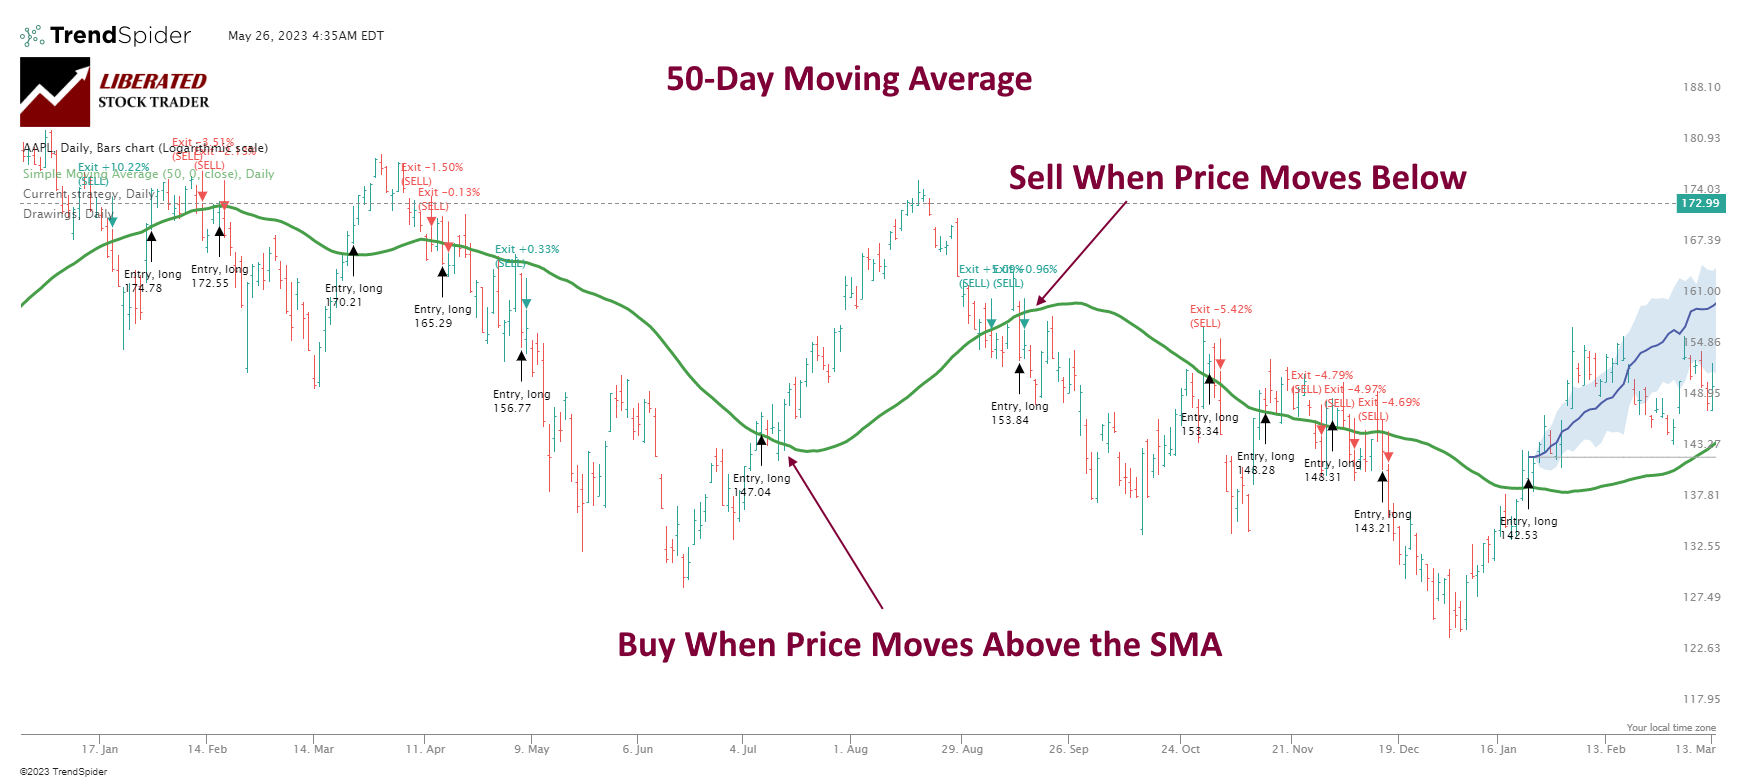
The simple moving average (SMA) is a lagging indicator that shows a stock’s average price over a certain period. As such, it can help you identify long-term trends and determine whether you should sell or buy a particular security. When the current price is above the SMA, it indicates prices are increasing and it’s a good time to buy. Conversely, when the current price is below the SMA, it may be a good time to sell.
The longer the moving average period used, the more reliable the indicator can be for determining long-term trends in stock prices. For example, if you wanted to measure an uptrend in the stock, you might look at a 200-day moving average. If prices are consistently above this line, then it’s likely that the overall trend of the stock is upwards. Similarly, if you’re looking for potential sell signals, you might use a 50 or 20-day moving average and watch when prices fall below that line.
Example Chart: 3 Simple Moving Averages
This chart shows the simple moving average traffic light system. Three moving averages are plotted on the chart: the 10-period SMA in green, the 50-period SMA in amber, and the 100-period SMA in red.

Get Moving Average Indicators on TradingView
Pros
One of the main advantages of using a Simple Moving Average is that it’s easy to calculate. Most charting software packages already have the calculations built-in, so there’s no need for complicated formulas or manual calculations. The SMA also provides a clear visual representation of price trends, which can be easier to interpret than other types of technical analysis.
Cons
The biggest disadvantage of simple moving averages is that they perform very poorly during market or stock price consolidation periods, with losses outnumbering gains.
Powerful Point & Click Backtesting With TrendSpider
The other drawback of using the SMA is that it doesn’t consider short-term volatility. Prices can gyrate wildly in the short term, but a long-term average like the 200-day SMA might not capture these swings. Investors relying solely on an SMA may miss important short-term buying and short-selling opportunities. Additionally, the SMA is a lagging indicator, meaning it can only confirm trends after they’ve already started. This means investors must use other indicators in conjunction with an SMA if they hope to stay ahead of the markets.
Formula:
SMA = (Sum of Closing Prices / Number of Data Points)
Calculation
To calculate the 5-day SMA for a stock, add up the closing prices over the previous five days and divide by five. This would give us the 5-day SMA. To calculate a 10-day SMA, add the closing prices over the previous ten days and divide by ten. This would give us the 10-day SMA.
You can then compare these two moving averages to get an idea of whether there is a longer-term or short-term trend in the stock’s
Example 5-day moving average calculation:
To calculate the 5-day SMA for APPLE, we can create a table with the following information:
| Day | Price | 5-Day Moving Average |
| Day 1 | 170 | |
| Day 2 | 172 | |
| Day 3 | 175 | |
| Day 4 | 174 | |
| Day 5 | 181 | 174.4 |
| Day 6 | 186 | 177.6 |
| Day 7 | 187 | 180.6 |
| Day 8 | 189 | 183.4 |
| Day 9 | 175 | 183.6 |
| Day 10 | 170 | 181.4 |
Trading a simple moving average
Using the SMA in trading requires identifying when prices move above the SMA line; this generally indicates that the trend is up. When prices move below the SMA line, this suggests a downtrend. Traders can also use crossovers as entry or exit points. A crossover occurs when the two SMAs cross and indicate a change in trend direction. For example, a buy signal is generated when the short-term SMA crosses above the longer-term SMA. Similarly, a sell signal is generated when the shorter-term SMA crosses below the longer-term SMA.
Example Chart: Trading Using a Simple Moving Average
Powerful Trading Strategy Testing with TrendSpider
Is the SMA Indicator Accurate?
No, the simple moving average indicator is inaccurate, averaging only a 12% win rate. When asset prices consolidate, the SMA causes many small losses, and good entry points are missed. Backtesting the SMA indicator on 30 Dow Jones Industrial Average stocks over eight years resulted in an average 12% win rate, meaning it underperformed a buy-and-hold strategy 88% of the time.
SMA Indicator Backtesting Methodology
To backtest the SMA indicator, I used TrendSpider, the leading AI stock trading software with pattern recognition and a codeless backtesting engine. Testing was configured using OHLC with an exit on the next open. The Heikin Ashi daily chart used the exit criteria “Next trading day HL2 (Price High + Low /2).”
| Testing Criteria | Daily OHLC Chart | Daily Heikin Ashi Chart |
| Index: | DJIA | DJIA |
| Date Range | 8 Years/2000 Candles | 8 Years/2000 Candles |
| Settings: | 20, 50, 100, 200 | 20, 50, 100, 200 |
| Entry Criteria: | Price > SMA 20 | Price > SMA 20 |
| Exit Criteria: | Price < SMA 20 | Price < SMA 20 |
| Sell: | Next Open | High+Low/2 |
I test all indicators, including the SMA, using their standard recommended settings, different timeframes, and different chart types; this provides an unbiased result. Also, the entry and exit prices use an average of the high and low prices for the day, making the testing more realistic.
How I Set Up SMA Backtesting
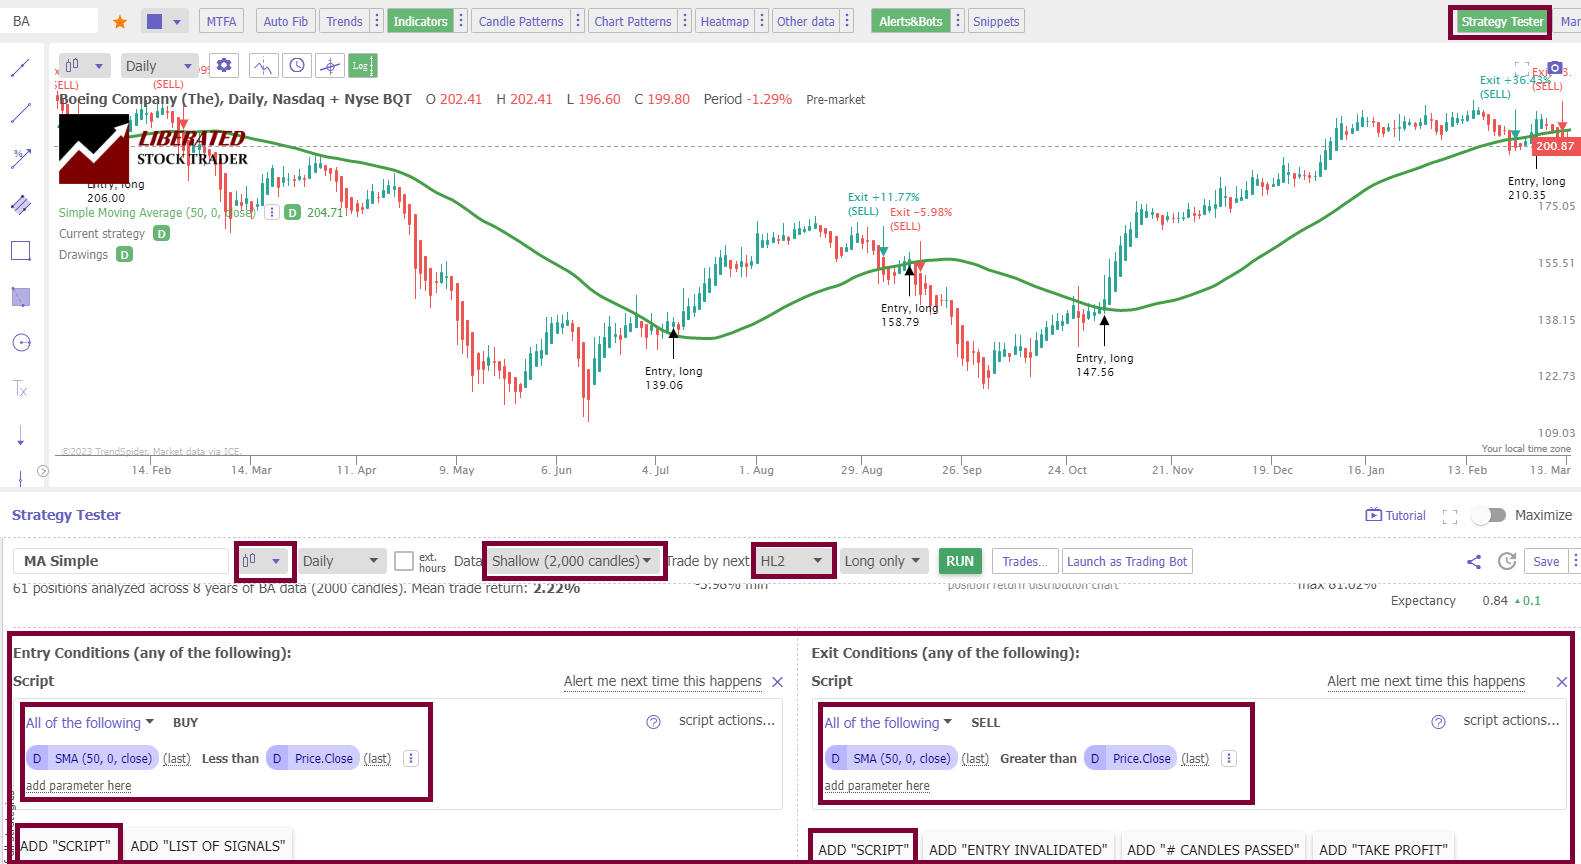
To set up backtesting, I used TrendSpider, our recommended trading software for serious traders. The screenshot below shows the exact configuration for our SMA backtesting. To set up backtesting in TrendSpider, follow these simple steps:
- Register for TrendSpider
- Select Strategy Tester > Entry Condition > Add Script > Add Parameter > Condition > Price > Greater Than > Moving Average.
- For the Sell Criteria, select > Add Script > Add Parameter > Condition > Price > Less Than > Moving Average.
- Finally, click “RUN.”
SMA Testing & Results
Testing SMA on OHLC Charts
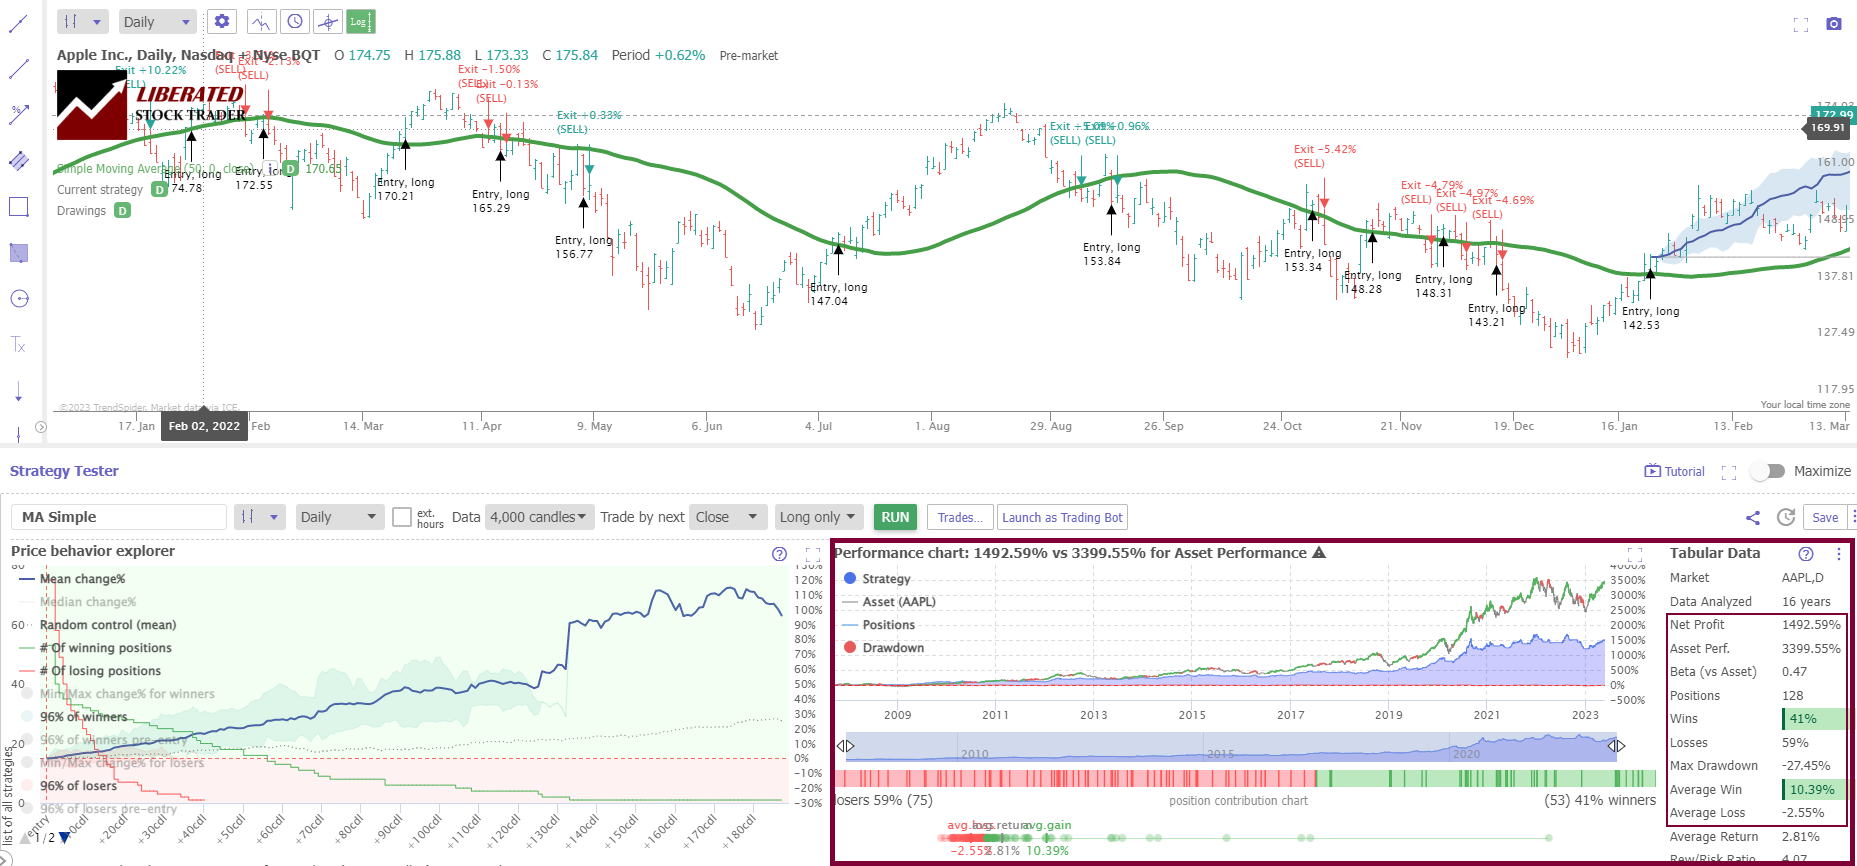
This is a typical example of a 50-day SMA on an OHLC chart. Over 16 years, a trader using the 50-day moving average on Apple Inc. (Ticker: AAPL) would have made 1492%, but a buy-and-hold investor would have made 3398%. The simple moving average’s average results mean it is a poor choice for trading on candlestick charts.
Testing Performed With TrendSpider – The Best Software for Traders
Testing the standard SMA settings on a daily candlestick/OHLC chart proves this indicator is poor, with a 12% chance of outperforming a buy-and-hold strategy on all tested timeframes.
SMA Backtesting Results for Daily OHLC Charts
Testing 960 years of data shows the average win rate for simple moving averages is 12%. The table below shows that the SMA 20 has a 23% chance of beating a buy-and-hold strategy, and the 200-day SMA only has a 7% chance of success.
| 8-Year Backtest OHLC Chart | % Win Rate | # Trades |
| Timeframe: | Daily | Daily |
| 20-Day SMA | 23% | 160 |
| 50-Day SMA | 7% | 73 |
| 100-Day SMA | 10% | 52 |
| 200-Day SMA | 7% | 23 |
| Average | 12% |
I tried many backtesting solutions, but this testing was only possible using TrendSpider.
Testing SMA on Heikin Ashi Charts
The simple moving average performs better on a Heikin Ashi chart, but the overall results are still poor. If a trader used the 50-day moving average on Boeing (Ticker. BA) over 8 years, they would have made a 162% profit, beating a buy-and-hold strategy profit of 39%.
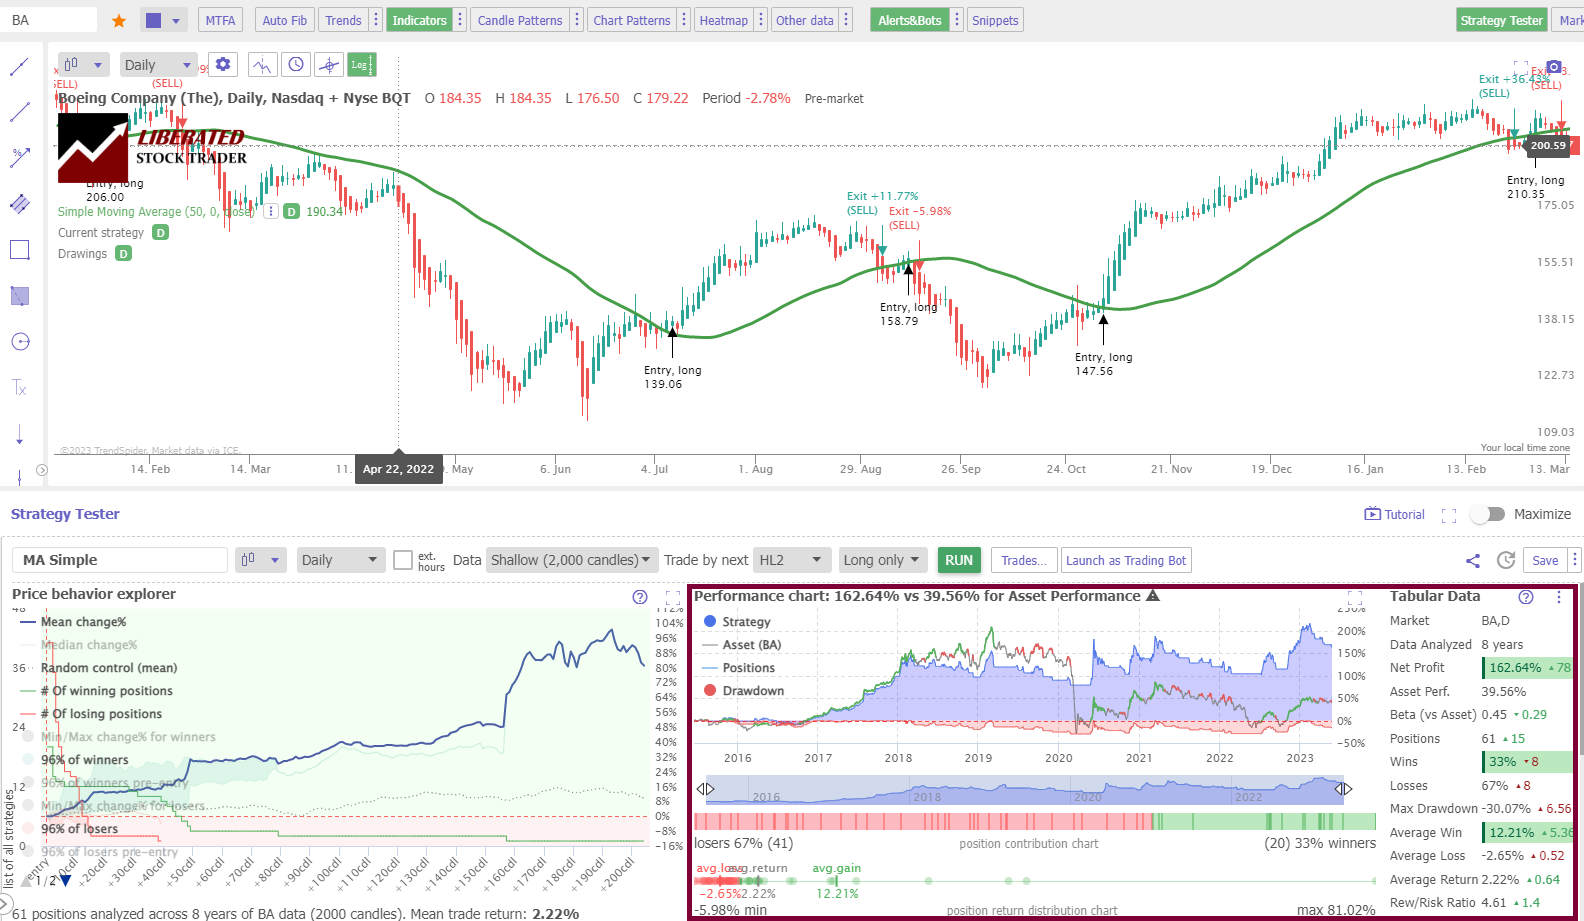
The table below shows that even using the advantages of Heikin Ashi charting, the simple moving average indicator should be avoided.
SMA Backtesting Results for Heikin Ashi Charts
Testing 960 years of data shows the average win rate for simple moving averages on a Heikin Ashi chart is 33%. This means 67% of stocks traded using this strategy will fail to beat a buy-and-hold strategy. However, using the SMA 20 produced a 70% win rate, which is excellent.
| 8-Year Backtest Heikin Ashi Chart | % Win Rate | # Trades |
| Timeframe: | Daily | Daily |
| 20-Day SMA | 70% | 140 |
| 50-Day SMA | 30% | 60 |
| 100-Day SMA | 23% | 38 |
| 200-Day SMA | 10% | 23 |
| Average | 33% |
Why are Heikin Ashi’s SMA results better?
Why do Heikin Ashi charts perform slightly better with SMA and other indicators like Keltner Channels and Price Rate of Change? I believe it is because price averaging removes the extreme price highs and lows associated with traditional OHLC bars. This means fewer trades in consolidating markets and fewer small losses.
Professional traders may assume, as I did, that the Heikin Ashi chart distorts the pricing because it averages the OHLC of the candles. However, we can achieve realistic entry and exit criteria using TrendSpider’s HL2 setting, meaning the average price candle’s highs and lows. I proof-checked individual trades, and they were reasonable.
Combining SMA with Other Indicators
The SMA should be combined with other chart indicators, such as the Price Rate of Change or bullish chart patterns. For example, most indicators perform well when a stock is trending either up or down. However, when the price consolidates, SMA provides many false buy and sell signals, causing small losses in trading. Make sure not to trade this indicator during consolidating markets.
Should the SMA be used to Buy and Sell?
No, my research backtesting shows that the SMA is a poor indicator for identifying buy and sell signals. Using 960 years of data across 30 Dow Jones stocks, the SMA lost to a buy-and-hold strategy 88% of the time. This is a very poor indicator by a significant margin.
The Best Settings for SMA
SMA is a poor indicator, so the best setting is the least worst. If you must use this indicator, use a daily chart and adjust the setting to match the asset you are trading. The asset must move in strong trends, and any periods of price consolidation will end in many small losses.
Limitations of Using Simple Moving Averages
The biggest limitation of moving averages is they produce 80% of their losses in consolidating markets. Markets only have 2 phases: trending and consolidation. Moving averages should not be used when an asset’s price is consolidating.
Simple Moving Average vs. Exponential Moving Averages
Exponential moving averages (EMAs) are moving averages that give more weight to recent prices in the calculation. EMAs are considered more useful for predicting short-term prices than SMAs. For example, if you wanted to measure a stock’s intraday volatility, an EMA might be more appropriate than an SMA. Similarly, an EMA can be better if you want a short-term buy or sell signal.
It’s important to note that other moving averages, such as Hull and weighted moving averages, are available. Each type of average has different properties and can be used in combination.
Summary
Our 68,040 test trades demonstrate that using simple moving averages as buy-and-sell trading indicators is unwise. This indicator has only a 12% chance of beating a buy-and-hold strategy. You may also be interested in the incredible alligator indicator based on moving averages; with the optimal settings, it has proven highly profitable.
FAQ
Is the simple moving average the same as a moving average?
No, a simple moving is not the same as a moving average. There are four core moving averages; simple, exponential, weighted, and weighted exponential moving averages. The simple moving average is a subset of the moving average indicators.
Which is better, a simple or exponential moving average?
According to our 1,820 years of backtesting data on 30 stocks, the simple moving average (SMA) performs better than the exponential moving average (EMA). The SMA has a win rate of 12%, while the EMA win rate is 7%. Both indicators have incredibly poor success rates and should be avoided by traders.
How to read a simple moving average chart?
To read a simple moving average chart, observe when the price is above the moving average line; this signals an uptrend. Conversely, when the price is below the moving average, this could indicate a downtrend. Ensure you use moving averages only when the asset traded is in a strong trend. Otherwise, you may endure many small losses.
What is the best software for trading moving average indicators?
The best software for trading moving average indicators are TrendSpider, with 15 indicators and integrated point-and-click backtesting. TradingView also offers 10 moving average indicators and a global community of traders.
What is a period in a simple moving average?
The period in a simple moving average (SMA) is the number of data points used to calculate the SMA. If you use a 20-day SMA, you will be averaging out the last 20 days of price action. A longer period, such as a 200-day SMA, will calculate 200 periods on a daily chart.
Are daily and simple moving averages the same?
No, daily and simple moving averages are not the same. A simple moving average uses a chart timeframe in its calculation. If the chart is a daily chart, then the SMA-5 uses five periods of one day. But if you use a 5-minute chart, the SMA-10 calculates ten 5-minute periods.
Do traders use simple or exponential moving averages?
Beginner traders will use simple or exponential moving averages. But experienced traders who have performed their backtesting will avoid using these moving averages due to their poor performance in consolidating markets and low win rates of only 12%.
How to calculate a 10-month simple moving average?
To calculate a 10-month moving average, set your chart to monthly and select your simple moving average to be 10. Alternatively, on a daily chart, set the simple moving average period to 200. There are approximately 20 trading days per month, multiplied by 10 months.
How to calculate a 4-period simple moving average?
To calculate a 4-period simple moving average, add the closing price for a stock on the previous 4 trading periods, and divide it by 4. This will give you the 4-period moving average.
How to calculate a simple moving average in Excel?
To calculate a simple moving average in Excel, ensure you have the closing asset price in cells A1 to A5. Then in cell B5, add the formula =average(A1:A5).
Do moving averages really work?
No, according to our testing, simple moving averages work out very poorly for anyone trading them on a daily or even intraday 5-minute chart. Using SMA on a daily OHLC or Candlestick chart is a poor predictor of price trends and direction reversals, losing out to a buy-and-hold strategy 88% of the time.
How accurate is a simple moving average?
The simple moving average indicator is extremely inaccurate, especially with a standard OHLC, line, or candlestick chart. Our research indicates that an SMA has a 7 to 12 percent win rate. Although moving averages and MACD are marketed as good strategies, the rate of change indicator is more effective at 66 percent.
How to make money trading moving averages?
Our research demonstrates that making money using moving averages is incredibly difficult because this indicator generates many losses during market consolidations. The moving simple moving average win rate is 12%, while the exponential moving average is only 7%.
How to use moving averages with Crypto or Forex?
You can use moving averages with cryptocurrency or Forex trading, but our tests show the results are poor, with only a maximum success rate of 12%. Whether you choose stocks, crypto, or forex for trading, you must avoid the moving average strategy or perform testing to optimize the settings.
Is the simple moving average a good indicator?
No, our research shows that simple moving averages are not good indicators on any timeframes. We tested the 20, 50, 100, and 200-day moving averages, and all results were less than a 23% win rate.
What are better indicators than simple moving averages?
There are many better indicators than simple moving averages, such as the rate of change and chart patterns. Our testing has proven these indicators to be much more effective, work on many timeframes, and are more successful in trading strategies.
Is a simple moving average the best indicator?
No, the simple moving average is not the best indicator; it is one of the worst indicators in technical analysis. It has a low success rate and an average of 55% losing trades when trading the Dow Jones Industrial Average. If you want to be successful in trading, learn how to backtest trading strategies for yourself.
What is the best time frame for simple moving averages?
The best timeframe for a simple moving average strategy is a daily chart with a period of 20. We conducted time-based research and found that simple moving averages underperformed the market on all timeframes. However, the simple moving averages failure rate was slightly lower with a 20-period setting.
How reliable is a simple moving average?
Simple moving averages are an incredibly unreliable technical analysis chart indicator. Our 960 years of backtested data on 30 major US stocks show a 12% chance of beating a buy-and-hold strategy on a daily candlestick chart and a 33% chance on a Heikin Ashi chart. Testing confirms it is an unreliable indicator and should be avoided.
What is the best software for trading and testing moving averages?
Our rigorous analysis of moving average trading was executed utilizing TrendSpider, a leading trading software for backtesting and strategy development, in my professional opinion.