The Hull Moving Average (HMA) is a highly responsive technical analysis indicator designed to reduce lag.
I tested 30 Dow Jones stocks and 4 HMA settings over 8 years, equalling 960 years of data, to analyze success rates in pursuit of an answer.
My research reveals it outperforms other moving averages. The Hull moving average is considered an improvement over other moving averages, and according to our testing, it performs marginally better.
KEY TAKEAWAYS
- The Hull moving average performs better than simple, exponential, and weighted moving averages.
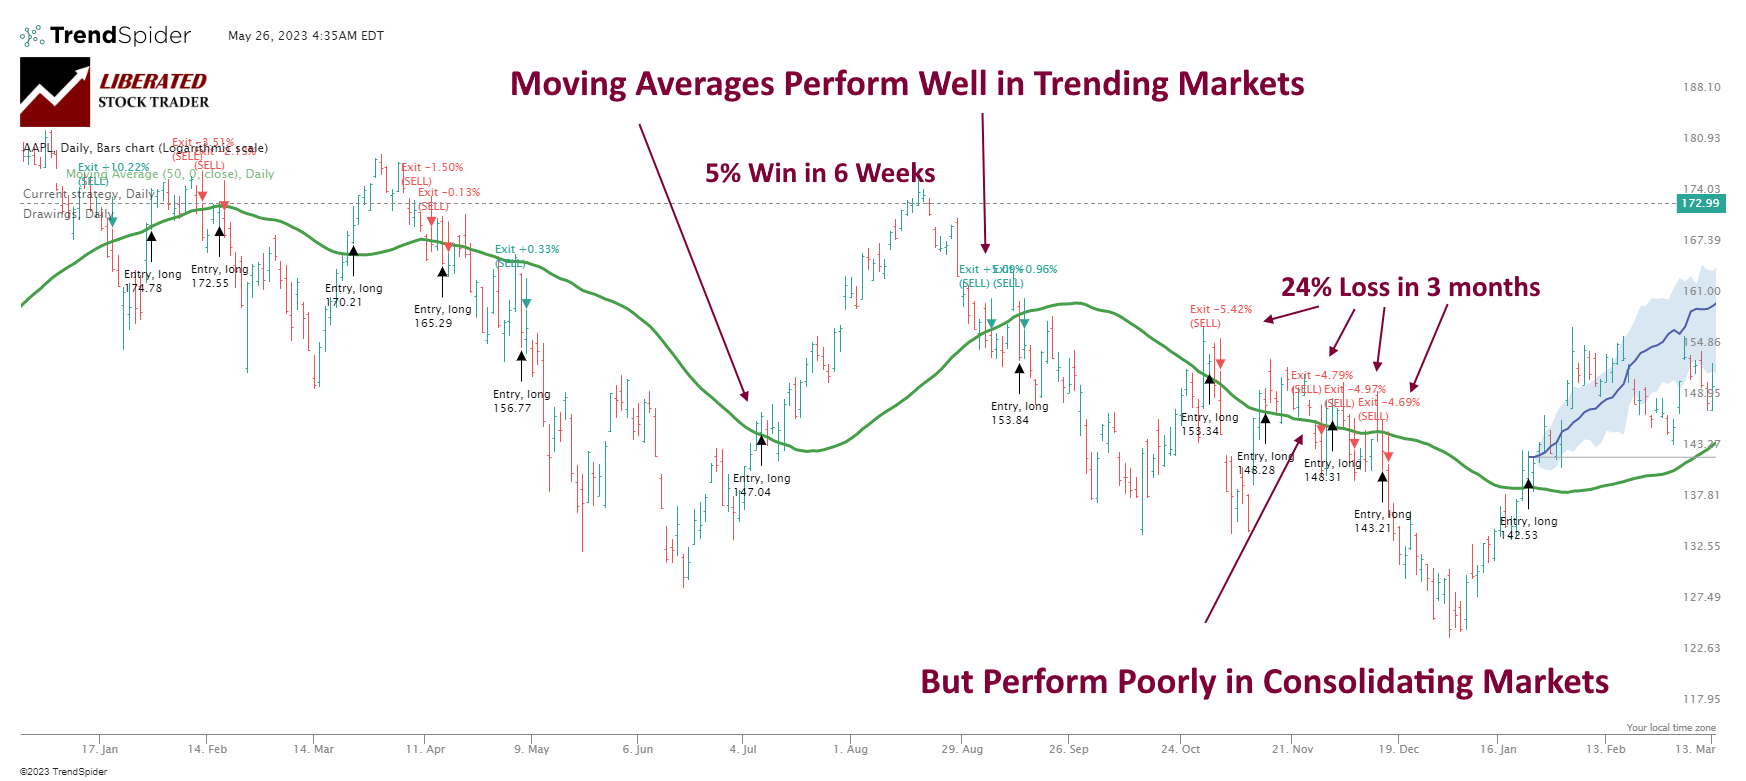
- HMA works well on strongly trending markets and equities.
- HMA tends to underperform in range-bound markets.
- Traders should use longer HMAs to identify the overall trend and shorter HMAs for more short-term price movements.
A Hull moving average (HMA) assigns different weights to each data point within the period. The most recent data points are given more weight than earlier ones, which reduces noise and increases the average’s sensitivity to short-term price movements.
What is the Hull Moving Average?
The Hull Moving Average (HMA) is a sophisticated moving average indicator that provides superior responsiveness to price fluctuations. The HMA achieves this by integrating the Weighted Moving Average (WMA) and the square root of the period, delivering a mix of reduced lag and smooth trend lines.
HMA was developed by Alan Hull, a financial analyst and trader. The HMA attempts to reduce the lag associated with traditional moving averages by weighting prices differently over time. This results in a more responsive indicator that adjusts to the current market faster.
It also has advantages over other indicators, such as filtering out more false signals and providing clearer trading signals. The HMA can be used as a standalone indicator or in combination with other indicators, such as the MACD or RSI. Thanks to its flexibility, the HMA can be used in various trading strategies, from short-term scalping to long-term trend-following techniques. It’s a great tool for any trader who wants to stay ahead of the market.
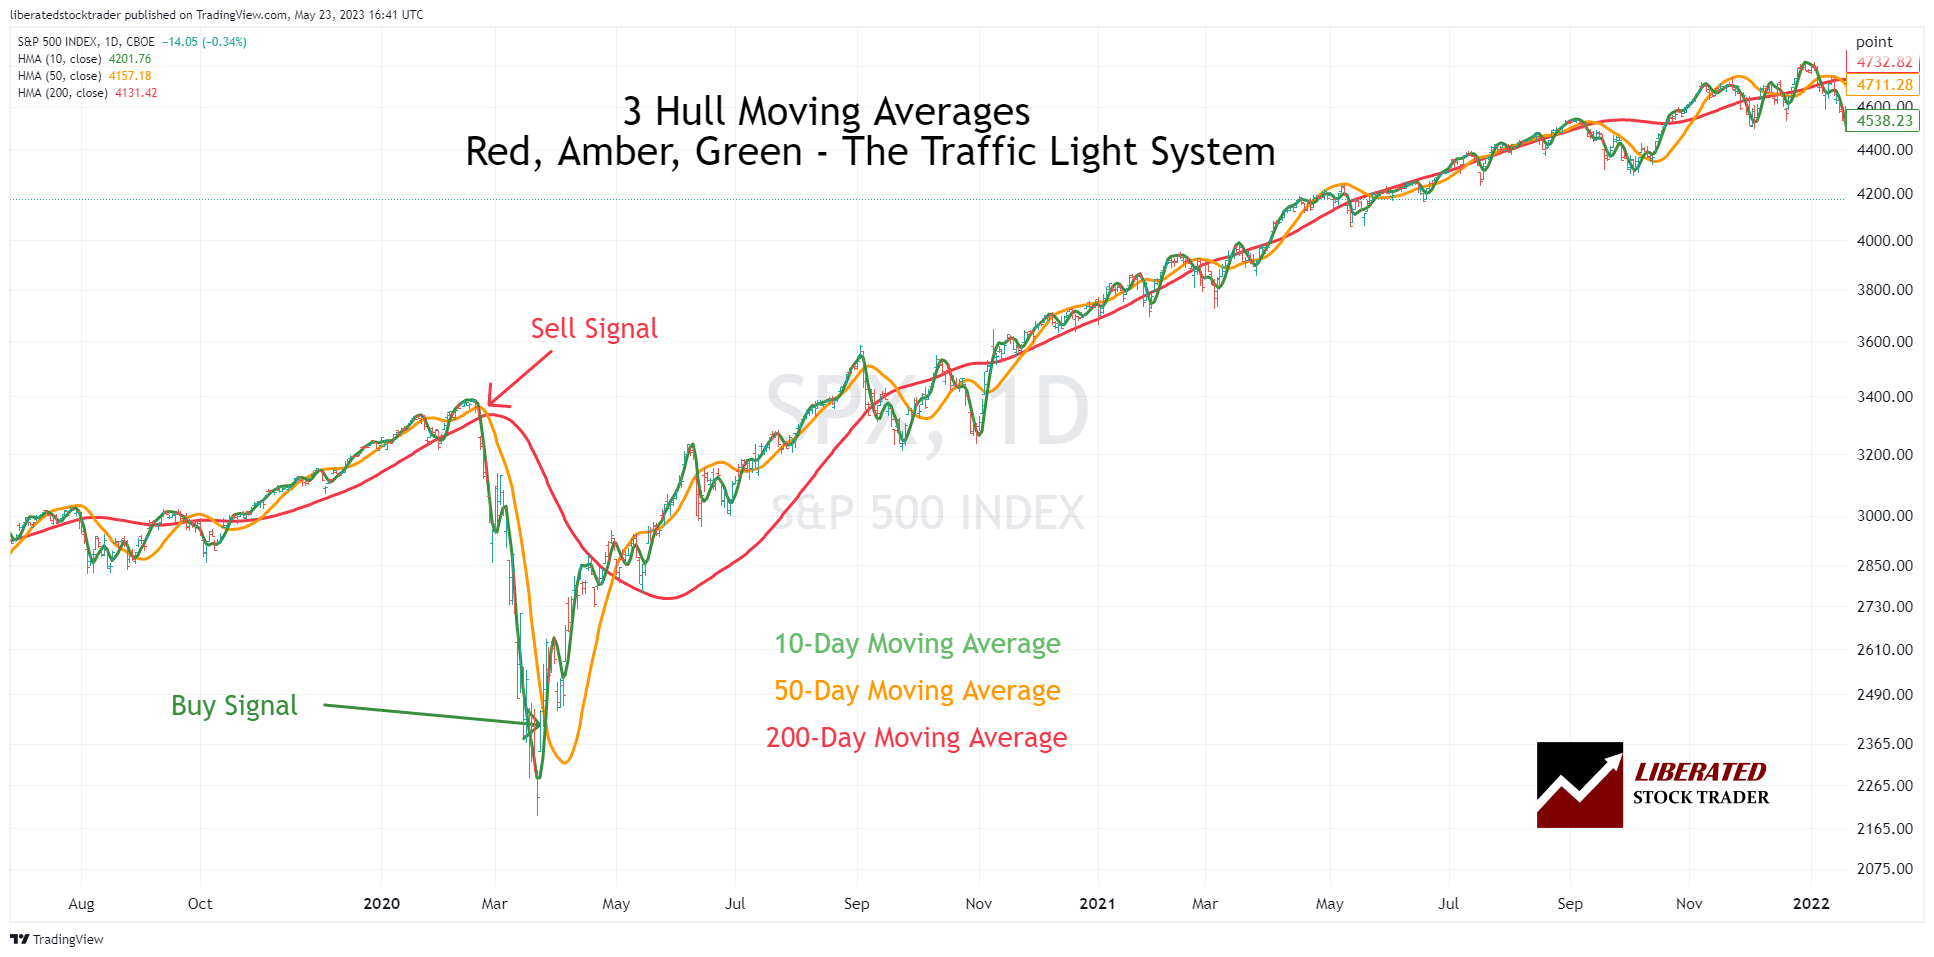
Example Chart: Hull Moving Averages
This chart shows the Hull moving average traffic light system. Three moving averages are plotted on the chart: the 10-period HMA in green, the 50-period HMA in amber, and the 100-period HMA in red.
How does it work?
The Hull moving average is a weighted moving average that gives more weight to recent prices and less to older prices. This creates a smoother line than other moving averages, eliminating the lag associated with traditional moving averages.
The HMA formula adjusts the weights based on the current market conditions, making it better suited for volatile markets. It also reduces whipsaws or false signals generated by other moving averages. The formula is more complex than a simple moving average, but the results make it worthwhile. The HMA can be used as an independent indicator or combined with other indicators to create a trading strategy.
TrendSpider 4.8/5⭐: My Pick for AI-Power & Auto-Trading
I’ve used TrendSpider for 7 years for my research and testing. It auto-detects trendlines, patterns, and candlesticks, backtests ideas, and lets you use AI to create unique strategies and launch trading bots—with no code.

Save 38% to 45% on TrendSpider
Our Top Rated 4.72 ⭐ Trading Tool
✅ Leader in AI Trading & Chart Pattern Recognition
✅ Scanning & Auto-Trading
Deal Ends In:
How to calculate a Hull moving average?
The HMA is calculated by finding the sum of the square roots of several price periods and dividing it by an exponential smoothing factor. This allows the HMA to quickly adjust to new market conditions, making it ideal for trend-following strategies.
The Hull moving average formula:
The HMA is calculated using the following formula:
HMA = WMA(2 * WMA(n/2) – WMA (n))
“WMA” stands for Weighted Moving Average, and “n” represents the number of data points used to calculate the average. The Hull Moving Average combines weighted moving averages (WMA), discounting older data and increasing the weighting of newer data. It incorporates both short-term and long-term data to produce a smoother curve than either of those two indicators alone.
The HMA helps traders identify potential entry and exit points more quickly and provides support/resistance levels. It can also be used to identify trends and trend reversals. Another advantage of the HMA is that it generates fewer false signals than other indicators, such as the MACD or RSI.
How to trade a Hull moving average
Trading the Hull Moving Average is similar to trading other moving averages. Look for price crossing up through the HMA line, or use multiple HMA lines and observe the crossovers to generate buy and sell signals.
Using TrendSpider to Perfect a Trading Strategy
This emphasizes the most recent prices and gives them more influence over the outcome. Whatever approach is used, traders should always know how their chosen weights will affect their moving average calculations. Furthermore, choosing an appropriate range for the formula is also important, as the range should match the trader’s investing time horizon.
For instance, a long-term investor might use a 200-day moving average, while a short-term scalper may only look at prices over the last five days. Finally, some traders will choose to use multiple moving averages with different ranges to identify strong market trends.
Pros
The Hull Moving Average offers traders a few advantages. First, the formula’s extra weighting of recent prices makes it more responsive to current market action than simple moving averages. This can be a big advantage during strong trends as the HMA will adjust its levels much faster than other formulas. Additionally, the formula is well-suited for short-term and intraday traders who need to identify changes in direction quickly. Finally, most charting software packages already have the calculations built in, so there’s no need for complicated formulas or manual calculations.
Cons
The main disadvantage of using the Hull moving average is its poor performance on OHLC and candlestick charts. Our research exposes the risks of using this indicator in trading strategies, especially during market consolidation. One major drawback of using moving averages is that they tend to underperform during market or stock price consolidation periods, which can translate to negative returns.
With only a 17% win rate, using the Hull moving average for trading is not advised due to its poor performance in consolidating markets.
HMA Backtesting Performed With TrendSpider
However, one of the potential limitations of HMA is its disregard for short-term volatility. Although price movements can fluctuate significantly in the near term, a long-term averaging technique such as the 200-day HMA may not fully capture these swings. Thus, relying solely on HMA for trading may overlook critical short-term buying and selling opportunities. Additionally, HMA is still a lagging indicator and only confirms trends after they have begun. As such, investors must pair HMA with other indicators to stay ahead of the markets.
Is the Hull Moving Average Indicator Accurate?
No, the Hull moving average indicator is inaccurate, averaging only a 17% win rate. The HMA causes many small losses when asset prices consolidate. Backtesting the HMA indicator on 30 Dow Jones Industrial Average stocks over 8 years resulted in an average 17% win rate, meaning it underperformed a buy-and-hold strategy 83% of the time.
Hull Backtesting & Results
To backtest the HMA indicator, I used TrendSpider, the leading AI stock trading software with pattern recognition and a codeless backtesting engine. Testing was configured using OHLC with an exit on the next open. The Heikin Ashi daily chart used the exit criteria for the next trading day, HL2 (Price High + Low /2).
| Testing Criteria | Daily OHLC Chart | Daily Heikin Ashi Chart |
| Index: | DJIA | DJIA |
| Date Range | 8 Years/2000 Candles | 8 Years/2000 Candles |
| Settings: | 20, 50, 100, 200 | 20, 50, 100, 200 |
| Entry Criteria: | Price > HMA 20 | Price > HMA 20 |
| Exit Criteria: | Price < HMA 20 | Price < HMA 20 |
| Sell: | Next Open | High+Low/2 |
I test all indicators, including the HMA, on their standard recommended settings, on different timeframes, and using different chart types; this provides an unbiased result. Also, the entry and exit prices use an average of the high and low prices for the day, making the testing more realistic.
How I Set Up Hull Backtesting in TrendSpider
To set up HMA backtesting in TrendSpider, follow these steps:
- Register for TrendSpider.
- Select Strategy Tester > Entry Condition > Add Script > Add Parameter > Condition > Price > Greater Than > HMA.
- For the Sell Criteria, select > Add Script > Add Parameter > Condition > Price > Less Than > Hull Moving Average.
- Finally, click “RUN.”
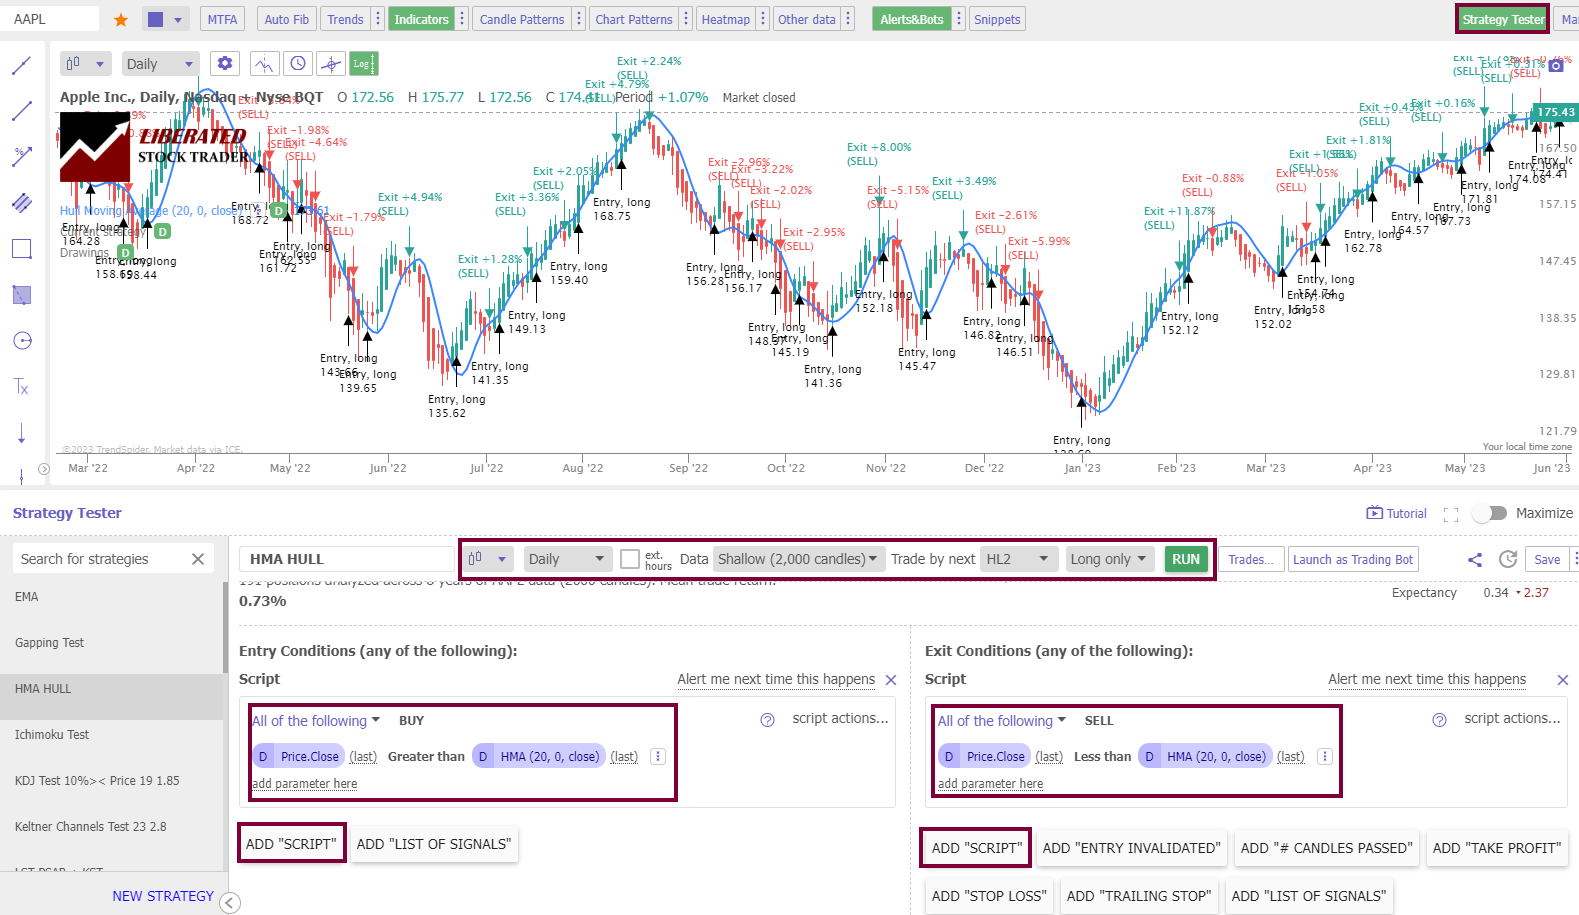
To set up backtesting, I used TrendSpider, our recommended trading software for serious traders. The screenshot below shows the exact configuration for our HMA backtesting.
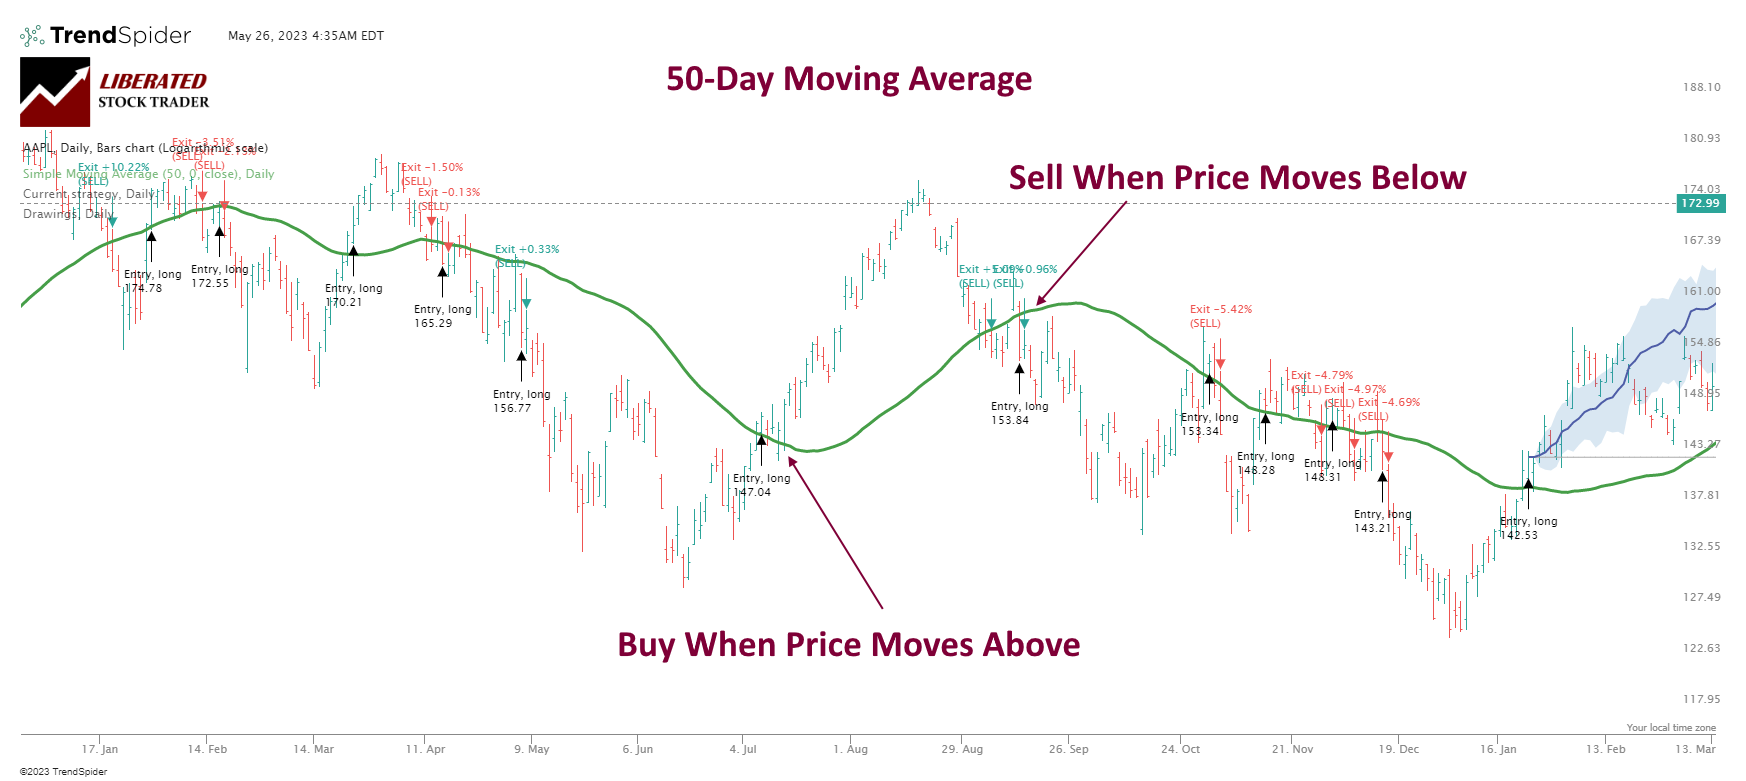
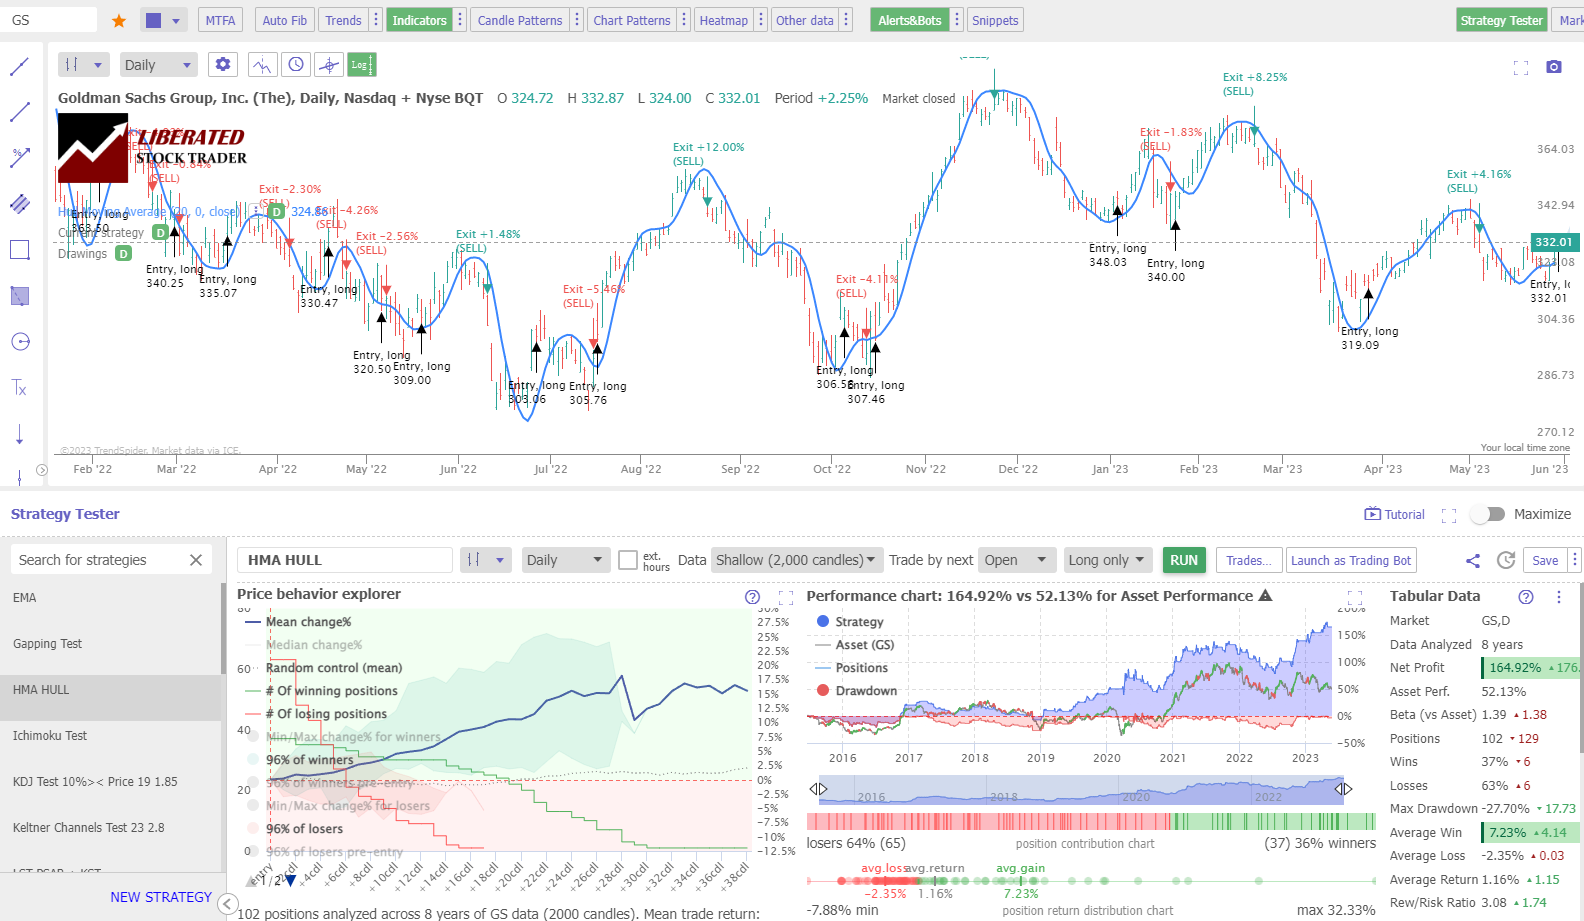
Testing Hull on OHLC Charts
This is an example of a 20-day Hull moving average on an OHLC chart. Over 8 years, a trader using the 50-day Hull moving average on Goldman Sachs. (Ticker: GS) would make 164%, but a buy-and-hold investor would have only made 52%. This is a positive example, but the average result of an 83% failure rate for the Hull moving average on OHLC charts means it is a poor choice for trading.
Testing Performed With TrendSpider – The Best Software for Traders
Testing the standard HMA settings on a daily candlestick/OHLC chart proves this indicator is poor, with a 17% chance of outperforming a buy-and-hold strategy on all tested timeframes.
Backtesting Results for Daily OHLC Charts
Testing 960 years of data shows the average win rate for Hull moving averages is 7%. The table below shows that the HMA 100 has a 10% chance of beating a buy-and-hold strategy, and the 200-day HMA only has a 7% chance of success.
| Testing Criteria | Daily OHLC Chart | Daily Heikin Ashi Chart |
| Index: | DJIA | DJIA |
| Date Range | 8 Years/2000 Candles | 8 Years/2000 Candles |
| Settings: | 20, 50, 100, 200 | 20, 50, 100, 200 |
| Entry Criteria: | Price > HMA 20 | Price > HMA 20 |
| Exit Criteria: | Price < HMA 20 | Price < HMA 20 |
| Sell: | Next Open | High+Low/2 |
I tried many backtesting solutions, but this testing was only possible using TrendSpider.
Powerful Point & Click Backtesting With TrendSpider
Testing Hull on Heikin Ashi Charts
The Hull moving average performs considerably better on a Heikin Ashi chart. If a trader used the 20-day Hull moving average on Amgen Inc. (Ticker. AMGN) over 8 years, they would have made a 127% profit beating a buy-and-hold strategy profit of 37%.
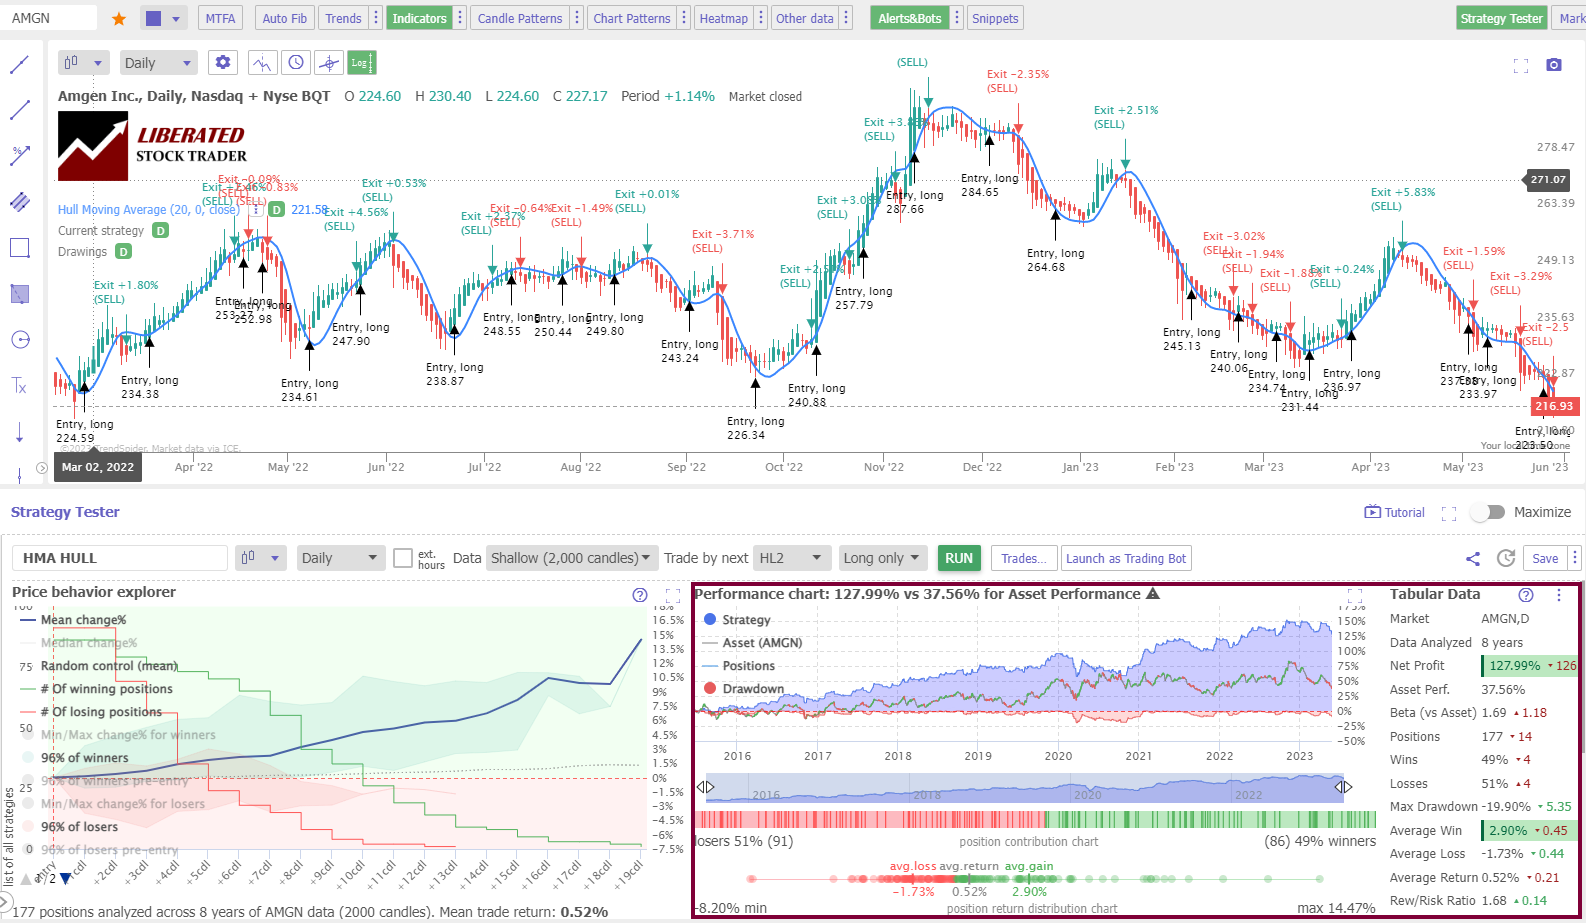
The table below shows that using the advantages of Heikin Ashi charting, the Hull moving average indicator becomes a winning strategy, especially the Hull moving average 50, which has a win rate of 77%.
Hull Backtesting Results for Heikin Ashi Charts
Testing 960 years of data shows the average win rate for Hull moving averages on a Heikin Ashi chart is 61%. This means 39% of stocks traded using this strategy will fail to beat a buy-and-hold strategy. The 50-period HMA performed better than all other moving averages we tested, with a 77% success rate.
| 8-Year Backtest Heikin Ashi Chart | % Win Rate | # Trades |
| Timeframe: | Daily | Daily |
| 20-Day HMA | 63% | 174 |
| 50-Day HMA | 77% | 102 |
| 100-Day HMA | 63% | 78 |
| 200-Day HMA | 40% | 33 |
| Average | 61% |
Powerful Point & Click Backtesting With TrendSpider
Why are Heikin Ashi’s Hull results better?
Why do Heikin Ashi charts perform slightly better with HMA and other indicators like Keltner Channels and Price Rate of Change? I believe it is because price averaging removes the extreme price highs and lows associated with traditional OHLC bars. This means fewer trades in consolidating markets and fewer small losses.
Professional traders may assume, as I did, that the Heikin Ashi chart distorts the pricing because it averages the OHLC of the candles. But we can achieve realistic entry and exit criteria by using TrendSpider’s HL2 setting, meaning the average of the price candle high and low. I proof-checked individual trades, which were reasonable but not entirely realistic.
Combining Hull with Other Indicators
This indicator can be combined with other technical indicators to build a complete trading strategy. For example, using MACD, Moving Averages, Heikin Ashi charts, Price Rate of Change, Aroon, or even bullish chart patterns.
To test whether combining HMA with other indicators is profitable, I suggest using TrendSpider, our recommended stock research, and AI-powered trading software.
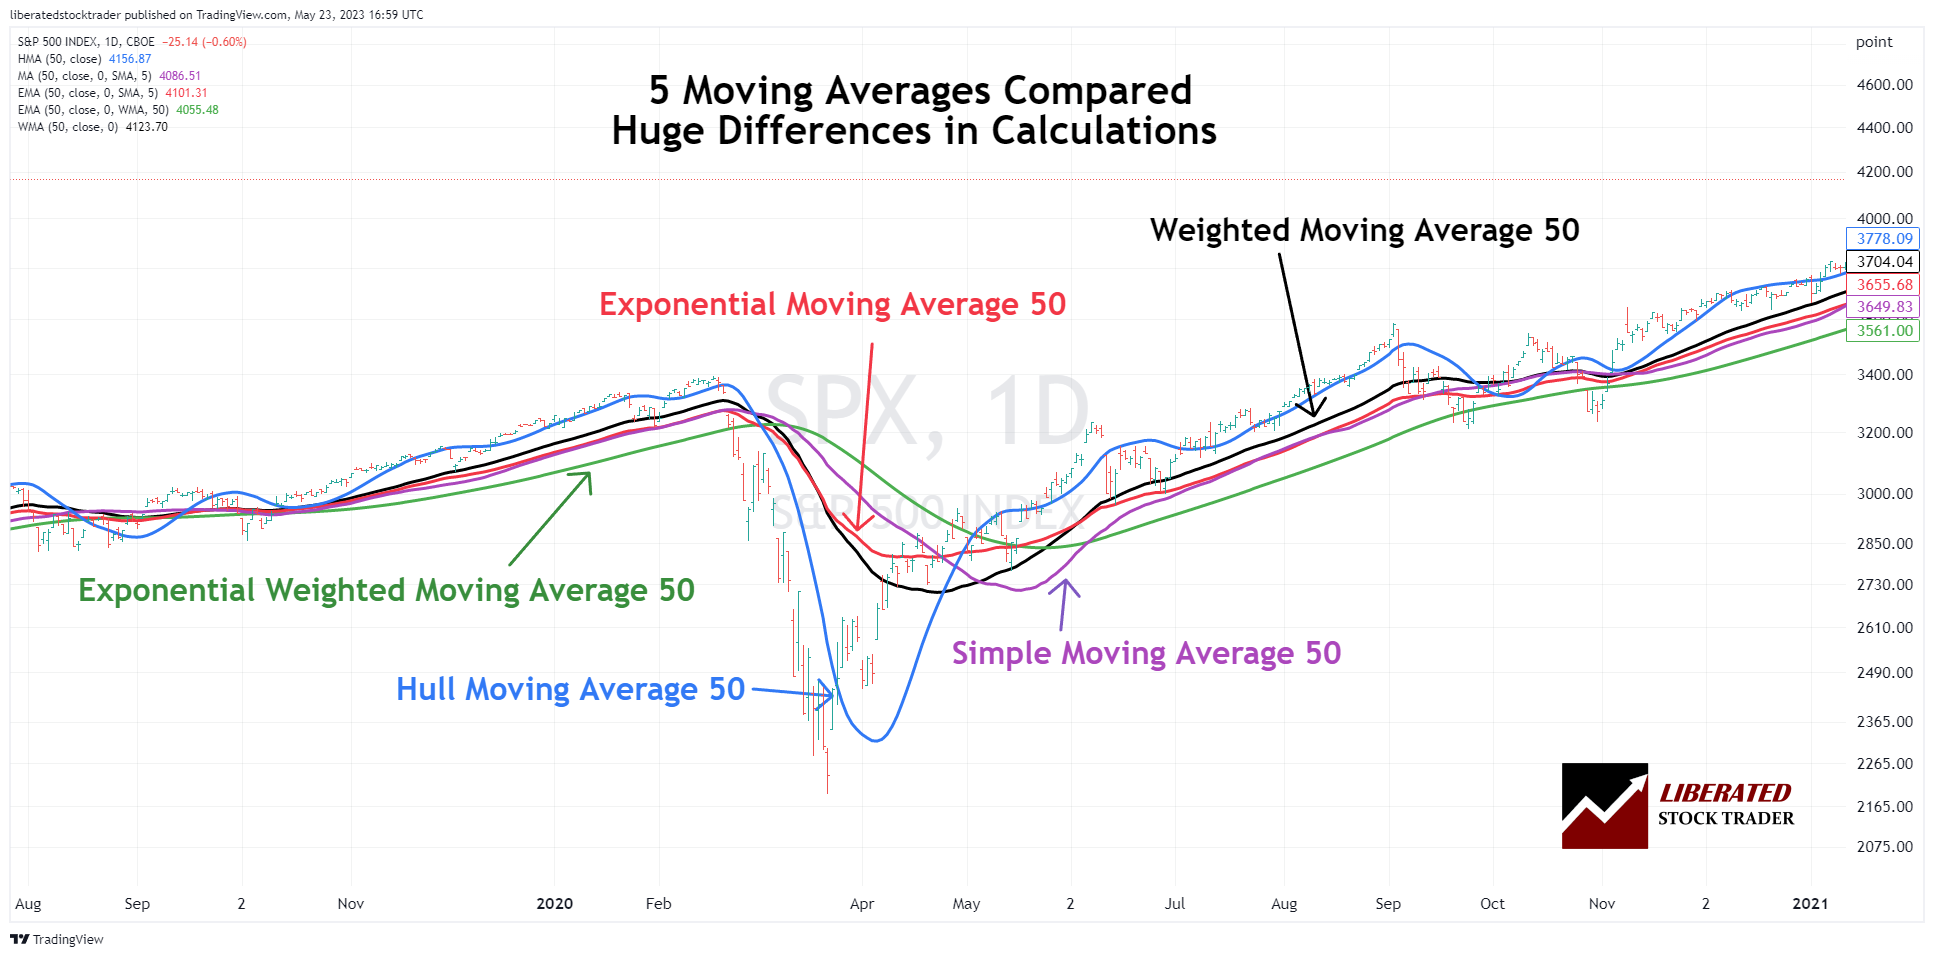
Hull Moving Average vs. Simple, Exponential, and Weighted
This chart shows how the 50-period Hull moving average reacts much quicker to price changes than other moving averages. Based on our testing, the Hull moving average is the best moving average indicator, but it should only be used with Heikin Ashi charts, as the performance on OHLC charts is still below par.
Can the HMA be used for Buy and Sell Signals?
Our research backtesting shows that the 50-period Hull moving average on a Heikin Ashi chart is a good indicator for identifying buy and sell signals. Over 960 years of data across 30 Dow Jones stocks, the 20, 50, 100, and 200-period Hull moving average on candlestick charts lost to a buy-and-hold strategy 83% of the time. This is a very poor indicator by a significant margin.
The Best Settings for HMA
Our research shows the best setting for the HMA indicator is a 50-day period on a Heikin Ashi chart. This is the only setting outperforming a buy-and-hold strategy with a 77% win rate. All other settings on OHLC charts and timeframe produce losses and a failure rate of 83%.
Although HMA isn’t the most reliable indicator, the optimal solution is to choose the least bad option. If it is necessary to use this indicator, it is recommended to set it according to period 50 and utilize a daily Heikin Ashi chart.
This indicator is most effective when the asset moves in strong trends. Whenever the asset goes through a period of price consolidation, many small losses will likely be incurred.
Hull Moving Average Limitations
The biggest limitation of Hull moving averages is they produce 68% of their losses in consolidating markets. Markets only have two phases: trending and consolidation. Moving averages should not be used when an asset’s price is consolidating.
Summary
After testing for 960 years, it’s safe to say that using Hull moving averages as trading indicators for buying and selling is a losing strategy unless you use a Heikin Ashi chart. Avoid trading candlesticks, as you only have a 17% chance of outperforming a buy-and-hold strategy.
FAQ
Is the Hull moving average a good indicator?
No, our research shows that Hull moving averages are not good indicators on any timeframes on OHLC charts. We tested the 20, 50, 100, and 200-day moving averages, and all results were a 17% win rate.
What is the best setting for a Hull moving average?
Our testing shows that the best setting for Hull moving averages is 50-period on a Heikin Ashi chart, which yields a 77% win rate. A Hull moving average on OHLC or candlestick charts is not recommended as the best setting of 50-period has only a 27% success rate.
What are better indicators than Hull moving averages?
There are many better indicators than Hull moving averages, such as the rate of change and chart patterns. Our testing has proven these indicators to be much more effective, work on many timeframes, and are more successful in trading strategies.
Is a Hull moving average the best indicator?
No, the Hull moving average is not the best indicator; it is a weak indicator in technical analysis. It generates 58 percent losing trades when trading the DJ Industrial Average. For trading success, I recommend learning how to backtest and tune trading strategies.
What is the best time frame for Hull moving averages?
The best timeframe for a Hull moving average strategy is a daily Heikin Ashi chart with a period of 50, which yields a 77 percent win rate, according to our research. We conducted time-based research and found that Hull moving averages underperformed the market on all timeframes on all candlestick charts.
How reliable is a Hull moving average?
Hull moving averages are an unreliable technical analysis chart indicator. Our 960 years of backtested data on 30 major US stocks show a 17% chance of beating a buy-and-hold strategy on a daily OHLC chart. Results were better using a Heikin Ashi chart, as the 50-period Hull moving average has an 77% reliability.
What is the best software for trading and testing Hull moving averages?
After carrying out a thorough analysis of Hull moving average trading, we utilized TrendSpider, a premier trading tool for backtesting and strategy development. As a professional, in my opinion, it proved invaluable.
Which is better, a Hull or a simple moving average?
Based on 1,820 years of backtesting data on 30 stocks, our research indicates that the Hull moving average outperforms the simple moving average with a 17% win rate as compared to the SMAs 12%. Both indicators have poor success rates and are not recommended for traders.
How to read a Hull moving average chart?
To read a Hull moving average chart, observe that a price above the moving average line signals an uptrend; below the line could indicate a downtrend. Only use moving averages when the asset is in a strong trend to avoid multiple small losses.
What is the best software for trading Hull moving average indicators?
TrendSpider is hands-down the top software for trading and backtesting Hull moving average indicators, with 15 indicators and integrated point-and-click backtesting; you can see why it's a game-changer! TradingView is also good, offering 10 moving average indicators and a global exchange, crypto, and forex coverage.
Is the Hull moving average the same as a moving average?
No, a Hull moving average is not the same as a moving average. There are four main moving averages; simple, exponential, weighted, and Hull moving averages. The Hull moving average is a subset of the moving average indicators with a different, more responsive calculation.
Do Hull moving averages really work?
No, according to our testing, Hull moving averages work out very poorly for anyone trading them on a daily OHLC chart. Using Hull moving average on candlestick charts is a poor predictor of price trends and direction reversals, losing out to a buy-and-hold strategy 83% of the time.
How accurate is a Hull moving average?
The Hull moving average indicator is highly inaccurate, especially with a standard OHLC, line, or candlestick chart. Our research indicates that a Hull moving average has a 10 to 27 percent win rate. Although moving averages and MACD are marketed as good strategies, the rate of change indicator is more effective at 66 percent.
How to make money trading Hull moving averages?
Our research demonstrates that making money using Hull moving averages is unlikely because this indicator generates many losses during market consolidations. The simple moving average win rate is 12%, while the Hull moving average is 17%.
How to use Hull moving averages with Crypto or Forex?
You can use Hull moving averages with cryptocurrency or Forex trading, but our tests show the results are poor, with only a maximum success rate of 27% on a 50-period setting. Whether you choose stocks, crypto, or forex for trading, you must avoid the Hull moving average strategy.
What is a period in a Hull moving average?
The period in a Hull moving average is the number of data points used for calculation. If you use a 20-day Hull moving average, you will be averaging out the last 20 days of price action. A longer period, such as a 200-day Hull moving average, will calculate 200 periods on a daily chart.
Are daily and Hull moving averages the same?
No, daily and Hull moving averages are not the same. A Hull moving average uses a chart timeframe in its calculation. If the chart is a daily chart, then the Hull moving average-5 uses five periods of one day. But if you use a 5-minute chart, the Hull moving average-10 calculates ten 5-minute periods.
Do traders use simple or Hull moving averages?
Beginner traders will use simple or exponential moving averages. But experienced traders who have performed their backtesting will avoid using these moving averages due to their poor performance in consolidating markets and low win rates of only 17%.
How to calculate a 10-month Hull moving average?
To calculate a 10-month Hull moving average, set your chart to monthly and select your Hull moving average to be 10. Alternatively, on a daily chart, set the Hull moving average period to 200. There are approximately 20 trading days per month, multiplied by 10 months.