Our testing shows the Know Sure Thing (KST) Oscillator is a reliable technical analysis indicator for interpreting market momentum and issuing buy and sell signals.
KST aggregates multiple rate-of-change calculations, providing a smoothed view of price trends while filtering out market noise.
My research on 2,746 test trades spanning 10 years confirms that using the KST indicator’s default settings on daily and weekly charts provides profitable and reliable signals for traders.
By combining four timeframes, the KST effectively highlights the market’s prevailing directional bias.
Key Takeaways
- The KST Oscillator aggregates multiple rate-of-change calculations.
- Traders use the KST to identify market momentum and potential signals.
- The KST has a higher reward/risk ratio on weekly and daily charts.
- KST is an effective indication that it is worth using in a trading system.
Using the KST Oscillator’s fundamentals, traders can more accurately gauge the strength and direction of market trends. This indicator can be particularly useful in identifying potential buy and sell signals, aiding in the development of robust trading strategies. Given its composite nature, the KST Oscillator stands out among other momentum indicators, making it a go-to for many investors.
The KST Oscillator
The KST is a composite indicator that combines four different time frames to provide a clearer picture of price momentum and identify buy and sell signals.
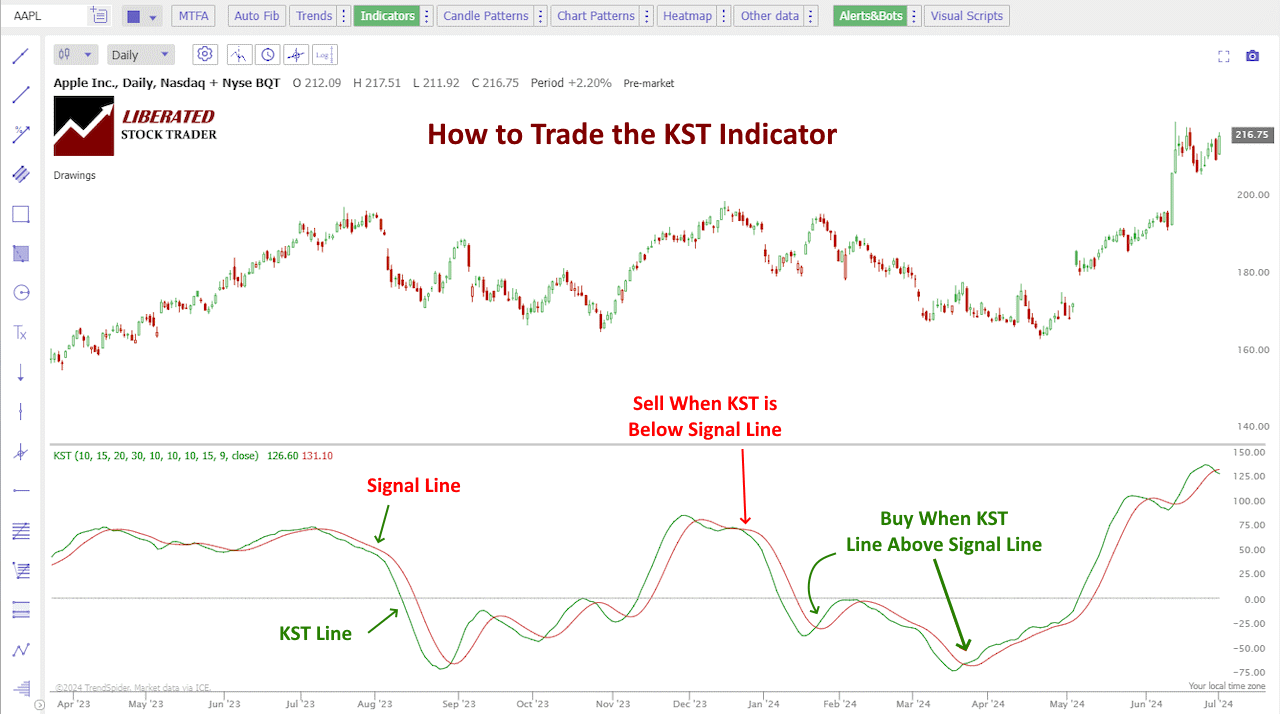
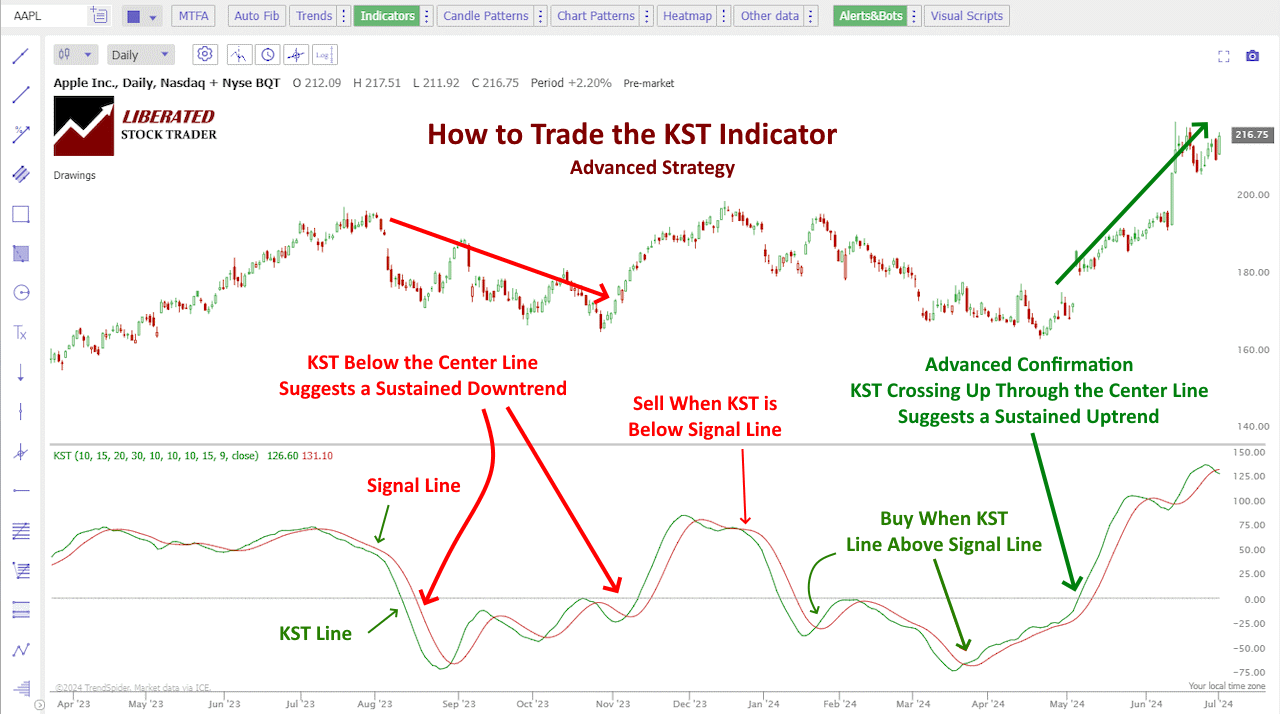
Traders utilize the KST oscillator by observing the relationship between the Green KST Line and the Signal Line. When the Green KST Line is above the Signal Line, it is a signal to buy, indicating a bullish trend. Conversely, when the Green KST Line falls below the Signal Line, it is a signal to sell, suggesting a bearish trend. By understanding the fundamentals of the KST oscillator and incorporating it into their trading systems, traders can make more informed decisions and improve their overall trading performance.
Background
The KST (Know Sure Thing) oscillator was created by Martin Pring, a renowned technical analyst, to help traders identify a market’s overall trend. It is based on the idea that consistent positive or negative momentum is necessary for a sustainable uptrend or downtrend.
Pring rightly believed that traditional indicators such as moving averages and MACD were not sufficient to capture these shifts in momentum and create reliable buy-and-sell signals. He wanted to develop an indicator that would track four different time frames simultaneously and provide a clearer picture of market trends.
Calculation
The KST combines four different rate of change (ROC) calculations, each smoothed with a moving average. This aggregation provides a clearer picture of market momentum compared to using a single ROC value.
Key components:
- Rate of Change (ROC) calculations
- Moving averages for smoothing
- KST line and signal line for overall trend assessment
This systematic approach makes the KST Indicator a reliable tool for detecting market shifts and making informed trade decisions.
Formula
The KST Oscillator’s formula blends four different ROC values, each smoothed using a moving average. The formula is:
[KST = (RCMA1 * 1) + (RCMA2 * 2) + (RCMA3 * 3) + (RCMA4 * 4)]
RCMA denotes the rate of change moving average for different periods.
- Where:
- RCMA1 = ROC (10-period) smoothed by a 10-period moving average
- RCMA2 = ROC (15-period) smoothed by a 10-period moving average
- RCMA3 = ROC (20-period) smoothed by a 10-period moving average
- RCMA4 = ROC (30-period) smoothed by a 15-period moving average
Each ROC is then placed in the formula to compute the final KST value, revealing the consolidated momentum trend.
Importance of the Signal Line
The signal line in the KST Oscillator is crucial for trade confirmations. It is a moving average of the KST value itself. When the KST crosses above the signal line, it often signals a buying opportunity. Conversely, the crossing below suggests a sell signal.
Functions:
- Buy Signals: KST crossing above the signal line
- Sell Signals: KST crossing below the signal line
By filtering out false signals, the signal line enhances the accuracy of trading decisions, giving traders a clearer and more reliable trend indication.
My thorough testing awarded TradingView a stellar 4.8 stars!
With powerful stock chart analysis, pattern recognition, screening, backtesting, and a 20+ million user community, it’s a game-changer for traders.

Whether you're trading in the US or internationally, TradingView is my top pick for its unmatched features and ease of use.
Explore TradingView – Your Gateway to Smarter Trading!
How to Trade KST Signals
KST Oscillator is an essential tool for understanding market trends. Its signals help investors make informed decisions by pinpointing entry and exit points through specific patterns.
Zero Line and Center Line Crossovers
Zero-line and center-line crossovers are crucial for identifying significant market movements. When the KST Oscillator crosses above the zero line, it generates a bullish signal, suggesting a potential upward trend. Conversely, a bearish signal arises when the KST crosses below the zero line, indicating potential downward momentum.
Traders also monitor the movement around the center line. A center-line crossover indicates the shift from positive to negative momentum or vice versa, providing a clear signal for action.
Divergences and Convergences
Divergences and convergences between the KST Oscillator and the price action indicate potential turning points in the market. A bullish divergence occurs when the price makes a new low, but the KST makes a higher low, suggesting potential upward momentum. This pattern alerts traders to possible buy opportunities.
On the other hand, a bearish divergence happens when the price makes a new high, but the KST makes a lower high, indicating potential downward pressure. Convergences, when the price movement aligns with KST, often reinforce the current trend’s strength, confirming the trend’s continuation.
Overbought and Oversold Conditions
The KST Oscillator also helps identify overbought and oversold conditions. When the KST reaches an extremely high value, the market is considered overbought, signaling a potential bearish signal for a price correction or reversal.
Conversely, when the KST drops to an extreme low, it indicates an oversold market, suggesting a bullish signal for a potential rise in prices. These conditions guide traders in identifying possible reversal points, aiding in timing market entry and exit.
Understanding these key signals helps investors utilize the KST Oscillator effectively, supporting more strategic decision-making.
Trading Strategies
The KST Oscillator, known for its ability to identify momentum shifts, plays a crucial role in various trading strategies. Its implementation aids in determining optimal entry and exit points and identifying support and resistance levels, enabling traders to make informed decisions.
Entry and Exit Points
Traders often use the KST Oscillator to pinpoint the best times to enter and exit trades. When the KST line crosses above the signal line, it indicates a buy signal. Conversely, a crossing below suggests a sell signal.
This indicator reflects momentum changes, assisting traders in capitalizing on trends early. For those using technical indicators like the KST, combining it with candlestick patterns can improve precision in timing trades. Monitoring these crossover points is crucial for catching significant price movements effectively.
Applying the KST Oscillator alongside moving averages or other momentum indicators further enhances its accuracy. This layered approach provides confirmation and reduces the risk of false signals. By focusing on these criteria, traders can optimize their strategies for better performance.
Support and Resistance Levels
Identifying support and resistance levels is vital for managing risk and maximizing profitability. The KST Oscillator aids in this by highlighting potential overbought and oversold conditions. When the oscillator enters these zones, it can signal possible price reversals.
Traders use these insights to set appropriate entry and exit points. For instance, if the KST suggests an oversold condition, it may indicate a support level, implying a potential buy opportunity. Conversely, an overbought signal can mark a resistance level, suggesting a sell signal or short position.
Using the KST alongside other indicators, such as RSI or Bollinger Bands, enriches the analysis. This combination helps traders identify robust support and resistance zones, enhancing the effectiveness of their trading decisions. This structured approach aids in better capitalizing on market movements.
How to Trade It
The basic trading strategy for KST initiates a buy signal when the KST line is above the signal line and a sell signal when the KST is below the signal line.
The advanced KST strategy initiates a buy signal when the KST line is above the signal line and both lines are above the 0 line. Additionally, a sell signal is when KST is below the signal line, and both lines are below the 0 lines.
In the next section, I test both the basic and advanced strategies to see which performs better.
How to Backtest the KST Indicator Basic Strategy
I tested both the Basic and Advanced KST trading systems with the following criteria.
- Tickers MSFT, GOOG, NVDA, META, AAPL
- Timeframes: Weekly, Daily, 60 Min, 5 Min, and 1 Min.
- 10-Year Backtest or 3,000 bars.
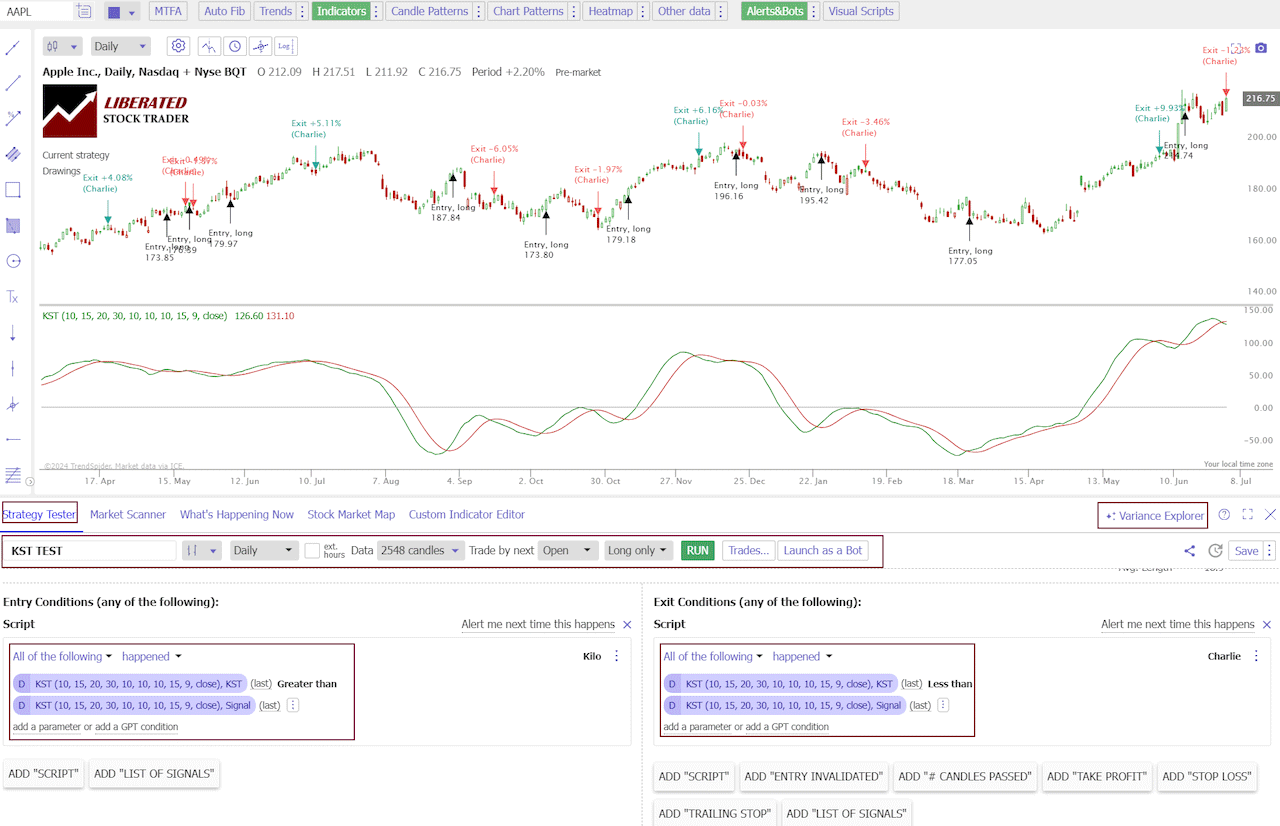
To set up a KST Basic backtesting strategy in TrendSpider, follow these steps:
- Register for TrendSpider
- Select Strategy Tester > Entry Condition > Add Parameter > Condition > Indicator > KST > Greater Than > Signal.
- For the Sell Criteria, select > Add Script > Add Parameter > Condition > Indicator > KST > Greater Than > Signal.
- Finally, click “RUN.”
Example KST Basic Test Apple Inc. (Ticker: AAPL)
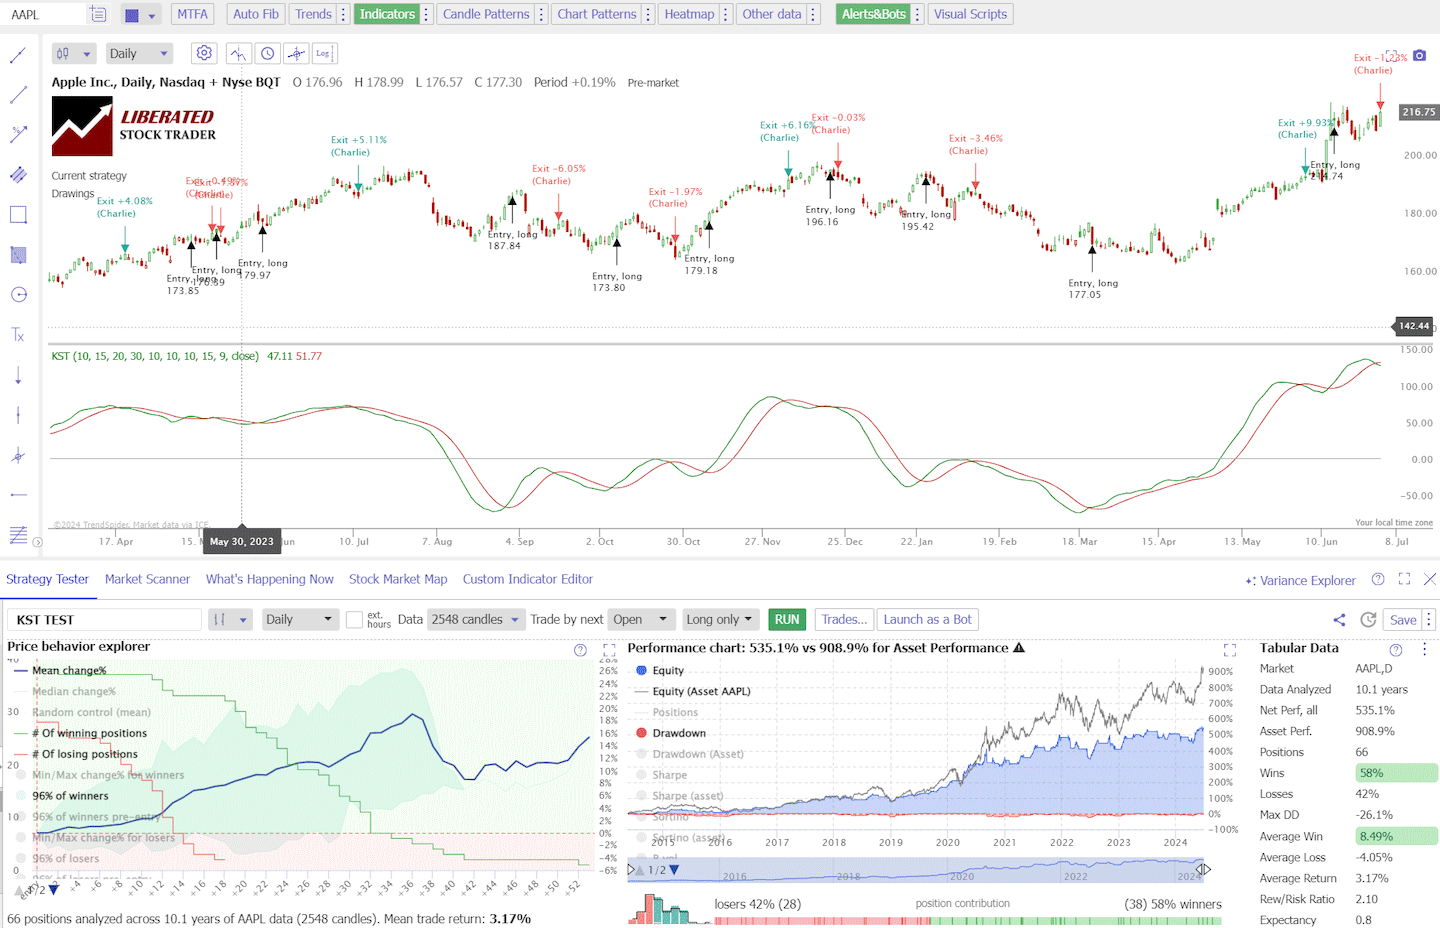
In my screenshot below, you can see that TrendSpider has mapped every buy and sell signal onto the chart and calculated the 10-year results for Apple Inc. It shows that 58% of the trades were winners, and the average win was 8.49%, producing a reward-to-risk ratio of 2.1. A very good result.
KST Basic Strategy Results & Performance
Our basic KST strategy testing shows 1,867 trades, with a reward-to-risk ratio averaging 2.1 and an average return of 3.1% per trade. The average win was 9.09%, with an average loss of 3.3%. These are good results.
TrendSpider Bubble Charts Screenshot

KST Basic Strategy Test Results Table
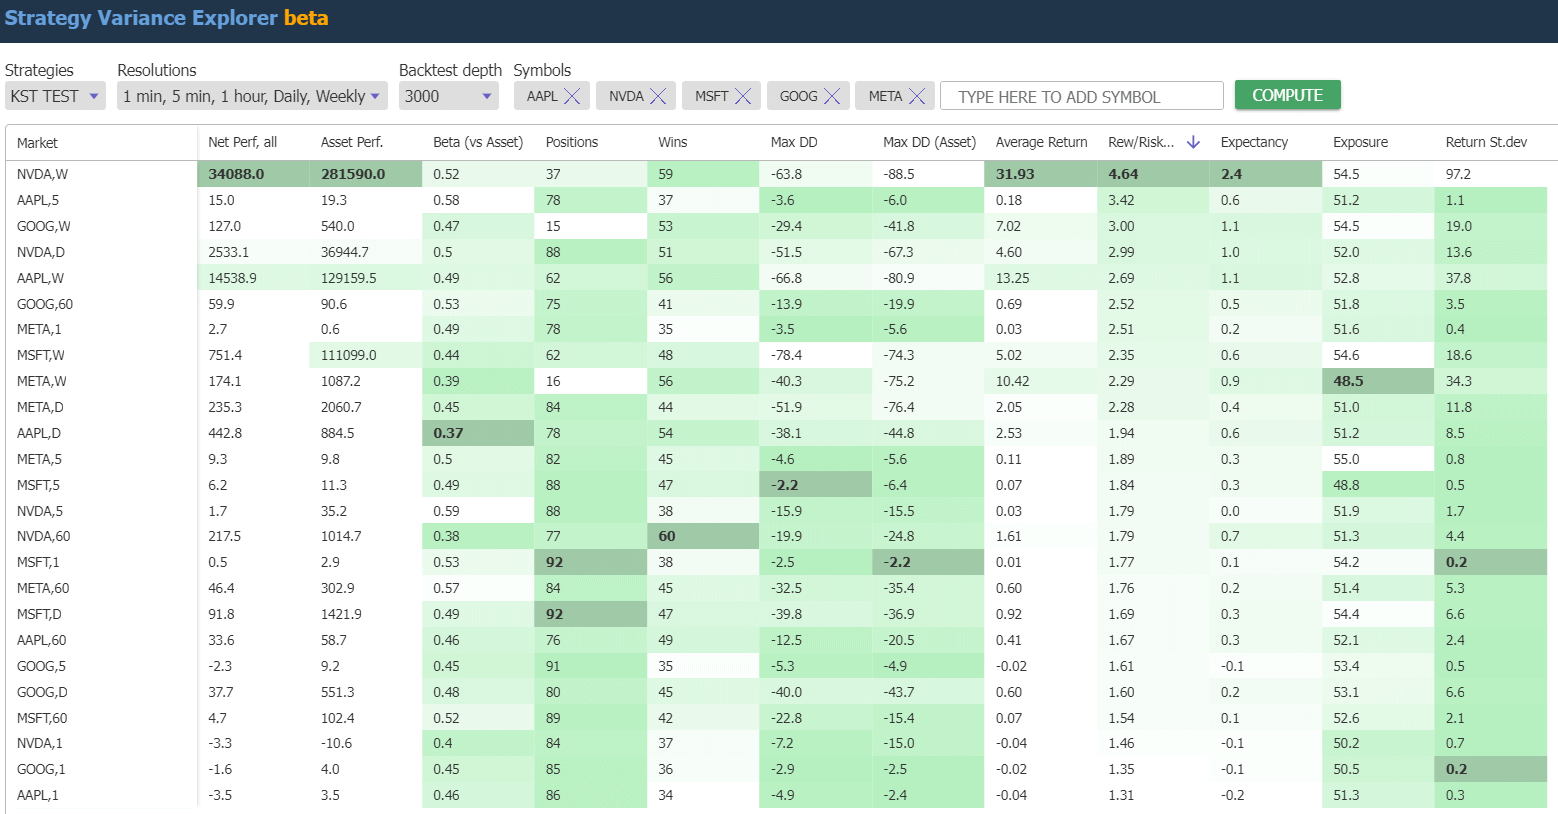
Here are the results in a table format; you can copy and paste them into Excel or Google Sheets to manipulate the data.
| Ticker, Timeframe? | Positions | Wins % | Losses | Average Win % | Average Loss % | Average Return % | Rew/Risk Ratio | Expectancy | Exposure | Avg. Trade Length |
| NVDA,W | 37 | 59 | 41 | 62.95 | -13.56 | 31.93 | 4.64 | 2.4 | 54.5 | 18.6 |
| AAPL,5 | 78 | 37 | 63 | 0.98 | -0.29 | 0.18 | 3.42 | 0.6 | 51.2 | 18.7 |
| GOOG,W | 15 | 53 | 47 | 18.57 | -6.18 | 7.02 | 3 | 1.1 | 54.5 | 18.5 |
| NVDA,D | 88 | 51 | 49 | 13.22 | -4.43 | 4.6 | 2.99 | 1 | 52 | 16.7 |
| AAPL,W | 62 | 56 | 44 | 32.94 | -12.26 | 13.25 | 2.69 | 1.1 | 52.8 | 18.3 |
| GOOG,60 | 75 | 41 | 59 | 3.8 | -1.51 | 0.69 | 2.52 | 0.5 | 51.8 | 19.7 |
| META,1 | 78 | 35 | 65 | 0.41 | -0.16 | 0.03 | 2.51 | 0.2 | 51.6 | 18.8 |
| MSFT,W | 62 | 48 | 52 | 18.99 | -8.08 | 5.02 | 2.35 | 0.6 | 54.6 | 15.9 |
| META,W | 16 | 56 | 44 | 28.03 | -12.23 | 10.42 | 2.29 | 0.9 | 48.5 | 18.2 |
| META,D | 84 | 44 | 56 | 10.53 | -4.63 | 2.05 | 2.28 | 0.4 | 51 | 17.2 |
| AAPL,D | 78 | 54 | 46 | 8.42 | -4.34 | 2.53 | 1.94 | 0.6 | 51.2 | 18.7 |
| META,5 | 82 | 45 | 55 | 0.69 | -0.37 | 0.11 | 1.89 | 0.3 | 55 | 19.1 |
| MSFT,5 | 88 | 47 | 53 | 0.4 | -0.21 | 0.07 | 1.84 | 0.3 | 48.8 | 15.6 |
| NVDA,5 | 88 | 38 | 63 | 1.31 | -0.73 | 0.03 | 1.79 | 0 | 51.9 | 16.7 |
| NVDA,60 | 77 | 60 | 40 | 4.32 | -2.42 | 1.61 | 1.79 | 0.7 | 51.3 | 19 |
| MSFT,1 | 92 | 38 | 62 | 0.19 | -0.11 | 0.01 | 1.77 | 0.1 | 54.2 | 16.7 |
| META,60 | 84 | 45 | 55 | 4.25 | -2.42 | 0.6 | 1.76 | 0.2 | 51.4 | 17.3 |
| MSFT,D | 92 | 47 | 53 | 6.01 | -3.55 | 0.92 | 1.69 | 0.3 | 54.4 | 16.7 |
| AAPL,60 | 76 | 49 | 51 | 2.18 | -1.3 | 0.41 | 1.67 | 0.3 | 52.1 | 19.6 |
| GOOG,5 | 91 | 35 | 65 | 0.49 | -0.3 | -0.02 | 1.61 | -0.1 | 53.4 | 16.6 |
| GOOG,D | 80 | 45 | 55 | 5.74 | -3.6 | 0.6 | 1.6 | 0.2 | 53.1 | 16.1 |
| MSFT,60 | 89 | 42 | 58 | 2 | -1.29 | 0.07 | 1.54 | 0.1 | 52.6 | 16.7 |
| NVDA,1 | 84 | 37 | 63 | 0.59 | -0.41 | -0.04 | 1.46 | -0.1 | 50.2 | 16.9 |
| GOOG,1 | 85 | 36 | 64 | 0.18 | -0.13 | -0.02 | 1.35 | -0.1 | 50.5 | 16.8 |
| AAPL,1 | 86 | 34 | 66 | 0.24 | -0.19 | -0.04 | 1.31 | -0.2 | 51.3 | 16.9 |
KST Advanced Strategy Testing
To set up a KST Advanced strategy in TrendSpider, follow these steps:
- Register for TrendSpider
- Select Strategy Tester
- Entry Condition > Add Parameter > Condition > Indicator > KST > Greater Than > Signal.
- AND KST > Greater Than > Constant Value = 0
- For the Sell Criteria
- Select > Add Script > Add Parameter > Condition > Indicator > KST > Greater Than > Signal.
- AND KST > Less Than > Constant Value = 0
- Finally, click “RUN.”
Test Results Advanced KST Strategy
Our advanced KST strategy testing shows 870 trades, with a reward-to-risk ratio averaging 5.5 and an average return of 20.6% per trade. The average win was 40.4%, with an average loss of 4.3%. These are excellent results. We can clearly see that the advanced KST strategy results in fewer trades and vastly improved reward-to-risk and average wins.
| Ticker, Timeframe? | Positions | Wins % | Losses | Average Win% | Average Loss% | Average Return% | Rew/Risk Ratio | Expectancy | Exposure | Avg. Length |
| AAPL,D | 38 | 53 | 47 | 14.34 | -5.46 | 4.96 | 2.63 | 0.9 | 62.5 | 48.3 |
| META,D | 36 | 50 | 50 | 27.26 | -5.86 | 10.7 | 4.65 | 1.8 | 66.7 | 54.6 |
| MSFT,D | 36 | 56 | 44 | 13.02 | -5.03 | 5 | 2.59 | 1 | 71.2 | 58.3 |
| GOOG,D | 33 | 52 | 48 | 10.84 | -4.8 | 3.26 | 2.26 | 0.7 | 64.4 | 49.5 |
| NVDA,D | 37 | 51 | 49 | 43.64 | -7.25 | 18.88 | 6.02 | 2.6 | 71 | 56.6 |
| AAPL,W | 29 | 41 | 59 | 156.68 | -23.55 | 51.03 | 6.65 | 2.2 | 67.9 | 52.2 |
| META,W | 6 | 50 | 50 | 187.49 | -7.76 | 89.86 | 24.16 | 11.6 | 79.1 | 82.5 |
| MSFT,W | 20 | 45 | 55 | 229.08 | -12.19 | 96.38 | 18.8 | 7.9 | 75.4 | 71.4 |
| GOOG,W | 5 | 80 | 20 | 58.76 | -7.33 | 45.54 | 8.01 | 6.2 | 74.6 | 79 |
| NVDA,W | 12 | 58 | 42 | 320.6 | -12.42 | 181.84 | 25.81 | 14.6 | 73.4 | 80.3 |
| AAPL,60 | 40 | 53 | 48 | 3.46 | -2.17 | 0.78 | 1.59 | 0.4 | 59.3 | 43.5 |
| META,60 | 38 | 47 | 53 | 7.7 | -3.74 | 1.68 | 2.06 | 0.4 | 66 | 51.1 |
| MSFT,60 | 38 | 42 | 58 | 3.88 | -1.67 | 0.66 | 2.32 | 0.4 | 65.9 | 51.1 |
| GOOG,60 | 45 | 38 | 62 | 5.18 | -2.29 | 0.53 | 2.26 | 0.2 | 61.7 | 40.1 |
| NVDA,60 | 38 | 45 | 55 | 12.68 | -3.33 | 3.83 | 3.8 | 1.1 | 66.8 | 51.7 |
| AAPL,5 | 39 | 44 | 56 | 1.3 | -0.41 | 0.34 | 3.21 | 0.8 | 58.6 | 44.1 |
| META,5 | 45 | 33 | 67 | 1.29 | -0.51 | 0.09 | 2.54 | 0.2 | 55.9 | 36.2 |
| MSFT,5 | 38 | 45 | 55 | 0.91 | -0.24 | 0.27 | 3.81 | 1.2 | 63.1 | 48.8 |
| GOOG,5 | 43 | 42 | 58 | 0.75 | -0.39 | 0.09 | 1.94 | 0.2 | 56.3 | 38.3 |
| NVDA,5 | 38 | 29 | 71 | 3.19 | -0.87 | 0.31 | 3.68 | 0.4 | 59.9 | 46.3 |
| AAPL,1 | 41 | 32 | 68 | 0.5 | -0.23 | 0 | 2.21 | 0 | 52.8 | 37.6 |
| META,1 | 47 | 39 | 61 | 0.53 | -0.16 | 0.11 | 3.29 | 0.7 | 54.5 | 33.8 |
| MSFT,1 | 43 | 35 | 65 | 0.23 | -0.14 | -0.01 | 1.63 | -0.1 | 55.1 | 37.4 |
| GOOG,1 | 41 | 39 | 61 | 0.31 | -0.15 | 0.03 | 2.07 | 0.2 | 60 | 42.9 |
| NVDA,1 | 44 | 43 | 57 | 0.5 | -0.38 | 0 | 1.32 | 0 | 51.8 | 34.3 |
The Best KST Trading Strategy
The advanced KST trading strategy initiates fewer trades, 870 versus 1,867, and has a much higher reward-to-risk ratio of 5.5 versus 2.1. The average return was also improved from 3.1% to 20.6%, although this data is skewed by incredibly high returns on NVidia, Microsoft, and Meta trades.
The comparison table below clearly shows that the advanced KST strategy is the better option, with improved profitability and reward-to-risk ratio in every category.
| KST Performance | KST Basic | KST Advanced |
| # Trades | 1,867 | 870 |
| Reward-to-risk ratio | 2.1 | 5.5 |
| Average return | 3.1% | 20.6% |
| Average win | 9.09% | 40.4% |
| Average loss | 3.3% | 4.3% |
| Exposure (% time in market) | 52% | 63.7% |
Performance Summary
Our basic KST strategy testing shows 1,867 trades, with a reward-to-risk ratio averaging 2.1 and an average return of 3.1% per trade. The average win was 9.09%, with an average loss of 3.3%. These are good results.
Our advanced KST strategy testing shows 870 trades, with a reward-to-risk ratio averaging 5.5 and an average return of 20.6% per trade. The average win was 40.4%, with an average loss of 4.3%. These are excellent results. We can clearly see that the advanced KST strategy results in fewer trades and vastly improved reward-to-risk and average wins.
Combining KST with Other Indicators
The KST can be combined with other technical indicators to form a complete trading strategy. Look at our other research on MACD, Moving Averages, Heikin Ashi charts, Price Rate of Change, Aroon, or even bullish chart patterns. However, it provides multiple false buy and sell signals during consolidation, leading to many minor trading losses. Therefore, avoid using this indicator when consolidating markets.
Can KST be used for Buy and Sell Signals?
Yes, the KST is an excellent indicator for buy and sell signals. Our 250 years of data across 2,746 test trades shows that the advanced KST strategy provides profitable buy and sell signals with a reward-to-risk ratio of 5.5 and 20.6% average return per trade.
Should You Use the KST Indicator?
Yes, I would recommend using the KST indicator as part of any daily or weekly trading strategy. Our extensive dataset reveals that the advanced KST strategy yields profitable buy and sell signals, boasting a reward-to-risk ratio of 5.5 and an average trade return of 20.6%.
Is the KST Indicator Accurate?
Yes, the KST indicator is one of the most accurate indicators I have tested. It stands out with a reward-to-risk ratio of 5.5 and an average trade return of 20.6%.
What are the Best KST Settings?
The best KST settings are the standard settings on a daily or weekly chart. A buy signal occurs when the KST line is above the signal line and above the 0 line. A sell signal occurs when the KST line is below the signal line and the 0 line.
Limitations
Although the KST is a powerful trading tool, it should not be used in isolation. It is best utilized when combined with additional chart patterns and indicators. This will help you avoid false signals and losses due to market consolidation phases. Additionally, when using the KST for buy and sell signals, ensure that stock volume confirms the validity.
Despite its strengths, the KST Oscillator is not without limitations. One notable issue is the potential for false signals, particularly in volatile markets. Rapid price movements can cause the oscillator to generate misleading indications, leading traders astray.
In choppy markets, the combined moving averages may struggle to react quickly to sudden changes. As a result, traders may miss timely entry or exit points.
Another limitation is the complexity of interpreting the multiple time frames simultaneously. Inexperienced traders might find it challenging to navigate the nuanced data, leading to erroneous decisions. Therefore, understanding the tool’s mechanics is crucial for its effective use.
Conclusion
The KST Oscillator combines multiple time frames to offer a broader perspective on market trends, making it a versatile tool for traders. However, it can also generate false signals, particularly in volatile markets.
The KST Oscillator analyzes various timescales, providing a comprehensive view of the market. This enables traders to assess short-term, medium-term, and long-term trends concurrently.
Its versatility allows it to be applied across different asset classes, including stocks, commodities, and forex markets. By accounting for multiple moving averages, it can adapt to diverse trading strategies.
Additionally, it is particularly effective in identifying momentum shifts, which can be critical for entering or exiting positions. The tool’s structure helps reduce noise and offers clearer signals in stable market conditions.
FAQ
What is the best software for trading the KST indicator?
The best KST trading software is TrendSpider. I have tested 2,746 KST trades using TrendSpider and can recommend it wholeheartedly.
How can one use the KST indicator for trading?
Traders apply the KST indicator to identify potential buy and sell signals. By observing the crossings of KST and its signal line, they can determine market momentum and predict trend reversals.
What distinguishes the KST indicator from MACD?
The KST indicator smooths multiple rate-of-change calculations, whereas the MACD focuses on the difference between two moving averages. The KST is much more reliable and profitable than MACD.
Where can traders find the KST indicator?
Traders can access the KST oscillator on TrendSpider, TradingView, and MetaTrader, which offer a broad selection of built-in technical analysis tools and charts.
What does the short-term KST indicate in market analysis?
The short-term KST provides insights into immediate market trends and momentum. It helps traders make quick decisions based on recent market movements.
How is the KST indicator integrated within TradingView?
On TradingView, the KST indicator is integrated into the platform's charting tools. Users can easily add it to their charts, customize its settings, and analyze its signals.
What is an effective strategy when trading the KST indicator?
My testing shows that the most effective KST strategy is to buy when the KST line is above the signal line and the zero line and sell when it is below the signal line and the zero line.
What are the common misconceptions about the KST indicator?
One common misconception is that the KST is a simple moving average crossover indicator. In reality, it combines multiple rate-of-change moving averages with different periods to provide a more accurate representation of market trends. Another misconception is that it only works for short-term trading when, in fact, it is better on daily and weekly charts.
How can traders use the KST indicator alongside other technical indicators?
Traders can use the KST indicator in conjunction with other technical indicators such as RSI, MACD, or Bollinger Bands to confirm signals and improve overall accuracy. For example, if the KST crosses above the signal line while the RSI is in oversold territory, it could be a strong buy signal. On the other hand, if the KST crosses below the signal line and the MACD histogram shows a bearish crossover, it could be a potential sell signal.
