The 200-day moving average is a long-term chart indicator used to assess a stock’s trend.
An asset is bullish if it is above the moving average and bearish if it is below. It is calculated by averaging a security’s closing prices over the last 200 days. But is it profitable?
The 200-day moving average (MA) is widely used to gauge the health of a stock or index, like the S&P 500 or Nasdaq 100, but does it work, and is it worth using?
We performed multiple backtests spanning over 200 years of data to determine its accuracy.
What Is the 200-day Moving Average?
The 200-day moving average is a technical indicator that assesses the long-term trend of an asset. It tracks a stock’s performance over the last 200 days and gives investors and traders an idea of where it has been, where it is now, and where it might be headed.
The 200-day Moving Average is a widely utilized indicator in technical analysis, providing valuable insights into long-term market trends.
Key Points:
- Calculation: It’s calculated by summing up a security’s closing prices for the last 200 days and then dividing by 200. The result is a smooth line that cuts out ‘noise,’ enabling traders to identify overarching trends more clearly.
- Significance: A stock trading above its 200-day moving average is often seen as bullish, indicating upward momentum. Conversely, a stock trading below this line is perceived as bearish, suggesting downward momentum.
- Uses: Traders often use the 200-day moving average as a support or resistance level. When the price crosses above this line, it can act as a buy signal; when it falls below, it may be a sell signal.
Key Takeaways
- The 200-day moving average is good for assessing long-term trends.
- The 200-day MA should not be used for buy and sell signals.
- This indicator underperforms a buy-and-hold strategy in our testing.
- The 200-day MA produces an average of 70% losing trades.
- Combining the 200-day MA with a 50-day MA improves profitability.
How to Calculate the 200-Day Moving Average?
The 200-day moving average is calculated by dividing the security’s closing prices over the last 200 days by 200. This creates an average of the stock’s performance over that period and provides a benchmark to compare current prices. If the price is higher than the average, it could indicate that the stock is in an uptrend, whereas if it’s lower than the average, it could indicate that it’s in a downtrend. This indicator is typically used to assess stocks but can be applied to other assets like currencies and commodities.
My thorough testing awarded TradingView a stellar 4.8 stars!
With powerful stock chart analysis, pattern recognition, screening, backtesting, and a 20+ million user community, it’s a game-changer for traders.

Whether you're trading in the US or internationally, TradingView is my top pick for its unmatched features and ease of use.
Explore TradingView – Your Gateway to Smarter Trading!
How to use the 200-day Moving Average?
To use a 200-day moving average on a chart, open a charting service like TradingView, select “Simple Moving Average,” and configure it with the 200 settings. When the price is above the 200-day moving average, it is bullish; when below, it is bearish.
How to Trade a 200-Day Moving Average?
To trade the 200-day moving average, a trader will seek a buy signal when the price is above the 200-day moving average and buy long positions in the stock. When the price is below the 200-day moving average (a sell signal), a trader may consider shorting/selling the asset.
It’s important to note that this indicator isn’t foolproof and can be subject to many false signals due to volatile markets. The image below shows many false signals as the S&P 500 consolidates during a trend change. Therefore, it is best to use it with other indicators or tools like candlestick patterns and volume analysis to confirm an entry or exit point.
We independently research and recommend the best products. We also work with partners to negotiate discounts for you and may earn a small fee through our links.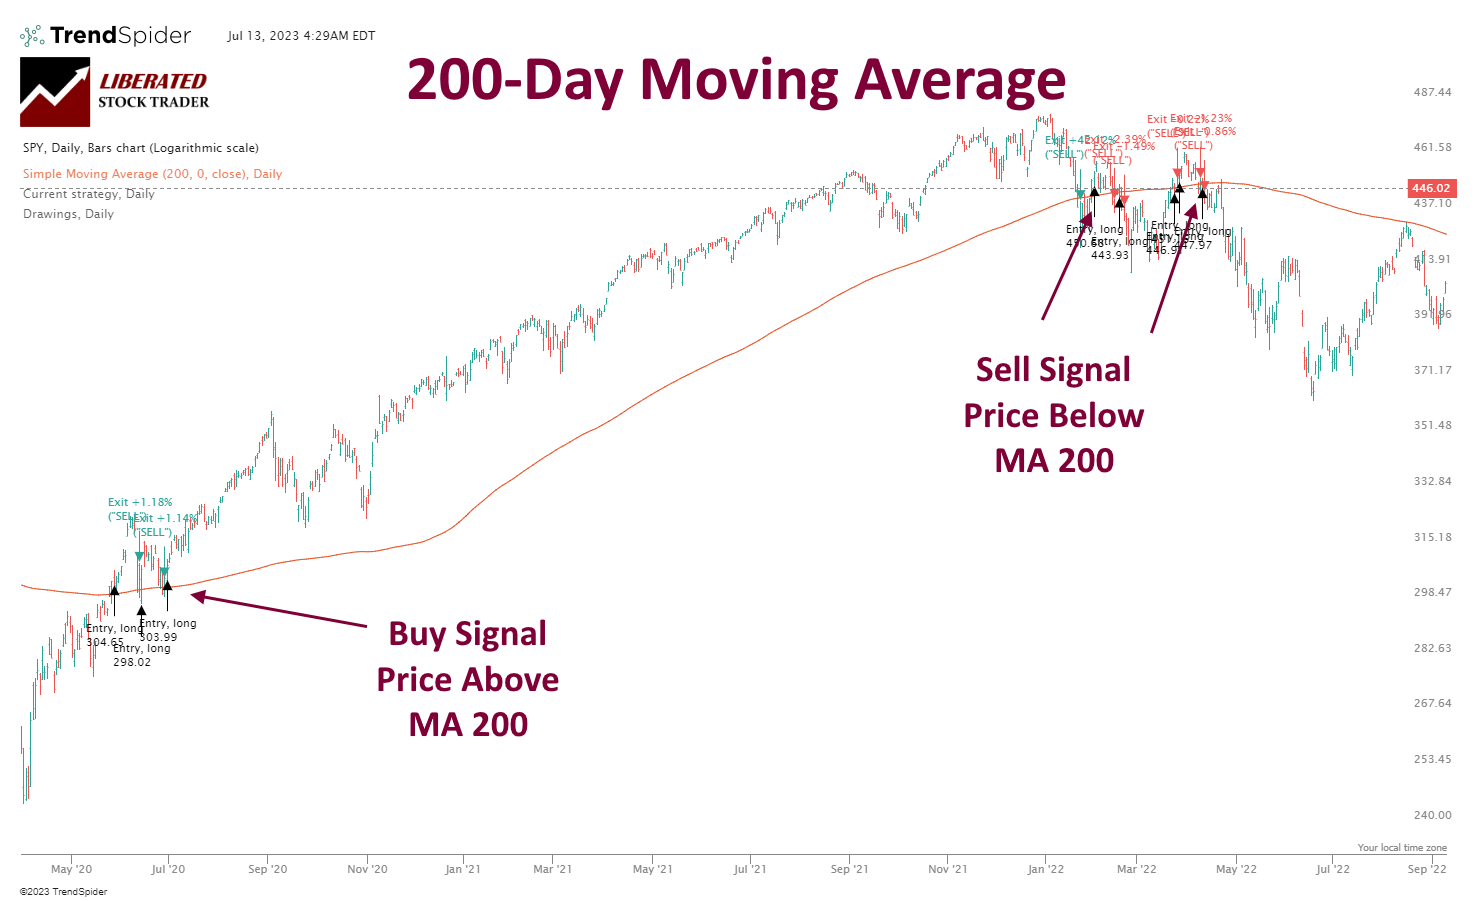
Get TrendSpider for Strategy Testing
It’s also important to remember that the 200-day moving average should guide long-term trends rather than intraday trades. This is because of its lagging nature and potential for false signals.
Finally, always use protective stops when trading around the 200-day moving average, as it can give a false sense of security if a trader is too willing to take on risk without protecting their capital. With stop losses, traders can guard against downside risks and maintain more control over their trades.
Testing the 200-day Moving Average
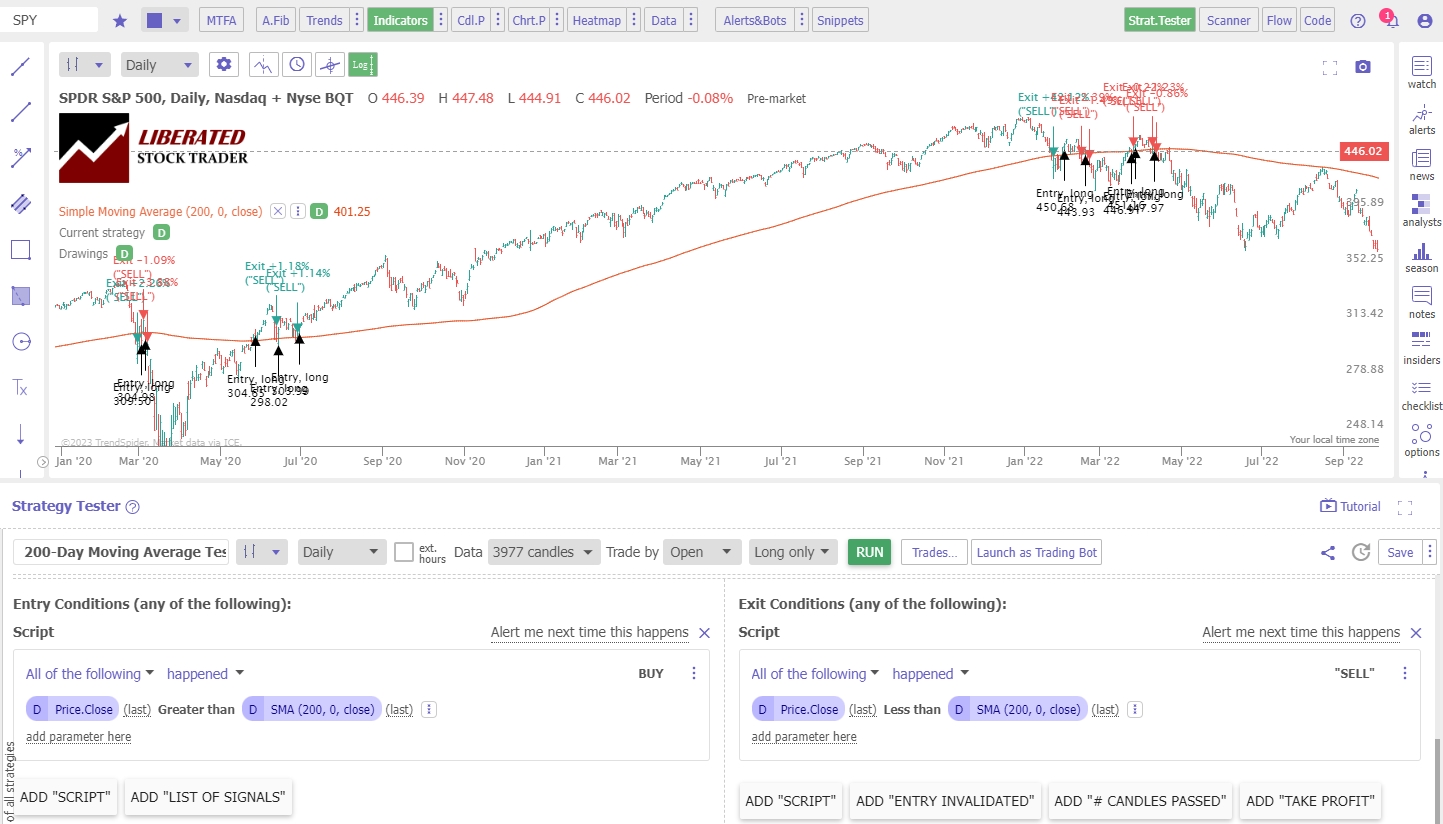
You need to use backtesting software to test if an indicator, pattern, or chart is reliable. For this 200-MA testing, we are using TrendSpider. TrendSpider provides excellent charting, pattern recognition, and robust point-and-click backtesting, which makes technical analysis testing a breeze.
How to set up a 200-day MA Backtest
- Register for TrendSpider.
- Buy Signal: Select Strategy Tester > Entry Condition > Add Script > Add Parameter > Condition > Price. Close > Greater than > SMA (200, 0, Close).
- Sell Signal: Exit Condition > Click Add Script > Add Parameter > Condition > Price. Close > Less than > SMA (200, 0, Close).
- Finally, click “RUN.”
See the screenshot below for the exact configuration.
We Use TrendSpider for Strategy Testing
Now that we have established how the backtesting works, let’s look at the results.
Test Results S&P 500/SPY
Our testing of the 200-day MA on the S&P500 over 16 years revealed that using this indicator is a losing proposition. A buy-and-hold strategy made a profit of 192% vs. the 200-day MA, which made only 152%. The 200-day MA had a good reward-to-risk ratio of 6.2:1, but the winning trades were a poor 31%. (See the SP-500 Test Chart Below)
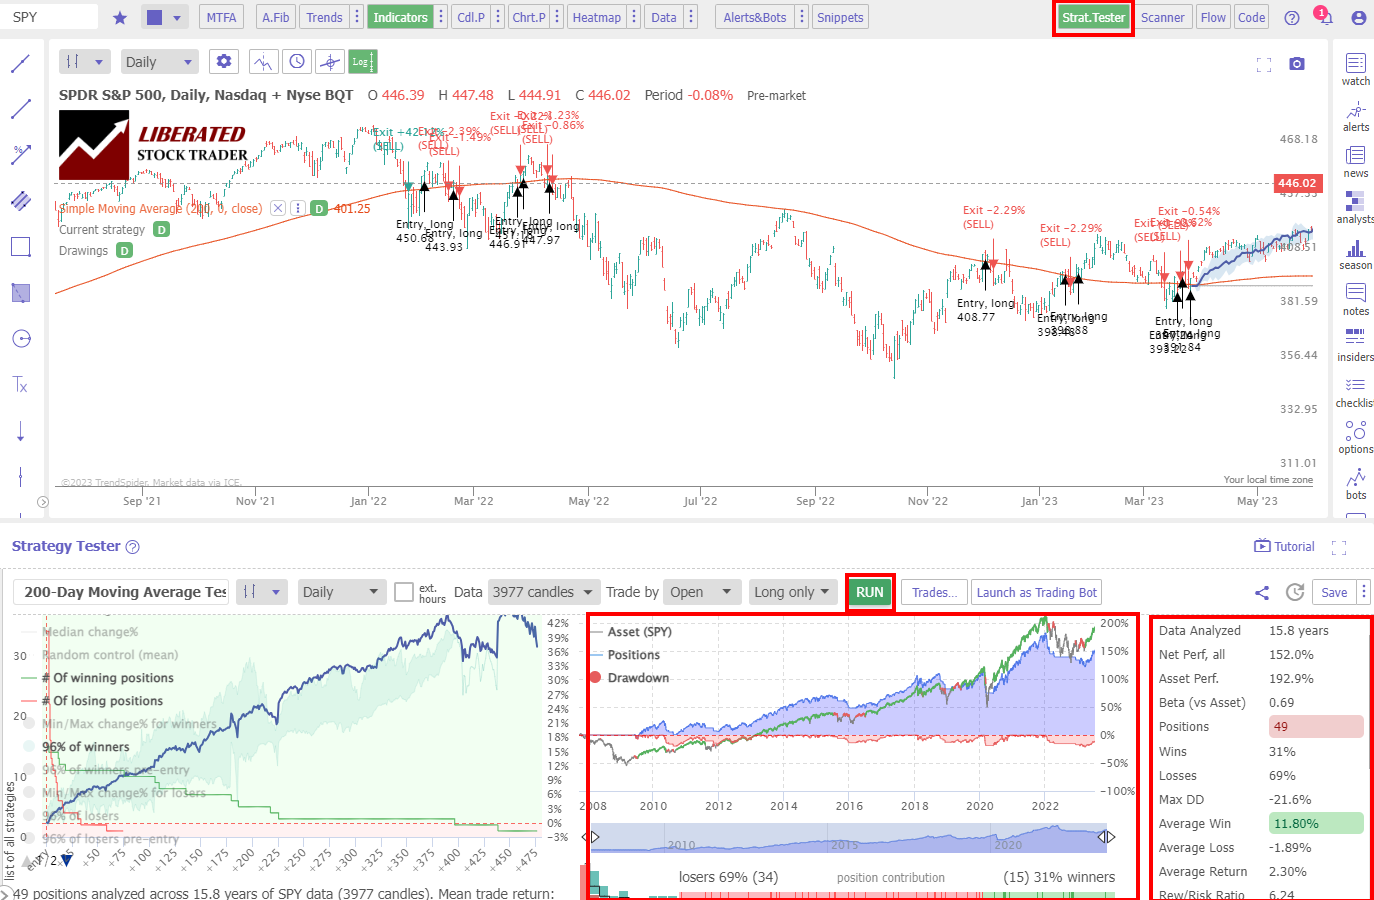
Strategy Testing Using TrendSpider
Our results show that using the 200-day moving average on the S&P 500/SPY for trading means you would lose 69% of the time, and the average loss was –1.89 % across 49 trades.
Test Results Nasdaq 100
Our testing of the 200-day MA on the Nasdaq 100/QQQ over 16 years revealed that this indicator is not recommended. A buy-and-hold strategy made a profit of 637% vs. the 200-day MA, which made only 387%. The 200-day MA had a high reward-to-risk ratio of 10.3:1, but the winning trades were a poor 37%. (See the Nasdaq/QQQ Test Chart Below)
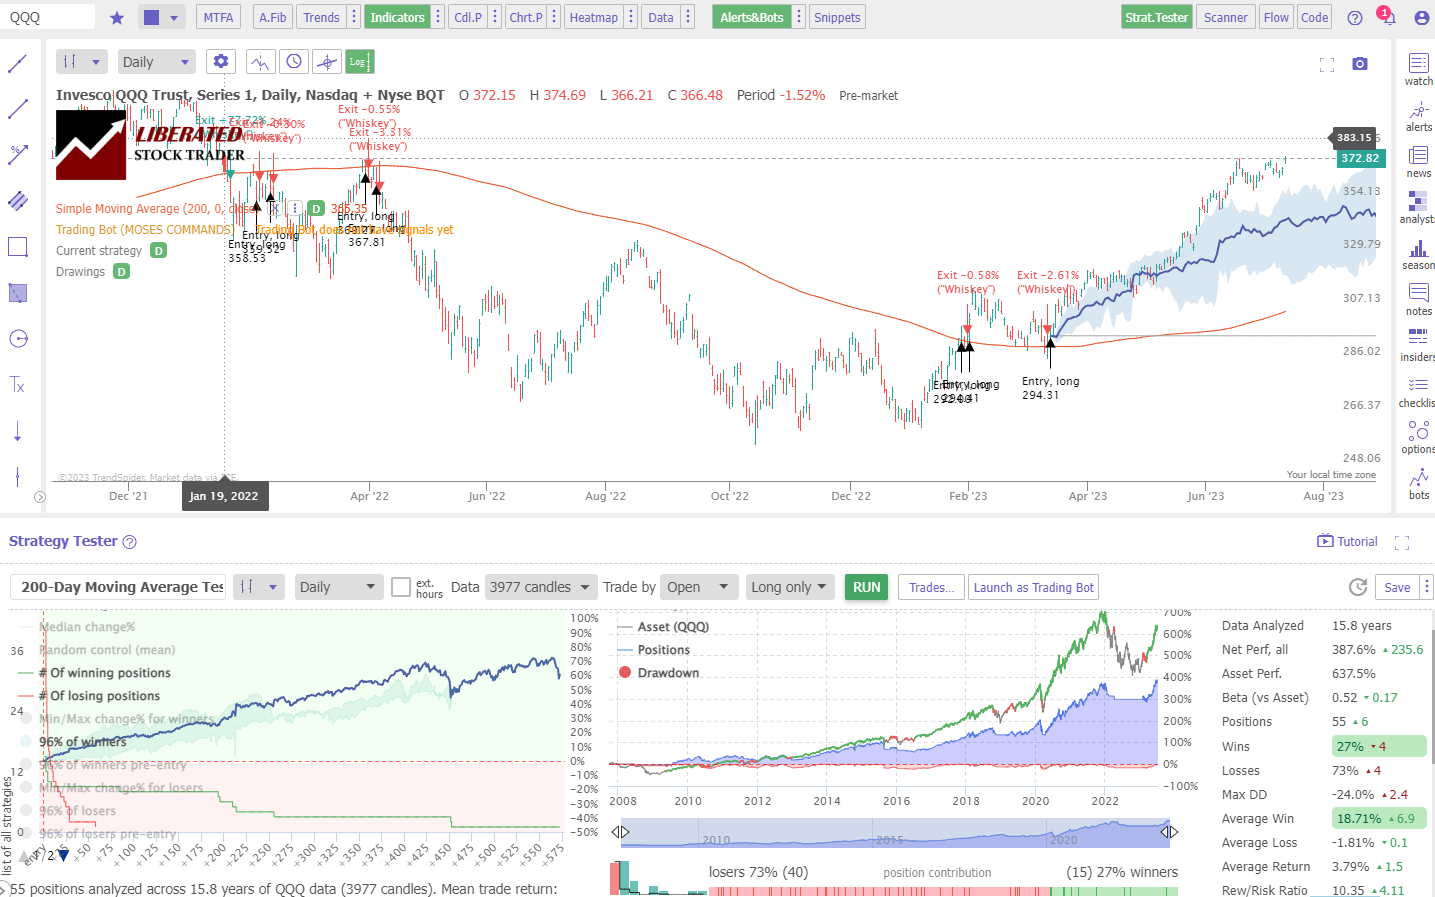
Strategy Testing Using TrendSpider
Our results show that using the 200-day moving average on the NASDAQ 100 for trading means you would make a loss 73% of the time, and the average loss was -1.81% across 55 trades.
Test Results Apple Inc.
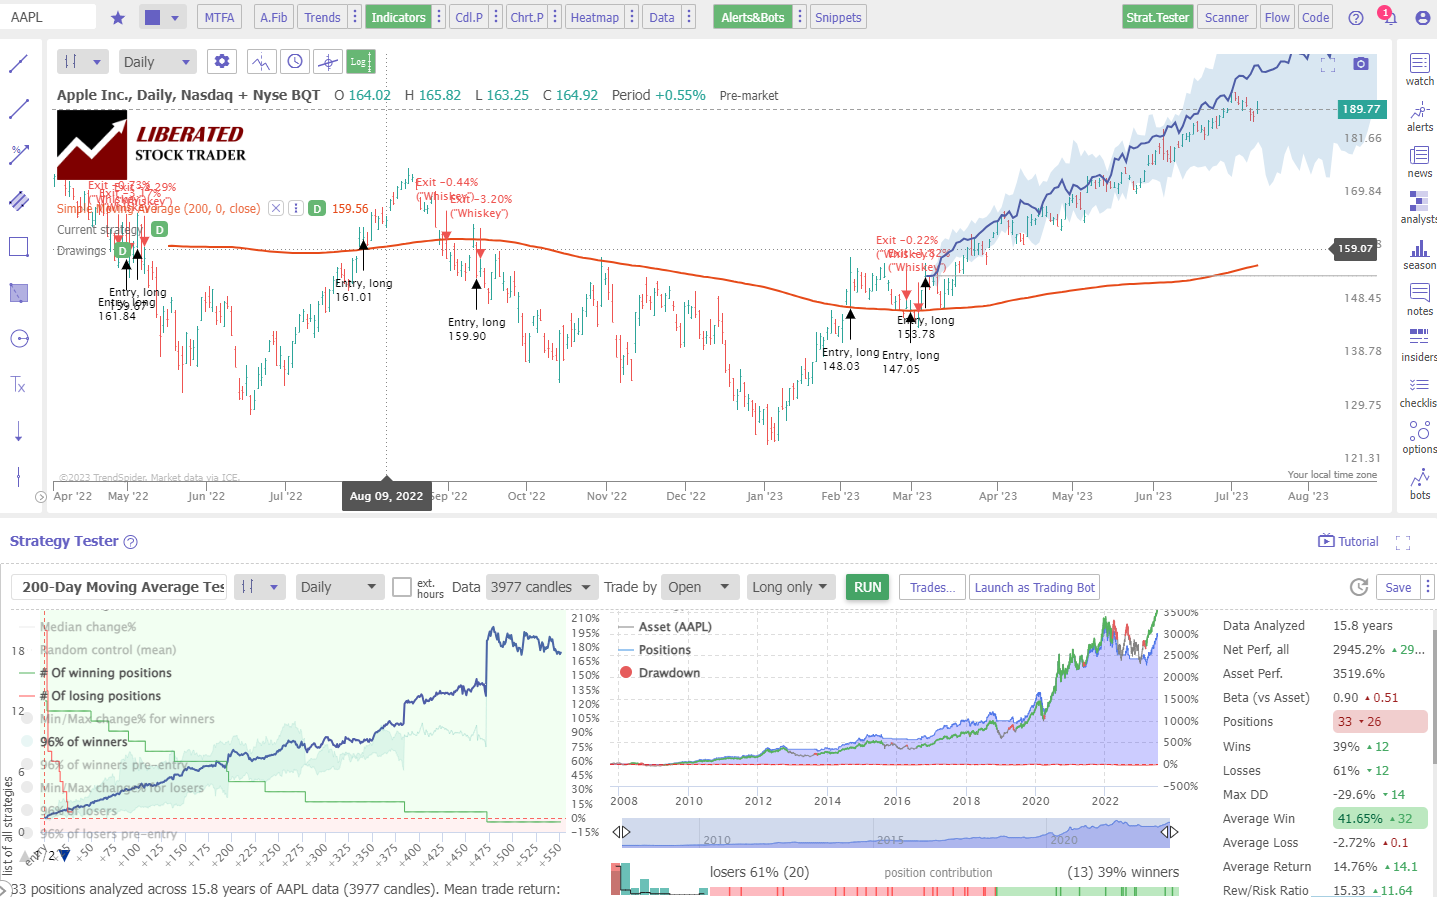
Our testing of the 200-day MA on Apple Inc. over 16 years revealed that traders should avoid using this indicator. A buy-and-hold strategy made a profit of 3519% vs. the 200-day MA, which made only 2945%. The 200-day MA had a high reward-to-risk ratio of 15:1, but the winning trades were a poor 39%. (See the Apple Test Chart Below)
Strategy Testing Using TrendSpider
Our results show that using the 200-day moving average on Apple Inc. for trading means you would make a loss 61% of the time, and the average loss was -2.72% across 33 trades.
Test Results Tesla Inc.
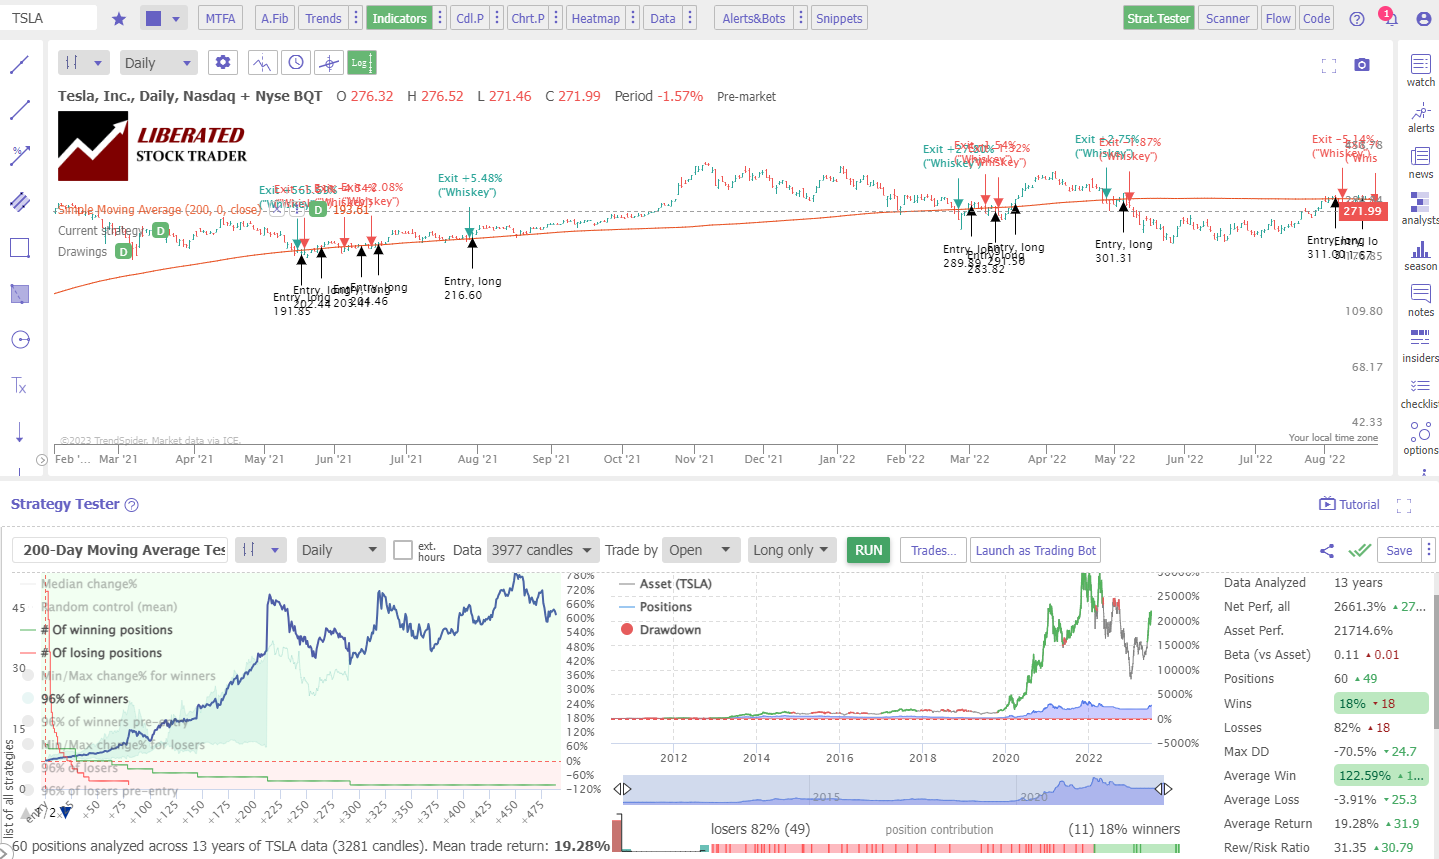
Our testing of the 200-day MA on Tesla Inc. over 13 years proves traders should avoid it. A buy-and-hold strategy made a profit of 21,714% vs. the 200-day MA, which made only 2,661%. The 200-day MA had a high reward-to-risk ratio of 31:1, but the winning trades were a poor 18%. (See the Tesla Test Chart Below)
TrendSpider – Best for AI Trading
Our results show that using the 200-day moving average on Tesla Inc. for trading means you would make a loss 82% of the time, and the average loss was -3.91% across 60 trades.
200-Day MA Overall Test Results
To summarize our testing of the 200-day moving average, the reward-to-risk ratios in all tests were high, averaging 15:1, and the average profit per trade was good at 48%. Unfortunately, the percentage of winning trades was very low, at 29%, making this strategy unprofitable overall.
| 200-Day MA Results | Winning Trades | Avg Win | Avg Loss | Rew/Risk Ratio |
| S&P 500 | 31% | 11.80% | -1.9% | 6.24 |
| Nasdaq 100 | 27% | 18.70% | -1.8% | 10.3 |
| Apple Inc. | 39% | 41.65% | -2.7% | 15.3 |
| Tesla Inc. | 18% | 122.5% | -3.9% | 31.1 |
| Average | 29% | 48.7% | -2.6% | 15.7 |
Is the 200-day Moving Average Accurate?
No, according to our 64 years of testing, the 200-day moving average is not an accurate indicator. This indicator leads to an average of 71% of losing trades. While winning trades average a 20% profit, only 29% are winners.
This means the 200-day moving average is highly inaccurate and should be avoided.
Is the 200-day Moving Average Reliable?
No, the 200-day moving average is unreliable for long-term investing or short-term trading decisions. It is only 29% reliable, leading to many losing trades, averaging -2.42% per trade.
I recommend avoiding this unreliable indicator.
By itself, the 200-day moving average offers inaccurate predictions and unreliable signals, so it’s not worth using for making buy/sell decisions. Furthermore, it cannot account for sudden market movements and drastic changes in asset prices that can occur without a trend change.
Moving averages, when used with OHLC/Candlestick charts, are not profitable during periods of price consolidation. Moving averages lag behind price changes and produce many small losing trades, causing overall losses. It is also important to note that the 200-day moving average may not accurately reflect the true market trend during volatile times when prices constantly fluctuate.
Using the 200-day Moving Average as Trend Confirmation
The 200-day moving average can be used to confirm the overall trend. When the price is above its long-term MA, it is generally considered an uptrend. Conversely, when the price is below its long-term MA, it is usually seen as a downtrend. This helps traders identify potential turning points in trends by providing visual confirmation on charts.
Does the 200-Day Moving Average Work?
The 200-day moving average does not work as a standalone trading indicator. With an average of 70% of trades recording losses, it is best to avoid it. However, it can be useful as a general guide to long-term asset trends, especially when combined with other indicators.
Death Cross & Golden Cross
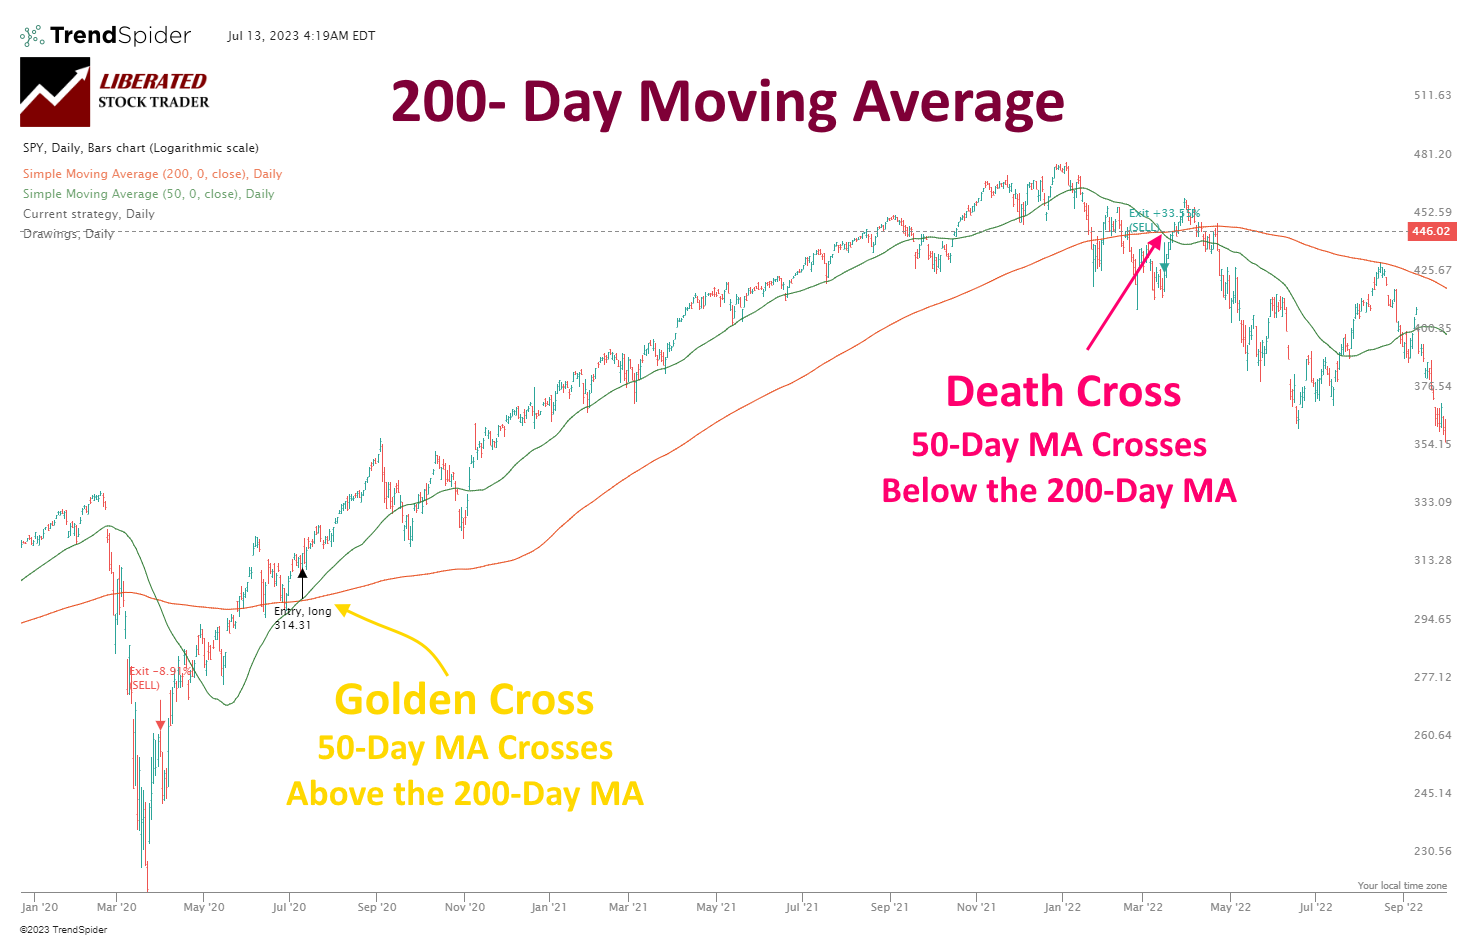
The Golden Cross and Death Cross indicator combines a 50-day and 200-day moving average. A death cross occurs when a shorter-term 50-day moving average crosses below a longer-term 200-day moving average, indicating that the stock is in bearish territory and may be headed lower. Conversely, a Golden Cross can indicate an emerging uptrend as the short-term MA rises above the long-term MA.
Does the Golden/Death Cross Indicator Work?
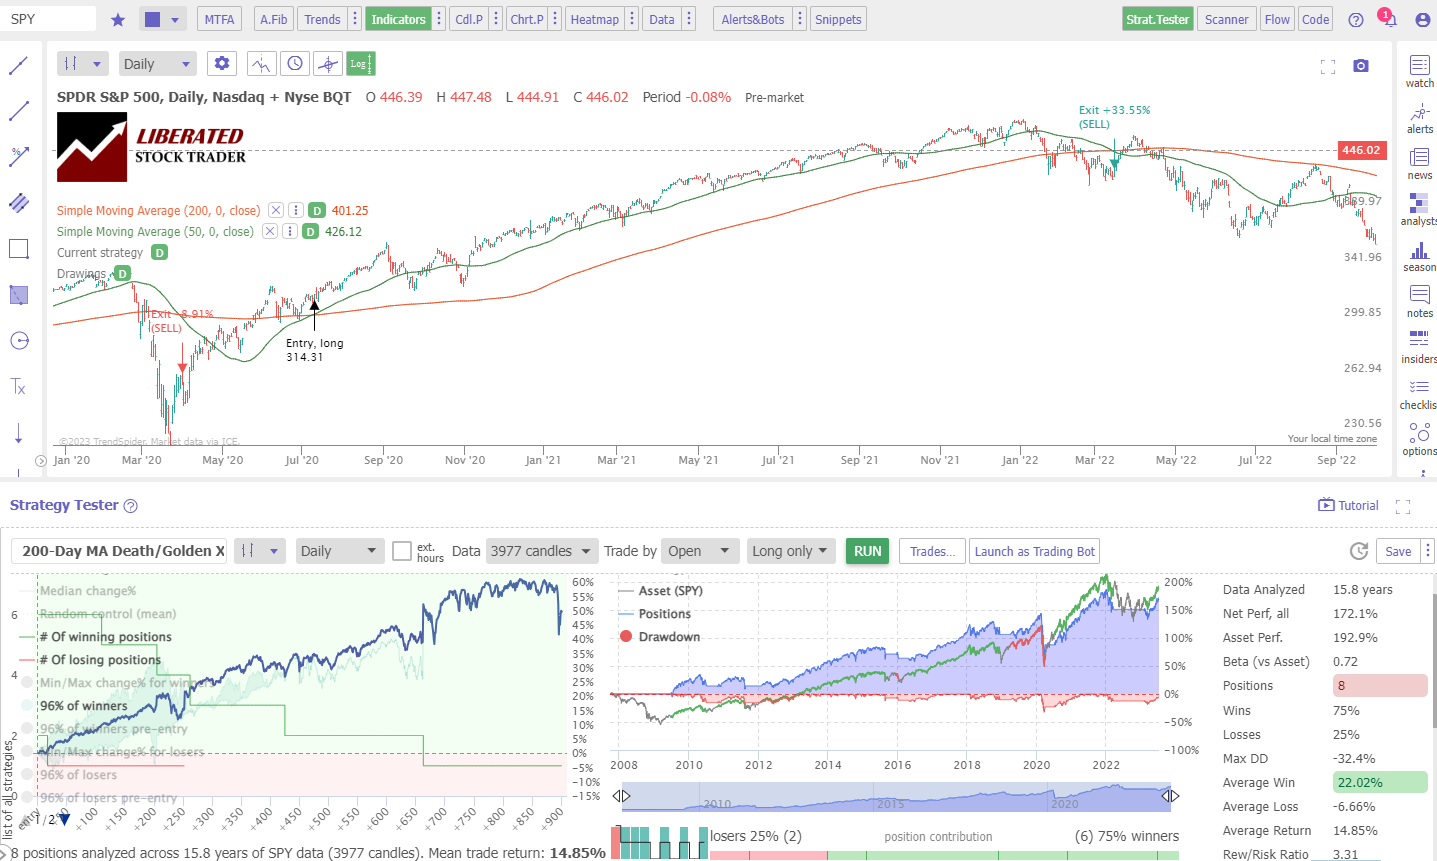
According to our research, the death/golden cross strategy improves over the 200-day moving average strategy but still lags behind a buy-and-hold strategy. On the S&P 500, this strategy produced a 3.3:1 reward-to-risk ratio, and 75% of trades were wins.
Testing Performed with TrendSpider
Our results show that trading the death/golden crosses on the S&P 500 over 16 years would result in an average win of 14% and an average loss of 6.6% across 8 trades.
This demonstrates that good results can be achieved by combining different moving averages and other oscillating indicators.
Is the 200-day Moving Average Worth It?
No, the 200-day moving average is not worth using for making investing or trading decisions. When used alone, the 200-day moving average is inaccurate and unreliable, underperforming buy-and-hold strategies and leading to 71% of trading making a loss.
The 200-day moving average can be used to assess whether an asset is in a long-term up/downtrend. When used with our recommended reliable indicators, such as ROC, RSI, and CCI, it can provide valuable trend confirmation.
You may also be interested in the incredible alligator indicator based on moving averages; with the optimal settings, it has proven highly profitable.
Is the 200-day Moving Average Profitable?
Individual trades using the 200-day moving average can be highly profitable; our results suggest an average 15% profit on the NASDAQ 100 and S&P 500. However, because 70% of the trades incur small losses averaging 1.8%, the overall results are unprofitable.
FAQ
How to add a 200-day moving average on Tradingview?
On the menu bar in TradingView, click "Indicators" and then select "Simple Moving Average." Enter 200 as the period and click "OK." You will now see a 200-day moving average line plotted over your chart.
How can I develop a moving average trading strategy?
The best way to create a moving average trading system is to use TrendSpider. TrendSpider can automatically backtest your strategies with historical data. You can then fine-tune your strategy and make sure that it is profitable in the long run before you start using it to trade.
How to read a 200-day moving average?
To read a 200-day moving average, look for the intersection of the current price and the line. If the price is above the line, it suggests an uptrend; if below, a downtrend. Additionally, when the price diverges from or approaches the line, this can indicate a change in trend direction.
How to find stocks below the 200-day moving average?
To find stocks below the 200-day moving average, you can use the screener tool in TradingView. Select the 200-day Simple Moving Average indicator and set it to "Below" the current price. This will filter out any stocks above the 200-day moving average.
How important is the 200-day moving average?
Although not profitable, the 200-day moving average is important because other investors think it is an accurate indicator. This means savvy traders use it to help predict the behavior of other market participants.
How to identify an uptrend in the 200-day moving average?
A 200-day moving average uptrend can be identified by looking for a series of higher highs and lows. There is an uptrend if the closing prices are consistently above their 200-day moving averages.
How to read 50 and 200-day moving averages?
To read 50 and 200-day moving averages, look for the MA 50 crossing above the 200-day MA; this is called a golden cross and is a bullish indicator. When the MA 50 crosses below the 200-day MA, it is known as a death cross, which is bearish.
Is a 200-day moving average a resistance line?
Yes, a 200-day moving average can be used as a resistance line and a support line. When the price is below the 200-day moving average, it is a resistance line, and when it breaks up through the 200-day moving average, it becomes a support line.
Is the 200-day moving average a good exit strategy?
No, the 200-day moving average should not be used as an exit strategy because, during market consolidation phases, the 200-day MA can produce many false signals.
Is the 200-Day Moving Average a Lagging Indicator?
Yes, the 200-day moving average is a lagging indicator based on past price movements. The longer the period, the more lagging the indicator becomes. As such, traders should be mindful of this when using the 200-day moving average as their primary trading tool.
Can the 200-Day MA be used for Buy & Sell Signals?
Our research suggests you should not use the 200-day MA for buy and sell signals because it is a lagging indicator. As such, it may provide false signals during market consolidation phases. Instead, traders can use a combination of indicators to determine entry and exit points in the market.
11 Accurate Day Trading Indicators Tested & Proven with Data
