The advance/decline (A/D) line indicator measures market breadth by identifying the number of stocks participating in a market advance or decline. It is calculated by subtracting the number of declining stocks from the number of advancing stocks.
Essentially, the A/D line gauges whether the broader market is gaining or losing momentum. When the A/D Line rises, it indicates that the market is bullish, and when it falls, it signals that the market is in a bearish phase. By comparing the A/D Line to price movements, traders can identify divergences between the market’s sentiment and the index’s performance, which can signal potential changes in trend direction.
Key Takeaways
- The Advance-Decline line indicates whether an index or stock is moving in line with the broader market.
- The stock is bearish if an asset decreases while the A/D line increases.
- When an index moves in the opposite direction to the A/D line, this is called a divergence.
- Divergences are the most effective way to utilize the A/D line for informed investment decisions.
What is the Advance-Decline Line?
The Advance-Decline Line (A/D Line) is a technical indicator that tracks the number of stocks advancing versus those declining on a particular stock exchange, sector, or index. It can provide insight into the overall market’s direction and is often used to gauge broad market trend changes.
The A/D Line also helps identify divergences between stock prices and underlying fundamentals, which can indicate potential reversals.
Pros:
- Easy to use and understand
- It can be used to confirm the strength of a trend or detect an upcoming reversal
- Provides insight into market breadth that cannot be seen through price action alone
- Provides a more complete picture of the underlying market dynamics
Cons:
- Not as reliable on its own, it should be used in combination with other indicators
- Signals can be delayed and may occur after the market has already started to move
- Can experience false signals in a choppy or sideways market
- It does not provide specific entry or exit points; only general direction indications are provided.
Overall, the advance-decline line is a helpful indicator that can provide a valuable perspective on the strength of a trend or reversal. It’s essential to consider it in conjunction with other indicators and factor in price action for more accurate signals. By doing this, traders can use the Advance-Decline Line to make informed trading decisions and capitalize on market opportunities.
TradingView 4.8/5⭐ : The Best Trading Platform I’ve Tested in 20+ Years
With lightning-fast charts, powerful pattern recognition, smart screening, backtesting, and a global community of 20+ million traders — it’s a powerful edge in today’s markets.

If you want one platform that gives you an edge, this is it.
The A/D Line and Market Breadth
Known as a market breadth indicator, the A/D line shows the market’s overall direction. When more stocks are advancing than declining, it is considered a bullish sign for the market. Likewise, the market is bearish when more stocks decline than advance.
What is Market Breadth?
Market breadth is a valuable metric for gauging the overall movement of the stock market. It involves assessing the ratio of rising stocks to falling stocks and comparing stocks that reach new highs to those that reach new lows. Analyzing these factors can give us valuable insights into the market’s health and trends.
The Battlefield analogy often used is:
“Are the Troops following the Generals?” This means, “Are the stocks moving in the same direction as the major stock market indexes like the DJ-30 or the S&P 500?”
Calculating the Advance-Decline Line
The Advance-Decline (A/D) line is calculated by subtracting the number of declining stocks from the number of advancing stocks. A positive A/D line indicates that more stocks are rising than falling, and a negative A/D line indicates that more stocks are declining than advancing.
Calculating the A/D Line Example
For example, if 1,000 stocks rose in value today while 800 declined, the A/D line would be +200. On the other hand, if 1,000 stocks declined in value and only 800 advanced, then the A/D line would be -200.
It’s essential to note that this calculation is performed over a longer period – not just one day. The longer the period used for calculation, the more reliable the A/D line is. For example, if you’re tracking the A/D line over a week, you would add up the number of advancing stocks each day and subtract the number of declining stocks each day. The final value would be your A/D line for that week.
The Advance-Decline Line Formula
The Advance-Decline Line Formula is written as:
A/D = (P(A) - P(D)) + PA
Where:
- P(A) is the number of stocks that advanced.
- P(D) is the number of stocks that declined.
- PA is the value of the previous period’s A/D Line.
This formula calculates the difference between the advancing and declining stocks, accurately representing whether more stocks are gaining or losing value over a certain period.
How to Trade the Advance-Decline Line?
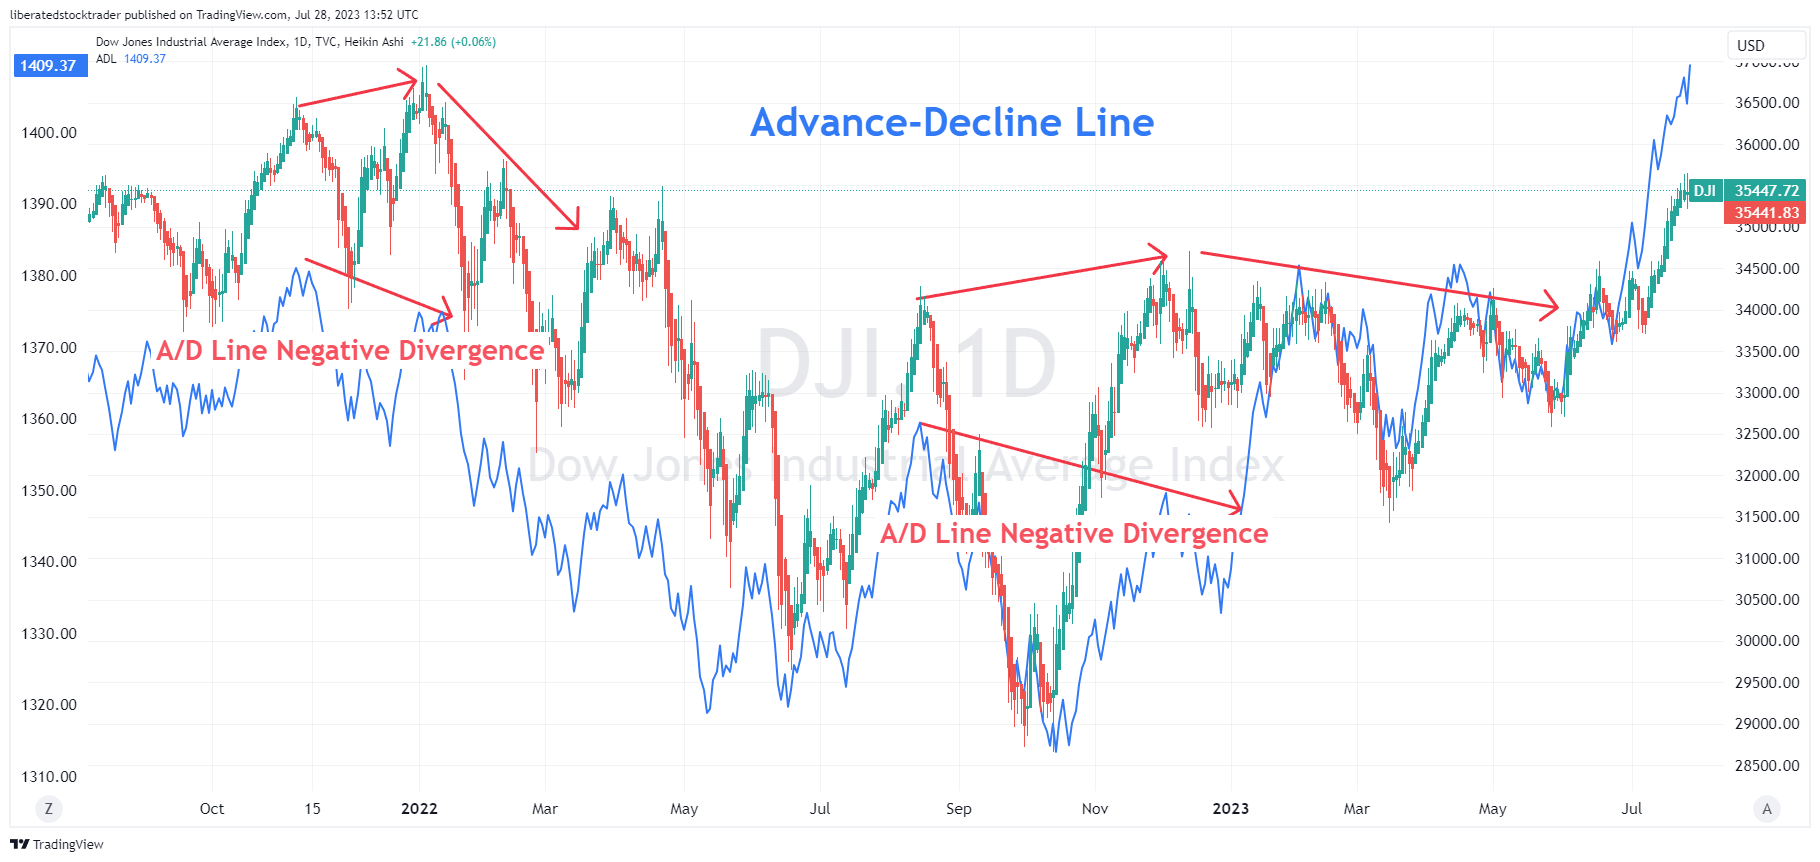
Below are the A/D line and the DJ-30 index plotted on the same chart. Imagine you have invested in a DJ-30 index tracking fund and want to see if the broader market is moving in tandem with the index or if you should expect a trend reversal. Follow the steps below to understand the scenario.
A/D Line Example Chart
Get the Advance-Decline Line on TradingView
NYSE A/D Line vs. Dow Jones Industrial Average
- In the chart above, the Dow Jones Industrials made two peaks from July to October, which we now know to be the top of the Bull Market.
- The AD Line made a negative divergence with the Dow, indicating all was not well in the broader market and signaling a change in direction.
- At the bottom of the bear market, the Dow was still moving down to its ultimate bottom in March.
- The AD Line was signaling a positive divergence, indicating that smaller capitalization stocks were gradually increasing in price.
- In February, the decline in the major indices was also reflected in most stocks on the NYSE. Hence, no divergence from this move down is yet visible, indicating that the broader market confirms the market decline we are currently seeing.
You can use this method to find similar divergences in previous market busts, crashes, or major market turning points. If you feel the market is heading into a serious correction or trend change, look at the breadth and, specifically, the AD line.
Understanding the Advance-Decline Line
The advance-decline line is plotted by taking the difference between the number of stocks advancing and those declining. If more stocks increase in price on a given day than those that decrease, the result is positive. The number is negative if more stocks decrease on a given day than increase. This is then plotted cumulatively on the AD line.
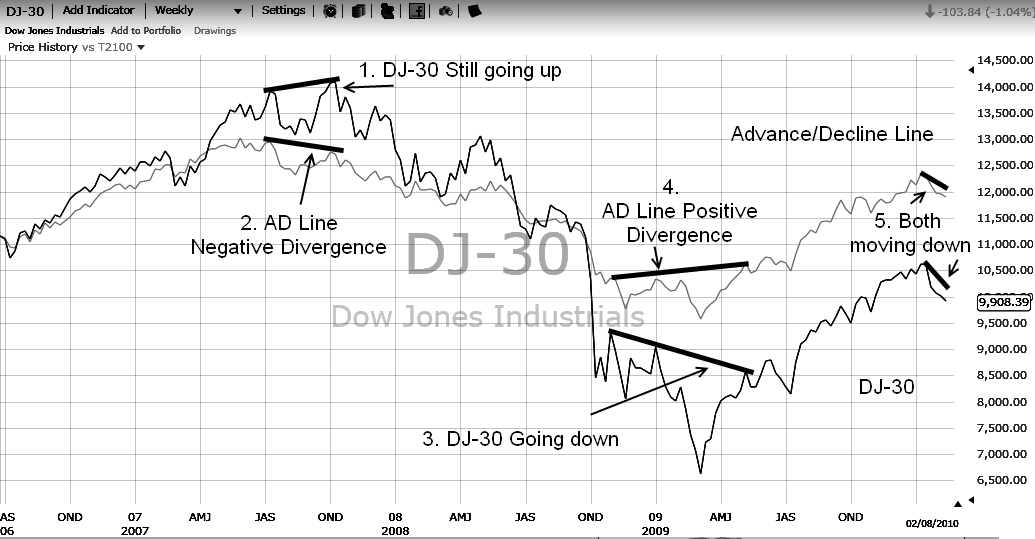
I find the AD Line most useful at major market bottoms. Here, we have a chart of the DJ-30 and the AD Line. It produces some fascinating results that can be useful during times of market turbulence.
Advance-decline line divergences can help you identify potential turning points in the stock market, and trading on these signals can potentially capitalize on price changes. Keep an eye on the AD Line when markets are volatile or move quickly, as it may offer clues about where prices are likely to head next. It can also be used as a confirmation tool for other chart patterns to help validate that the pattern is significant.
Trend Divergence
The AD Line is also useful for trend confirmation. When a new high (or low) occurs in the S&P 500, but the AD line fails to make a new high (or low), it can indicate that the trend is weakening and could potentially reverse. This divergence between price action and breadth can often be an early warning sign of a potential trend change. However, this should not be used as a standalone signal; it should be combined with other technical analysis tools to confirm the validity of the signal.
Example: Logic Behind A/D Line Divergences
This enables you to see not just if the Dow Jones Industrial Average components are moving up, but if all the stocks on the NYSE are increasing. The reasoning behind this is that if all stocks are increasing in a synchronized manner on the exchange, all is well.
Get the Advance-Decline Line on TradingView
What to Look for in the A/D Line
The advance-decline line confirms the strength of a current trend and the likelihood that it will reverse. This indicator indicates the market’s direction based on stock participation.
Bearish divergence
When indices rise, but the advance-decline line slopes downward, it indicates a potential market reversal. Conversely, if the advance-decline line trends upward and the market shows a downward trend, it suggests a healthy market condition.
Bullish divergence
When indices consistently decline while the advance-decline line exhibits an upward trajectory, it could signal that sellers are losing confidence. Conversely, if both the advance-decline line and the market’s trend downward in unison, it suggests a higher likelihood of further price declines.
Trend Confirmation
Moreover, the Advance-Decline Line serves to validate an ongoing trend. When prices consistently establish new highs and lows, and the AD Line aligns by reflecting higher highs and lower lows, the trend’s strength and continuity can be confirmed.
Trend Exhaustion
It can also identify when a trend is nearing exhaustion, often resulting in price action. When the AD line fails to reach a higher high (or lower low) while prices continue in that direction, it suggests that buying or selling pressure is diminishing, signaling the potential end of the trend.
You want to be a successful stock investor but don't know where to start.
Learning stock market investing on your own can be overwhelming. There's so much information out there, and it's hard to know what's true and what's not.

Liberated Stock Trader Pro Investing Course
Our pro investing classes are the perfect way to learn stock investing. You will learn everything you need to know about financial analysis, charts, stock screening, and portfolio building so you can start building wealth today.
★ 16 Hours of Video Lessons + eBook ★
★ Complete Financial Analysis Lessons ★
★ 6 Proven Investing Strategies ★
★ Professional Grade Stock Chart Analysis Classes ★
A/D Line Setup & Signals
The Advance-Decline Line is optimally used when plotted as an indicator over the price line. One can then compare the price direction and the ADL direction to spot divergences in direction, meaning that if the price increases and the ADL decreases, it could lead to a change in price trend.
Can the Advance/Decline Line be used for Buy and Sell Signals?
The Advance-Decline Line can be used to generate buy and sell signals. When the line rises above its peak, it is regarded as a bullish signal, and traders may look to buy in anticipation of further upside.
On the other hand, when the Advance-Decline Line falls below its prior low, it is viewed as a bearish sign, and traders may look to sell their positions. It is important to note that any signals generated should be taken cautiously and confirmed by other indicators before placing trades.
Summary
The advance-decline line is like a trusty sidekick in tracking market uptrends and downtrends. It’s a reliable tool for confirming price trends in major indices and spotting any divergences that may indicate a reversal.
You can also use it to monitor market breadth, which refers to the number of stocks participating in the market rally or decline. Additionally, it can provide you with a heads-up on any upcoming reversals.
So, go ahead and make it your new best friend in the world of trading!
FAQ
What is the best software for charting the A/D line?
The best software for charting the A/D line is TradingView, or TrendSpider, both offer powerful analysis tools and a wide selection of indicators, charts, and drawing tools.
How do you interpret the advance-decline line?
To interpret the advance-decline line, look for the A/D line rising, as it indicates strong buying pressure from investors, and if the line is declining, it suggests more selling pressure.
What is a good advance-decline ratio?
An advanced-decline ratio of one or higher is generally regarded as good, indicating more advancing stocks than declining ones. During exceptionally bullish days, the ratio can surpass three, signifying remarkable strength.
What does a rising advance-decline line indicate?
A rising advance-decline line indicates strong buying pressure from investors. This usually means that more stocks are increasing in price than decreasing, which is a positive sign for the overall market.
What does a falling advance-decline line indicate?
A declining A/D line suggests more selling pressure and potentially declining market prices. It means that more stocks are decreasing in price than increasing, which is a negative sign for the overall market. This could indicate bearish sentiment or a weakening trend amongst investors.
What are some alternatives to the advance-decline line indicator?
Other technical indicators that gauge market sentiment include the put/call ratio, volume, and on-balance volume. The put/call ratio measures the number of bearish versus bullish options traded in a given period.
When should I use the advance-decline line in trading decisions?
The advance-decline line is best used as a confirmation indicator to help verify the strength of a trend. t should be combined with other technical indicators, such as moving averages and Rate of Change. This will give you more confidence in your trading decisions.
Can I use the advance-decline line alone to make trading decisions?
Using the advance-decline line as a stand-alone trading indicator is not recommended. The indicator has limitations and should be used with other indicators to confirm the strength of a trend or the likelihood of price movements.