The Directional Movement Index (DMI) is a technical analysis indicator that helps traders gauge the strength of price movements in the market.
The DMI comprises two lines: the Positive Directional Indicator (+DI) and the Negative Directional Indicator (-DI). Together, they form a system that can indicate market direction.
My testing, based on 9,764 trades over 25 years, demonstrates that the DMI indicator is both profitable and reliable, outperforming the S&P 500 index. Here’s how to trade it based on the data.
Key Takeaways
- The DMI assists in evaluating the strength and direction of market trends.
- Incorporating the +DI and -DI crossover into this trading strategy is important.
- ADX values are used to assess the presence and strength of a trend.
- My 25-year test on the Russell 1000 stocks showed a total return of 2,023% versus the S&P 500’s 881%.
The +DI and -DI are derived from the Average Directional Index (ADX), a smoothed average of the difference between the +DI and -DI over a specified period. Traders analyze these indicators to decide on market entry and exit points; a rising ADX could suggest a strong trend, while the crossing of the +DI and -DI can signal trend changes.
Understanding DMI Indicator
When interpreting the DMI indicator, it is vital for traders not only to monitor the direction of the DI lines but also to consider the value of the ADX. A high ADX value usually indicates a strong trend, whereas a low ADX suggests a weak trend or a trading range. By integrating the DMI into their trading strategies, traders can better analyze market conditions, enhancing their ability to make informed trading decisions.
Key Concepts and Components
The DMI is part of a larger system called the Wilder’s Directional Movement System, and it comprises two lines:
- +DI (Plus Directional Indicator): This reflects the strength of the upward price movement. It is calculated by comparing the current high to the previous high and is smoothed over an average period of 14 days.
- -DI (Minus Directional Indicator): This indicates the strength of downward price movement by comparing the current low to the previous low, smoothed over the same average period.
You will also encounter the Average Directional Index (ADX), derived from the smoothed averages of the difference between +DI and -DI. It indicates how strong the trend is by rising as it strengthens, regardless of whether it is upward or downward. The value of the ADX typically ranges from 0 to 100, where values above 25 might suggest a strong trend, while values below this threshold could indicate a weaker trend or market consolidation.
Try the DMI Indicator on TradingView
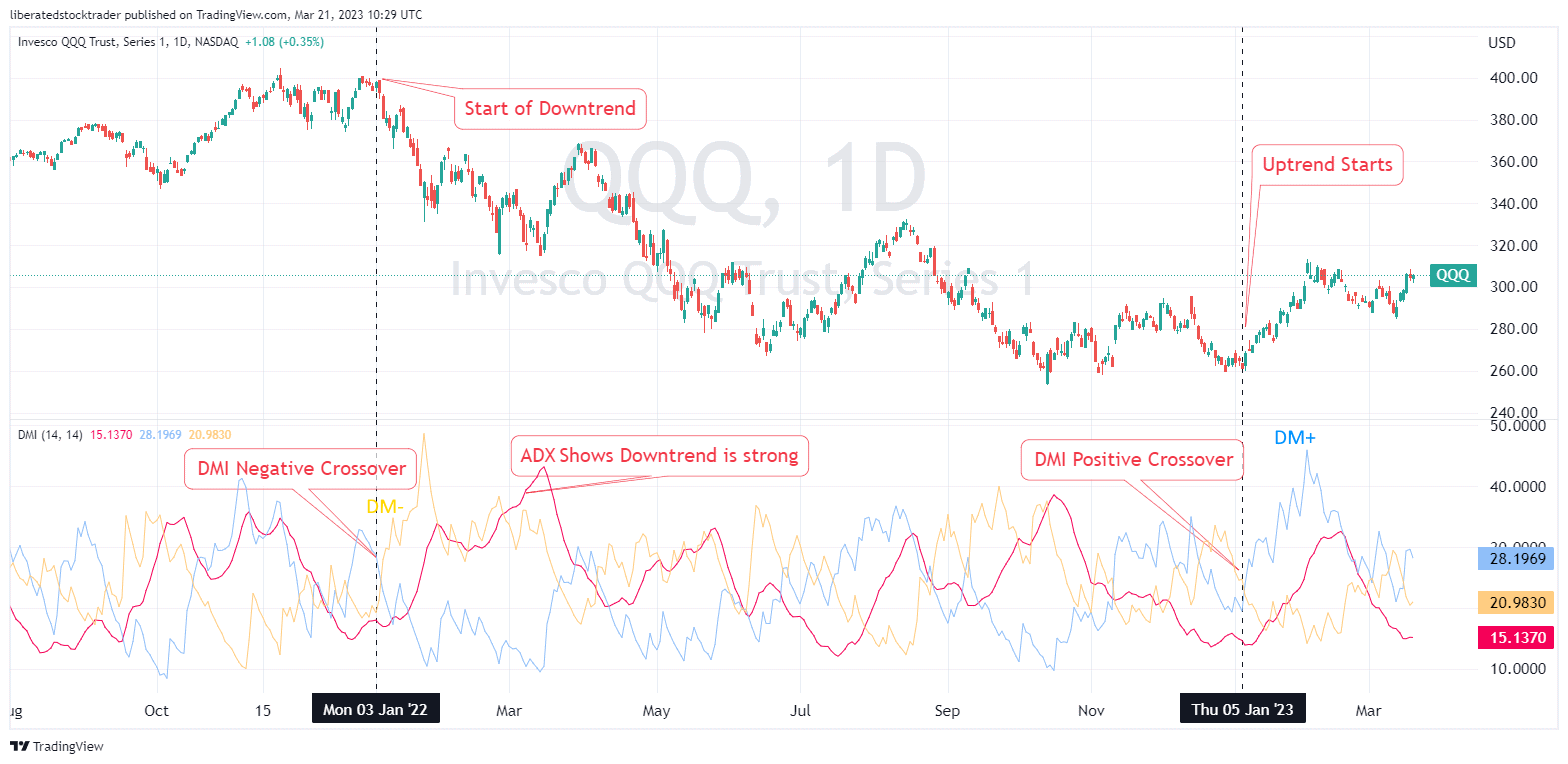
In your analysis, you can ascertain possible changes in trend direction by looking at the crossover of the +DI and -DI lines. When the +DI rises above the -DI, it can point to a potentially strengthening upward trend. Conversely, a strengthening downward trend may be indicated if the -DI rises above the +DI.
TrendSpider 4.8/5⭐: My Pick for AI-Power & Auto-Trading
I’ve used TrendSpider for 7 years for my research and testing. It auto-detects trendlines, patterns, and candlesticks, backtests ideas, and lets you use AI to create unique strategies and launch trading bots—with no code.

Components of the DMI
The Directional Movement Indicator (DMI) comprises several intricate components, each measuring different aspects of market direction and strength. Understanding these parts is crucial for assessing price movements’ overall trend quality and intensity.
Positive Directional Movement (+DI)
+DI reflects the presence of upward price momentum. It is calculated by comparing the current high with the previous high and is considered positive when the current high is higher than the previous one. The result is then smoothed and divided by the True Range, an indicator representing the current period’s maximum range of price movement, to obtain the +DI value.
Negative Directional Movement (-DI)
-DI indicates downward price momentum. It is obtained by comparing the current low to the previous low, with the value being positive when the current low is lower than the previous one. The True Range also smoothed and normalized this value to produce the -DI value. You can compare -DI with +DI to determine the dominance of bullish or bearish market pressure.
Directional Movement Index (DX)
The DX measures the strength of the price trend over a given period. It is calculated by taking the absolute value of the difference between +DI and -DI, divided by their sum. The resulting figure is presented as a percentage, where higher values indicate stronger upward or downward trends.
Average Directional Index (ADX)
The ADX serves as a summary of the overall trend strength. It is derived by smoothing the DX over an extended period, typically 14 days. A rising ADX suggests a strengthening trend, while a falling ADX points to a weakening trend. The value of the ADX also helps you determine the overall market environment: ranges typically below 25 indicate weak or no trend, while values above 25 imply a strong directional trend.
Interpreting DMI Indicator
The DMI (Directional Movement Index) Indicator is a tool to gauge a price trend’s direction and strength. Understanding how to interpret this indicator is crucial for making informed trading decisions.
Analyzing DMI/ADX Values
The Average Directional Index (ADX) is a key component of the DMI Indicator, providing a numerical value representing trend strength. Values range from 0 to 100:
- 0-25: Indicative of a weak or non-trending market
- 25-50: Suggests a strong trend
- 50-75: Represents a very strong trend
- 75-100: Signals an extremely strong trend
When the ADX value is above 25, it typically suggests that a trend is worth your attention for trading strategies.
DI Crossovers and Trade Signals
The DMI comprises two complementary indicators: the Plus Directional Indicator (+DI) and the Minus Directional Indicator (-DI). Crosses between these indicators serve as potential trade signals:
- +DI crossing above -DI: This can be a buy signal; this crossover may indicate that an uptrend is gaining strength.
- -DI crossing above +DI: This can be a sell signal; this could signal that a downtrend is becoming dominant.
As a trader, you should look for these crossovers as they can suggest a shift in trend direction and provide opportunities for entering or exiting trades.
Trend Strength Indications
Evaluating trend strength is an essential application of the DMI Indicator. The combination of ADX with +/-DI lines helps you assess this:
- ADX is rising while +DI is above -DI, Indicating a strengthening uptrend.
- ADX is rising while -DI is above +DI, Pointing to a strengthening downtrend.
When the ADX value is declining, it might indicate that the current trend is weakening, and the market could be entering a sideways or consolidating phase. In such cases, the signal-to-noise ratio decreases, and you might be more cautious with trading decisions.
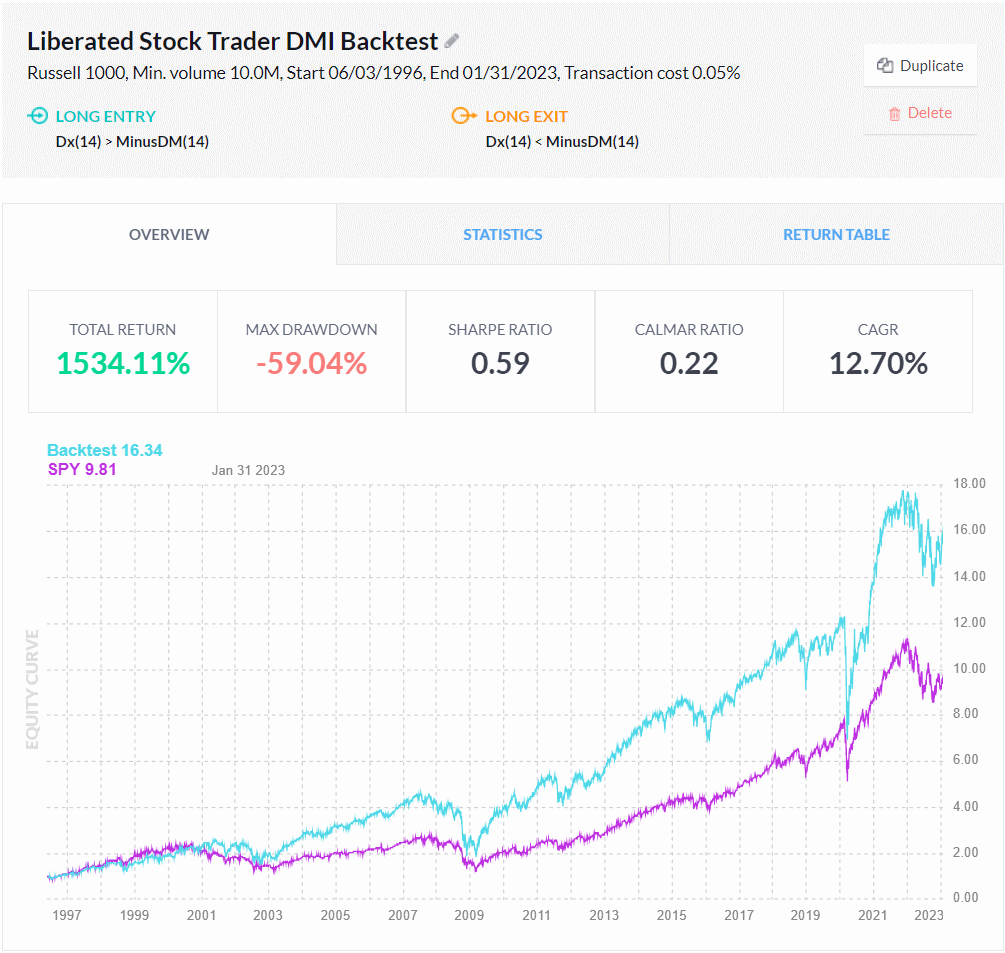
☆ My Backtesting Results: DMI+ & DMI- Crossovers ☆
Using Finviz Elite, I conducted a 10-year test on all stocks on the Russell 1000, which equated to 9,764 trades. The results show the ADX(14) crossing the value 20 is the more profitable setting.
- LONG ENTRY = Dx(14) > MinusDM(14)
- LONG EXIT = Dx(14) < MinusDM(14)
| DMI Performance Results | Backtest | SPY |
| CAGR | 13.68% | 10.4% |
| Total Return | 2,023% | 881% |
| Max Drawdown | -0.59% | -0.55% |
| Sharpe Ratio | 0.64 | 0.53 |
| Calmar Ratio | 0.23 | 0.19 |
| Volatility | 21% | 19.67% |
| Number of Trades | 9,764 | 1 |
| No. Positive Days | 3,665 | 3,669 |
| No. Negative Days | 3,047 | 3,043 |
| Best month | 22.4% | 12.7% |
| Worst month | 22.6% | -20.12% |
Testing Criteria: Russell 1000, Min. volume 10.0M, Start 06/03/1996, End 01/31/2023, Transaction cost 0.05%
The backtest results for the DMI(14)+ crossing over the DMI(14-)- reveal a top-performing strategy. This approach achieved an impressive Compound Annual Growth Rate (CAGR) of 13.68%, resulting in a total return of 2,023%.
Despite a maximum drawdown of -59%, the strategy demonstrated a Sharpe Ratio of 0.64 and Calmar Ratio of 0.23. The volatility stood at 21%, with 48,369 trades, 1,381 positive days, and 1,158 negative days.
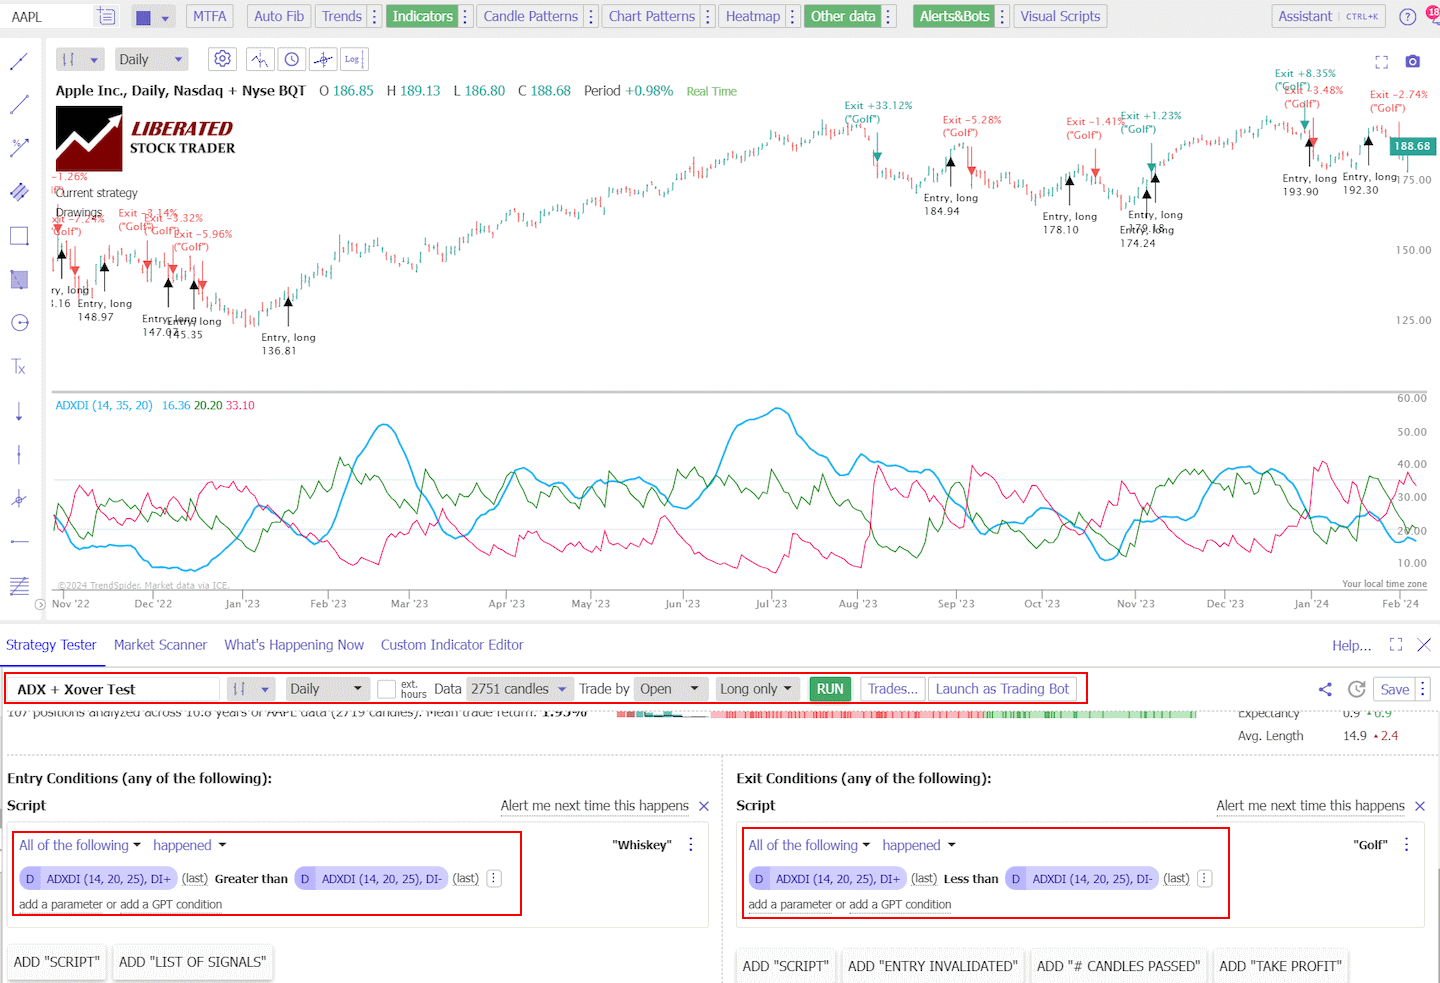
☆ Backtesting DMI with TrendSpider ☆
TrendSpider provides incredibly granular point-and-click backtesting functionality, enabling powerful strategy development. It is my favorite tool for auto trading, backtesting, and systematic trading.
To set up indicator backtesting in TrendSpider, follow these steps.
- Register for TrendSpider.
- Select Strategy Tester.
- Entry Condition > Add Script > Add Parameter > Condition > Indicator > ADX (14)+ > ADX(14)-.
- Sell Criteria, select > Add Script > Add Parameter > Condition > Indicator > ADX(14)+ < ADX(14)-.
- Finally, click “RUN.”
Backtest Your Strategies on TrendSpider Now
Do you want to test any indicator, chart pattern, or performance for any US stock? The award-winning TrendSpider software makes it easy! My Trendspider review unveils insights into discovering the most powerful trading strategy development and testing service.
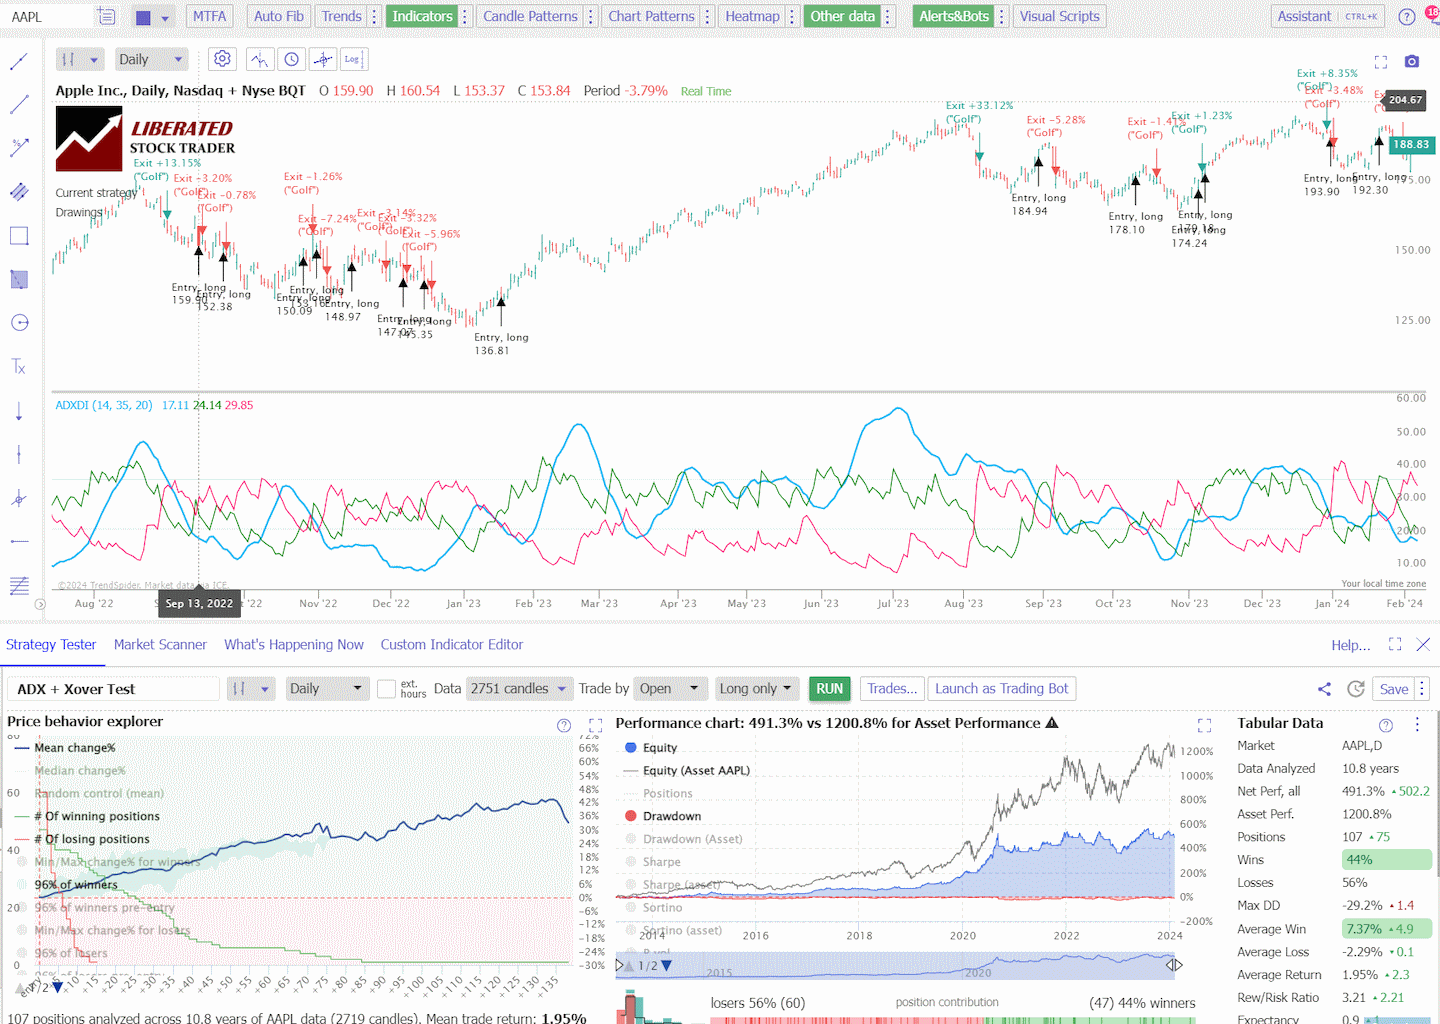
☆ DMI Backtesting Results with TrendSpider ☆
The backtesting data covers 316 years. During this period, a total of 3,773 positions were taken based on the DMI indicator. Of these positions, only 36% resulted in wins, while 64% ended in losses. The maximum drawdown (DD) experienced during the testing period was -37%.
On average, the winning positions yielded a return of 4.4%. Conversely, the losing positions had an average loss of -2%. Overall, the average return from all positions taken was 0.3%, which is quite low.
| DMI Indicator Testing | Results |
| Data (Years) | 316 |
| Positions | 3773 |
| Wins | 36% |
| Losses | 64% |
| Max DD | -37% |
| Max DD (Asset) | -47% |
| Average Win | 4.4% |
| Average Loss | -2% |
| Average Return | 0.3% |
| Rew/Risk Ratio | 2.20 |
| Expectancy | 0.15 |
The reward-to-risk ratio (Rew/Risk) for the DMI strategy was 2.20. The expectancy, which measures the average amount won or lost per trade, was 0.15.
These results indicate that the DMI indicator has historically produced mixed performance on the DJ-30 stocks. While it generated wins in only 36% of the positions, the average return from the winning trades was higher than the average loss from the losing trades.
Traders should consider these factors when incorporating the DMI indicator into their trading strategies.
Backtest Your Strategies on TrendSpider Now
☆ Backtesting DMI with Finviz ☆
The best month yielded 22.6% returns, while the worst yielded a loss of -20.12%.
Mass backtesting entire indexes like the S&P 500 or Russell 3000 takes a few seconds with FINVIZ Elite. While Finviz does not provide granular buy and sell trading signals for your backtest, it does bulk backtesting incredibly effectively.
Get FinViz Elite Backtesting & Screening
Is the DMI a Reliable and Profitable Indicator?
Yes, according to my testing, DMI is a profitable indicator. My 25-year testing suggests the ADX+(14) crossing above ADX-(14) has outperformed the S&P 500 yielding 2,023% vs. 881%.
Practical Application of DMI
The Directional Movement Index (DMI) is a tool that can enhance your technical analysis by indicating the strength of price movements. Utilizing DMI effectively can help you make more informed trading decisions.
Charting with DMI
When charting with DMI, you’ll typically see two primary lines: the Positive Directional Indicator (+DI) and the Negative Directional Indicator (-DI). Your ability to discern trend direction hinges on the interplay between these two lines.
For example, when the +DI crosses above the -DI, it often signals an upward trend, inviting a potential buy decision. Conversely, if the -DI crosses above the +DI, a downward trend may come into play, suggesting it might be time to sell.
- Upward Trend Signal: +DI > -DI
- Downward Trend Signal: +DI < -DI
Additionally, the Average Directional Index (ADX) component of the DMI can help you determine the trend’s strength. An ADX reading above 25 typically indicates a strong upward or downward trend.
Time Frames and Asset Types
You can apply DMI across various time frames and asset types, including stocks, commodities, and other securities. Whether you are a day trader looking at minute charts or a long-term investor analyzing monthly charts, the DMI adapts to your time frame.
- Short-term Trading: Use minute or hourly time frames.
- Long-term Analysis: Use daily, weekly, or monthly charts.
This flexibility also extends to trading platforms, where DMI can be integrated to help you visualize trends and make decisions based on your investment horizon.
Managing False Signals with DMI
False signals are an inherent part of trading, but with DMI, you can mitigate their impact. One strategy is to look for confirmation from a swing high or swing low before acting on DMI signals. For instance, if DMI indicates an upward trend but the price chart shows a recent swing low not broken by subsequent price action, you may want to wait for further confirmation.
Another method is to combine DMI with other indicators. This can provide a more robust market view, increasing your confidence in the signals provided.
- Swing Confirmation: Validate DMI signals with recent swing highs and lows.
- Indicator Confluence: Pair DMI with other indicators for stronger signal confirmation.
These practical applications of DMI will enable you to refine your trading strategy and potentially increase the accuracy of your market entry and exit points.
Analyzing Market Conditions
When using the Directional Movement Index (DMI), it’s crucial to determine the current market conditions. This involves assessing whether the market is trending or ranging, understanding potential signs of divergence and reversals, and evaluating volatility and consolidation patterns.
Identifying Trending vs. Ranging Markets
Examine the Average Directional Index (ADX) within the DMI to determine if the market is trending. A rising ADX indicates an uptrend or downtrend is strengthening, while values below 25 often signal a lack of a strong trend, suggesting a ranging market. Look for DI+ above DI- to identify a potential uptrend and for DI- above DI+ for a possible downtrend.
Understanding Divergence and Reversals
Awareness of divergence between the price momentum and the DMI can signify an impending reversal. If the price makes a new high while the DI+ and ADX decline, it may indicate a bearish reversal. Conversely, a bullish reversal might be anticipated if the price makes a new low, but DI- and ADX rise.
Assessing Volatility and Consolidation Patterns
High price volatility often corresponds with a high ADX value, indicating a strong trend. In contrast, during periods of consolidation, the ADX tends to flatten or decline, and the DI+ and DI- lines often move closer together or intertwine, reflecting the indecision in the market. Assessing these elements can help you anticipate potential breakouts.
Combining DMI with Other Indicators
Comparing DMI to other technical indicators like Moving Averages (MA), Relative Strength Index (RSI), or Bollinger Bands offers a multifaceted view of market conditions. Unlike MAs that focus on price trends and averages, the DMI includes both trend direction and strength:
- DMI vs. MA: While Moving Averages provide insight into trend direction, the ADX component of DMI specifies trend strength, distinguishing it from the non-directional character of simple MAs.
- DMI vs. RSI: RSI primarily measures the speed and change of price movements, identifying overbought or oversold conditions. DMI, through ADX, helps understand trend strength, which RSI does not directly indicate.
- DMI vs. Bollinger Bands: Bollinger Bands gauge market volatility and overbought or oversold conditions by using standard deviation as a measure, whereas DMI focuses on trend direction and strength, which is not a focal point for Bollinger Bands.
While no single indicator should be used in isolation, combining DMI with these can offer you a more robust analytical framework. Sabrina Jiang and other market analysts often use a combination of these tools to enhance the precision of their trading strategies.
FAQ
What is the best software for trading DMI and ADX?
To effectively trade DMI and ADX indicators I recommend TrendSpider or TradingView. TrendSpider has powerful point-and-click backtesting and auto-trading bot integration. TradingView has a powerful charting interface and a global trading community.
How is the Directional Movement Index (DMI) calculated?
To calculate the DMI, you must determine +DM, -DM, and the ADX. +DM is the current high minus the previous high, while -DM is the previous low minus the current low. After smoothing these values over a period, typically 14 days, you divide them by the Average True Range (ATR) to obtain the +DI and -DI. The ADX is a moving average of the DX, which compares the difference between +DI and -DI.
How do you interpret signals from the DMI in trading?
When the +DI line crosses above the -DI line, it may signal an uptrend, suggesting a potential buying opportunity. If the -DI line crosses above the +DI line, it can indicate a downtrend, potentially signaling a selling opportunity. The strength of the trend is gauged by the ADX line – higher values indicate a stronger trend.
What distinguishes the ADX from the DMI in technical analysis?
The ADX is a component of the DMI that specifically measures the strength of the trend, regardless of its direction, by averaging the expansion range of price over a specified period. In contrast, the DMI itself consists of two lines, +DI and -DI, which indicate the direction of the price movement and its strength.
What is the significance of DMI values in market trend analysis?
DMI values provide insights into market trend strength and direction. A high +DI value, compared to -DI, suggests a strong bullish trend, while the opposite signifies a strong bearish trend. An ADX value above 25 often indicates a strong trend, either bullish or bearish.
Who created the DMI indicator?
Welles Wilder introduced the DMI in 1978 in his book, "New Concepts in Technical Trading Systems." His innovative approach to market analysis has made the DMI a standard indicator featured on various trading platforms.
Appendix: Calculating DMI Components
The Directional Movement Index (DMI) is an indicator that measures the direction and strength of a price movement. To accurately utilize this tool in your technical analysis, you must understand its component calculations: +DI, -DI, DX, and ADX.
Calculating +DI and -DI
First, calculate the True Range (TR) for each period, which is the greatest of the following three values:
- Current high minus current low
- The absolute value of the current high minus the previous close
- The absolute value of the current low minus the previous close
Then, identify the Directional Movements for every period:
- Positive Directional Movement (+DM): Today’s high minus yesterday’s high, when higher than the negative movement.
- Negative Directional Movement (-DM): Yesterday’s low minus today’s low, when greater than the positive movement.
The +DI and -DI are calculated using a smoothed average of the respective Directional Movements divided by the TR, then multiplied by 100, which you often see represented by the formula:
+DI = (Smoothed +DM / Average TR) x 100
-DI = (Smoothed -DM / Average TR) x 100
Determining the DX
With +DI and -DI obtained, the next step is to use these values to find the Directional Movement Index (DX). The formula is:
DX = (|+DI – -DI| / |+DI + -DI|) x 100
This formula outputs a value that ranges between 0 and 100, indicating the strength of the directional movement. The absolute values ensure that DX is always positive.
Computing the ADX
Finally, the Average Directional Index (ADX) is derived by calculating the exponential moving average (EMA) of the DX values over a specified period, typically 14 days. The formula applied is:
ADX = EMA of DX over n periods
The resulting line fluctuates between 0 and 100, similar to DX, and is used to decipher the trend strength. A rising ADX line suggests a strengthening trend, while a falling ADX line implies a weakening trend.