The Average Directional Movement Index (ADX) is a moderately profitable technical analysis momentum indicator traders use to quantify trend strength.
Traders use the ADX to determine whether a market is trending and gauge the strength of that trend. A high ADX value usually indicates a strong trend, while a low ADX value suggests a weak trend.
We test ADX with the DMI derivative indicator on 5,000 years of data to discover the best settings and trading strategy.
Key Takeaways
- The ADX indicator measures trend strength without indicating direction.
- Values above 40 on the ADX scale indicate a strong trend, while below 20 signal a weak trend.
- Combining the ADX with other indicators can improve market analysis and trading decisions.
- Using the ADX DMI indicator, we have established that the indicator is profitable.
- Our testing shows an ADX(DMI + 14) setting crossing above 20 is a profitable buy signal, and crossing below 20 is a reliable sell signal. These settings resulted in an ADX 28% outperformance versus the S&P 500 stocks.
ADX does not indicate the direction of the trend but rather gauges the momentum by comparing the current price with previous prices.

Understanding how to interpret the values of the ADX indicator can significantly enhance your trading strategy.
Values below 20 often indicate a weak or non-existent trend, while values above 40 suggest a strong trend.
This information can be vital for deciding on market entry and exit points. Additionally, the ADX works well with other indicators, like RSI and ROC, providing a more comprehensive view of market conditions.
Understanding the ADX Indicator
The ADX Indicator, or Average Directional Index, is a technical analysis tool for gauging a trend’s strength. Developed by Welles Wilder, it is integral to many traders’ strategies and provides insights into market momentum and trend strength.
History and Development
In the late 1970s, Welles Wilder introduced the ADX Indicator to measure the strength of market trends. Wilder created ADX to quantify the momentum and directionality of price movements, thus aiding traders in distinguishing strong trends from weak ones.
ADX Indicator Chart Example
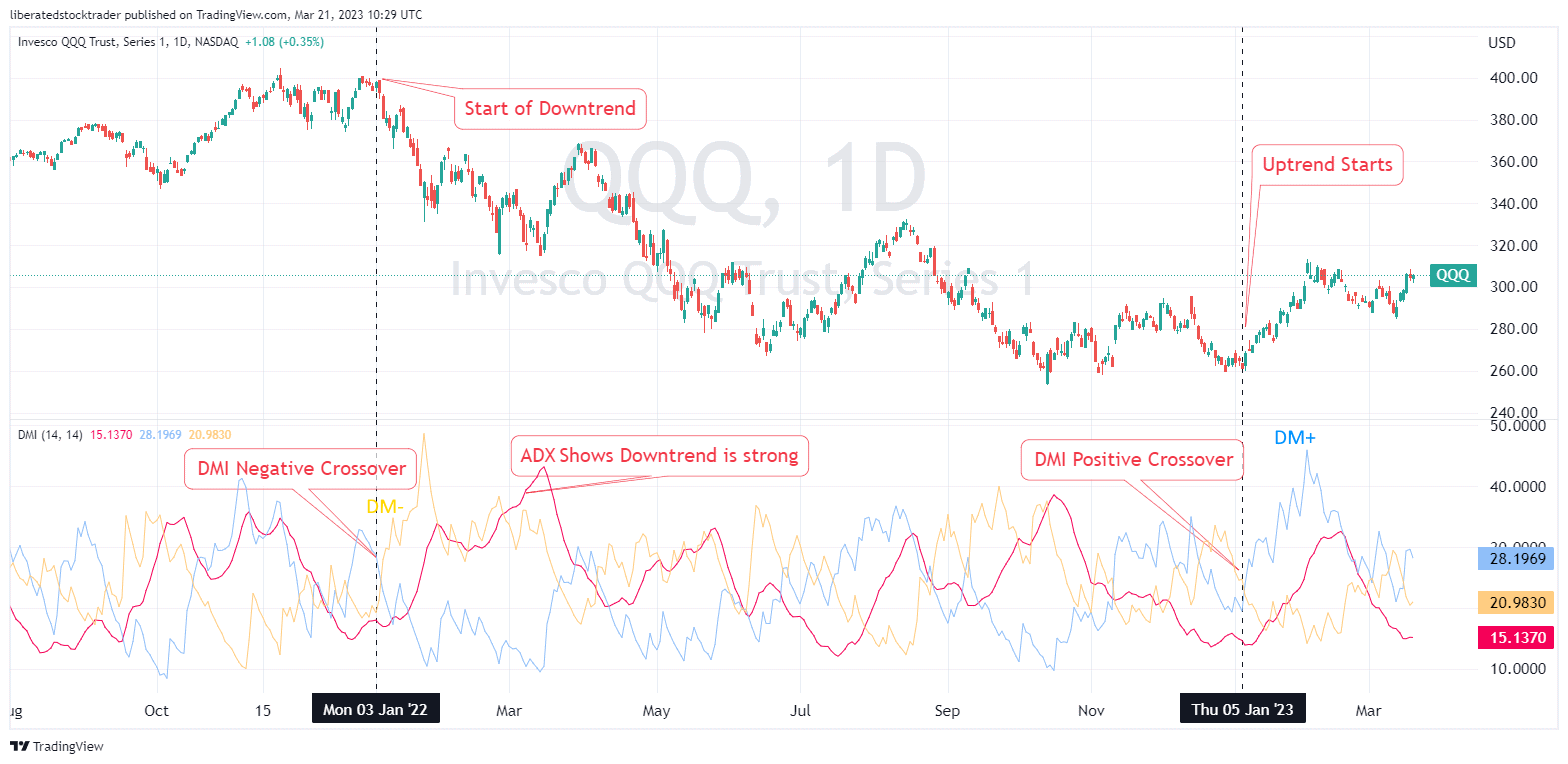
Try the ADX Indicator on TradingView
Components of the ADX Indicator
The ADX Indicator comprises three lines, which include:
- +DI (Positive Directional Indicator): This measures the strength of upward price movement.
- -DI (Negative Directional Indicator): This measures the strength of downward price movement.
- ADX Line: This represents the average of the DX values to determine the trend strength, regardless of the direction.
By comparing the +DI and -DI lines on a chart, you can sense the direction of the trend.
The Calculations Behind ADX
The ADX is calculated through a series of steps:
- Calculate the True Range (TR), which is the greatest of:
- Current high minus the current low
- The absolute value of the current high minus the previous close
- The absolute value of the current low minus the previous close
- +DM and -DM (Directional Movements) are derived by comparing the difference between consecutive highs and lows.
- The smoothed moving average of these directional movements and the true range are then calculated, usually over 14 periods.
- Use these smoothed values to calculate the +DI and -DI.
- The Directional Movement Index (DX) is obtained from the +DI and -DI values, and then finally:
- The ADX line is calculated by smoothing the DX values to produce the ADX line on the chart.
The formula to calculate the final ADX value is an intricate process. Still, it effectively provides a single line, typically plotted alongside the +DI and -DI, to indicate how strong or weak a trend is. A high ADX value signifies a strong trend, while a low ADX value can indicate a weak trend or a non-trending market.
Interpreting ADX Values
When analyzing the ADX indicator, you need to know that specific value ranges can indicate the trend’s strength, the ADX combined with +DI and -DI shows direction, and varying phases like consolidation or potential breakouts have particular ADX characteristics.
Trend Strength Analysis
The ADX (Average Directional Index) values are critical in determining the strength of a trend. Generally, a reading below 20 signifies a weak trend or consolidation phase, while a value above 25 indicates a strong trend. Here is a common interpretation of ADX values :
- Below 20: Weak trend or no trend (consolidation)
- 20 to 25: Some directionality, trend strength questionable
- 25 to 50: Strong trend
- Above 50: Very strong trend
Within the range of 25 to 50, the higher the ADX value, the stronger the positive or negative trend.
Directional Movement and ADX
The ADX forms part of the Directional Movement System, which includes two other indicators, +DI (positive directional indicator) and -DI (negative directional indicator). The relation between +DI and -DI helps in understanding the direction of the trend:
- When +DI is above -DI, the price movement is predominantly upwards, suggesting a potential buy signal.
- When -DI is above +DI, this indicates the price movement is mainly downwards, which might be a sell signal.
Interpreting the ADX in conjunction with +DI and -DI provides a clearer picture of trend strength and direction.
ADX and Market Phases
Evaluating the ADX can also help in identifying the market phases that might indicate potential trend changes, reversals, or breakouts:
- Consolidation: Periods with a low ADX value, typically below 20, often coincide with consolidation within the market.
- Trend Change or Reversal: An ADX rising from below 20 to above 25 can signal the beginning of a new trend, either a bullish or bearish reversal.
- Breakouts: A sudden increase in ADX values, particularly in conjunction with a breakout beyond a price range, can validate its strength and increase confidence in its sustainability.
By assessing these phases through ADX values, you can better predict and respond to potential shifts in market momentum.
Backtesting the ADX Indicator
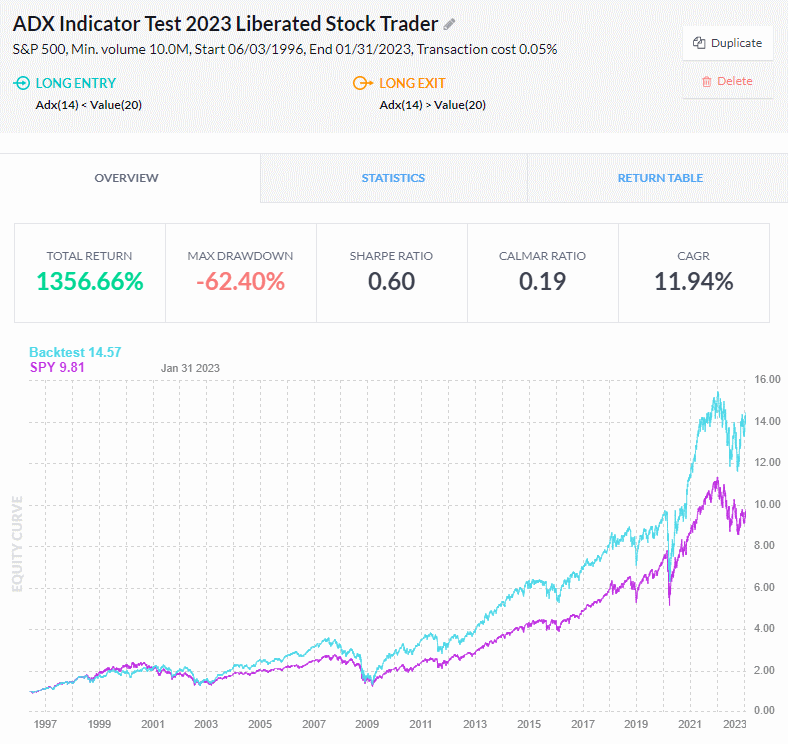
Using Finviz Elite, I conducted a 10-year test on all stocks on the S&P 500, which equated to 5,000 years of data. The results show the ADX(14) crossing the value 20 is a profitable setting.
ADX 14/20 Setting Test
- LONG ENTRY = ADX(DMI+ 14) < Value(20)
- LONG EXIT = ADX(DMI+ 14) > Value(20)
| ADX (DMI+ 14/20) Settings | ADX BACKTEST | SPY |
| CAGR | 11.94% | 10.44% |
| Total Return | 1356.66% | 881.00% |
| Max Drawdown | -62.40% | -55.19% |
| Sharpe Ratio | 0.6 | 0.53 |
| Calmar Ratio | 0.19 | 0.19 |
| Volatility | 19.77% | 19.67% |
| Number of Trades | 121,452 | 1 |
| No. Positive Days | 3,641 | 3,669 |
| No. Negative Days | 3,071 | 3,043 |
| Best month | 19.12% | 12.70% |
| Worst month | -24.20% | -16.52% |
SPY EQUAL WEIGHT
Testing Criteria: S&P 500, Min. volume 10.0M, Start 06/03/1996, End 01/31/2023, Transaction cost 0.05%
The results of the ADX 20 Setting Test backtest indicate that a strategy based on the ADX indicator had a CAGR (Compound Annual Growth Rate) of 11.94% when applied to the S&P 500, resulting in a total return of 1,356%. The maximum drawdown was -62%, with a Sharpe Ratio of 0.6 and a Calmar Ratio of 0.19. Volatility was 19%, with 121,452 trades, 3,641 positive days, and 3,071 negative days.
The best month yielded 19% returns, while the worst yielded a loss of -12,7%.
ADX 14/25 Setting Test
- LONG ENTRY = ADX(DMI+ 14) < Value(25)
- LONG EXIT = ADX(DMI+ 14) > Value(25)
| ADX (DMI+ 14/25) Settings | BACKTEST | SPY |
|---|---|---|
| CAGR | 14.09% | 13.82% |
| Total Return | 249.43% | 243.67% |
| Max Drawdown | -35.99% | -33.72% |
| Sharpe Ratio | 0.79 | 0.80 |
| Calmar Ratio | 0.39 | 0.41 |
| Volatility | 17.87% | 17.32% |
| Number of Trades | 42681 | 1 |
| No. Positive Days | 1387 | 1401 |
| No. Negative Days | 1152 | 1138 |
| Best month | 16.80% | 12.70% |
| Worst month | -17.45% | -12.49% |
S&P 500, Min. volume 10.0M, Start 01/01/2013, End 01/31/2023, Transaction cost 0.05%
Our backtest of the ADX 14/25 Setting Test applied to the SP-500 stock index showed a CAGR of 14.09% and a total return of 249.43%. The Sharpe Ratio of 0.79 and Calmar Ratio of 0.39 were reasonable. These gains are, at best, marginal versus the return of the S&P 500.
Backtesting Indicators with Finviz
Mass backtesting entire indexes like the S&P 500 or Russell 3000 takes a few seconds with FINVIZ Elite. While Finviz does not provide granular buy and sell trading signals for your backtest, it does bulk backtesting incredibly effectively.
Get FinViz Elite Backtesting & Screening
Backtesting with TrendSpider
TrendSpider provides incredibly granular point-and-click backtesting functionality, enabling powerful strategy development. It is my favorite tool for auto trading, backtesting, and systematic trading.
To set up indicator backtesting in TrendSpider, follow these steps.
- Register for TrendSpider.
- Select Strategy Tester.
- Entry Condition > Add Script > Add Parameter > Condition > Indicator > [indicator name] > [condition].
- Sell Criteria, select > Add Script > Add Parameter > Condition > Indicator > [indicator name] > [condition].
- Finally, click “RUN.”
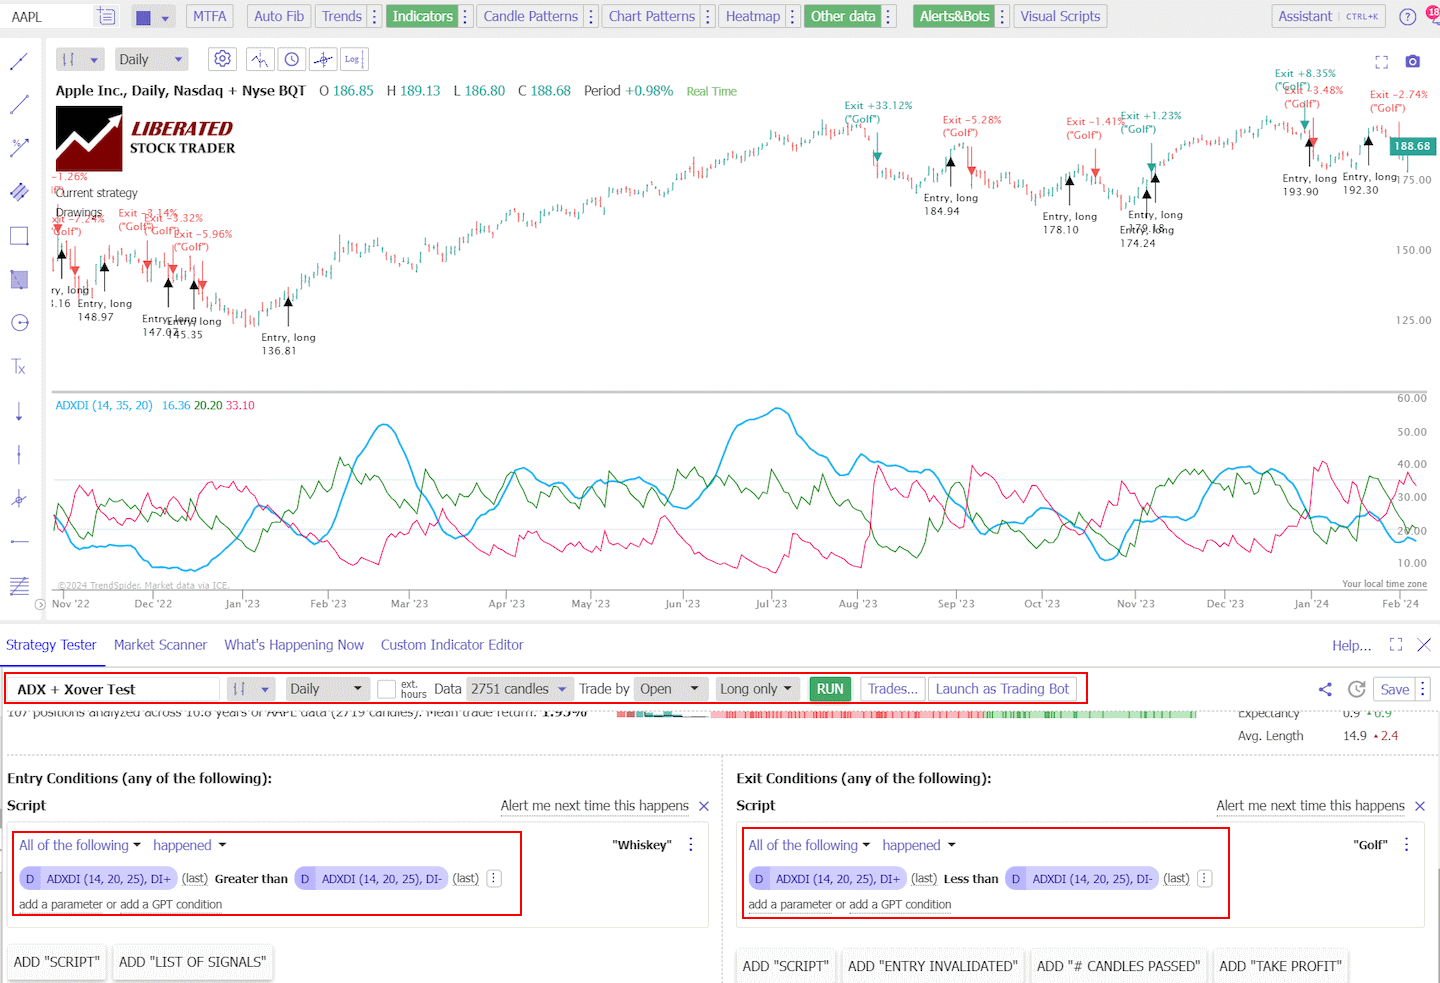
Backtest Your Strategies on TrendSpider Now
Do you want to test any indicator, chart pattern, or performance for any US stock? The award-winning TrendSpider software makes it easy! Our Trendspider review unveils insights into discovering the most powerful trading strategy development and testing service.
The Best ADX Settings
According to our in-depth testing, an ADX(DMI + 14) setting crossing above 20 is a profitable buy signal, and crossing below 20 is a reliable sell signal. These settings resulted in an ADX 28% outperformance versus the S&P 500 stocks.
Is the ADX a Reliable & Profitable Indicator?
Yes, ADX is a profitable indicator if configured correctly. Our 10-year testing suggests the ADX(14) crossing 20 has outperformed the S&P 500 over the last ten years.
ADX Indicator in Trading Strategies
The ADX indicator is a vital tool in trading strategies, offering clear insight into trend strength and potential entry and exit points.
Incorporating ADX into Technical Analysis
The Average Directional Index (ADX) is integral to your technical analysis as it quantifies the strength of a trend. When the ADX value is above 25, traders typically regard the market as trending, providing confidence in the trend’s stability.
Combining ADX with Other Indicators
Combine the ADX with other indicators, such as the Relative Strength Index (RSI) and Exponential Moving Averages (EMA), to refine your strategies. For example:
- RSI: Helps identify overbought or oversold conditions.
- EMA: Can signal trend direction and reversals.
This multi-indicator approach can yield more robust trade signals.
Entry and Exit Points with ADX
Utilize the ADX to pinpoint optimal entry and exit points. A rising ADX indicates increasing trend strength, suggesting a strong entry signal when accompanied by directional price momentum. Conversely, a declining ADX could signify a weakening trend, prompting consideration of exit strategies.
Money Management and Risk with ADX
Effective money management and risk assessment involve ADX as a gauge for placing stop losses. Should the ADX trend weaken, tightening your stop loss could protect your capital. Moreover, a strong ADX trend may provide the confidence to allocate more money to a position, adjusting risk management parameters accordingly.
Practical Tips for Using ADX
When applying the ADX (Average Directional Index) indicator, certain practices can enhance its effectiveness in trend trading. By selecting the appropriate time frame, reducing false signals, and adjusting modifiers for sensitivity, you can use the ADX indicator more effectively.
Time Frame Selection
Choosing the right time frame is crucial when utilizing the ADX indicator. For long-term trend analysis, a daily or weekly chart is more suitable. This allows you to view broader market trends and make more informed decisions. Conversely, an hourly or 4-hour chart may provide the immediate detail you need for shorter-term trading to spot quicker trend changes.
- Long-term trends: Daily/Weekly charts
- Short-term trading: Hourly/4-hour charts
Avoiding False Signals
The ADX can help you avoid false signals by filtering out potential whipsaws, which are sharp price movements that may not indicate a true trend. To reduce the likelihood of false signals, look for the ADX line above a certain threshold; commonly, a value above 20-25 suggests a stronger trend.
- Filtering criteria:
- ADX line above 20-25: Indicates a stronger trend
- ADX line below 20-25: Suggests caution, potential false signals
Modifier Adjustments for Sensitivity
Adjusting the settings of the ADX can increase or decrease its sensitivity to price movements. By altering the period setting, typically between 14 and 30, you can tailor the ADX’s sensitivity to meet your trading style or match the instrument’s volatility.
- Period adjustments:
- Increase periods (e.g., 30): Less sensitivity, smoother ADX line
- Decrease periods (e.g., 14): More sensitivity, more responsive ADX line
These practical tips can help you optimize your use of the ADX indicator and better understand trend direction and volatility.
Comparing ADX with Similar Indicators
When evaluating trading strategies, it’s useful to understand how the Average Directional Index (ADX) compares to other technical indicators in gauging trend strength and momentum.
The Relationship Between ADX and RSI
Average Directional Index (ADX) and Relative Strength Index (RSI) measure different aspects of market behavior. ADX focuses on trending strength, indicating how strong or weak a trend is on a scale from zero to 100.
On the other hand, RSI, which ranges from zero to 100, is used to signal overbought or oversold conditions. RSI primarily measures the speed and change in price movements, signifying momentum, while ADX is purely a trend strength indicator and does not indicate trend direction.
Your strategy might involve using RSI for entry or exit signals and ADX to confirm the trend’s robustness.
DMI vs. ADX: Understanding the Differences
The Directional Movement Index (DMI) consists of two components: the positive directional movement indicator (+DI) and the negative directional movement indicator (-DI). These components reflect the direction of the price movements. The DMI does not include ADX; however, they are often used together. ADX is derived from the DX, which calculates the difference between +DI and -DI as a percentage of the total price range.
As such, the ADX is essentially the smoothed average of the DX, giving you a clearer view of trend strength. Utilizing ADX alongside +DI and -DI can help you discern trend stability and strength more effectively.
ADX and the Aroon Indicator
The Aroon indicator and ADX both aim to identify trends. However, they have distinct mechanisms.
Aroon is designed to measure the time between highs and the time between lows, providing insights about potential changes in trends. It uses two lines, Aroon Up and Aroon Down, which move between zero and 100 to signal a trend’s start and strength.
The ADX measures the strength of a trend but does not predict its direction. The ADX simplifies the information given by Aroon’s complex time-based inputs into a single line trending within a zero to 100 range, making it possible to view trend strength more directly. Your decision-making might involve Aroon for timing and ADX for confirming the trend’s persistence.
Advanced Concepts and Analysis with ADX
The Average Directional Index (ADX) is pivotal in gauging trend strength and potential shifts in market sentiment. It offers advanced insights into divergence and the balance of supply and demand.
Divergence Between ADX and Price Action
When analyzing the ADX in relation to price action, you may encounter situations where the two do not move in sync. This condition is known as divergence. Divergence occurs when, for example, the ADX is trending upwards, indicating strengthening trend momentum, while the price action is flattening or moving downward, suggesting weakness in the price trend. This discrepancy can be a sign of potential trend reversal.
- Bullish Divergence: If the price is making lower lows, but the ADX shows lower negative directional movement (-DI) or an increasing ADX, this could indicate accumulating buying pressure.
- Bearish Divergence: Conversely, if the price is making higher highs while the ADX reveals lower levels of positive directional movement (+DI) or a decreasing ADX, it may signal rising selling pressure.
Market Sentiment and ADX
Market sentiment refers to investors’ overall attitude toward a particular security or the financial market as a whole. The ADX is instrumental in reading this sentiment through the lens of trend strength and tendencies in supply and demand.
- An ADX rising above 25 signifies a strong trend, which can indicate strong buying or selling sentiment influenced by the collective movements of market participants.
- Fluctuations in the ADX and corresponding changes in the +DI and -DI lines can help you understand shifts in market sentiment. An increasing +DI combined with a rising ADX might reflect bullish market sentiment, while an increasing -DI with a rising ADX could suggest bearish sentiment.
Integrating these advanced ADX concepts into your analytical toolkit can enhance your understanding of market dynamics and make more informed trading decisions.
FAQ
What is the best software for backtesting chart indicators?
TrendSpider gets my vote for the best backtesting software for retail investors. Powerful yet easy to use with point-and-click strategy testing, TrendSpider is a clear leader.
How can I interpret buy and sell signals from the ADX indicator?
The ADX indicator, when above 25, signals a strong trend; a rising ADX suggests trend strength, which can signal a continuation of buying or selling pressure. A buy signal is typically interpreted when the +DI line crosses above the -DI line, while a sell signal is considered when the -DI line crosses above the +DI line.
What are the optimal settings for the ADX indicator on a 5-minute chart?
For a 5-minute chart, using a 14-period setting for the ADX indicator is common. This setting provides a balance between short-term responsiveness and filtering out market noise. However, the optimal setting may vary based on your trading strategy and market conditions.
How does the ADX indicator differ from the ATR indicator?
The ADX indicator measures the strength of a trend, regardless of its direction, by comparing the highs and lows of consecutive periods. Conversely, the Average True Range (ATR) indicator measures market volatility by taking the maximum of the current high less the current low, the absolute value of the current high less the previous close, and the absolute value of the current low less the previous close.
Is the ADX a leading or lagging indicator in technical analysis?
The ADX is considered a lagging indicator in technical analysis as it is derived from moving averages of the price range over a given period. It does not predict future price movements but confirms trends once established.
What does a rising ADX value signify about market conditions?
A rising ADX value indicates an increase in trend strength. This can mean that the current market trend, either up or down, is getting stronger, suggesting that the existing direction of the price movement is likely to continue.
What are the best settings for ADX on a daily chart?
We tested 42,600 trades and the best ADX settings are using ADX(14) and a crossover value of 20. This generated improved trading reliability and a 10-year market outperformance of 28%