In technical analysis, the Aroon indicator identifies trend reversals and trend strength. I wanted to confirm if it is a profitable indicator or another worthless tool.
So, I backtested the Aroon indicator across the DJ30 stocks over 360 years, plus a 26-year S&P 500 test, equaling over 13,360 years of exchange data. I discovered the most profitable settings.
My data clearly shows that the optimal setting for the Aroon indicator is Aroon-25 on a 5-minute chart. This yielded a 47% win rate compared to a buy-and-hold strategy. Despite the average win rate, the profitable stocks performed exceptionally well.
What is the Aroon Indicator?
The Aroon Indicator was developed by technical analyst Tushar Chande in 1995. This indicator measures the strength of a trend and helps identify potential trend reversals. It does this by drawing two lines, one which shows up-trends and the other which shows down-trends.
When examining a chart, the Aroon lines indicate whether there is a strong uptrend or downtrend. It will also measure how long a trend has been in play and whether it’s weakening or continuing to be strong.
Key Highlights
- Aroon is an oscillating indicator with two lines: Aroon Up and Aroon Down.
- Aroon lines oscillate independently between 0 and 100.
- Aroon does not provide an edge with standard settings on a daily chart.
- Aroon has a 47% success rate based on multiple backtests using Aroon-25 on a 5-minute chart.
- Selecting the right stock for Aroon can produce large gains.
How to Trade Aroon
When using the Aroon indicator, traders can look for buy and sell signals from a crossover in the lines. When the Aroon Up line crosses above the Aroon Down line, it is considered a bullish signal, indicating that an uptrend may be beginning. Similarly, when the Aroon Down line rises above the Aroon Up line, it is considered a bearish signal, indicating that a downtrend may be beginning. Traders can use either of these signals to indicate entering or exiting a position.
These signal lines will be the basis of our testing of the Aroon indicator. See the chart below for details on Aroon buy and sell signals.
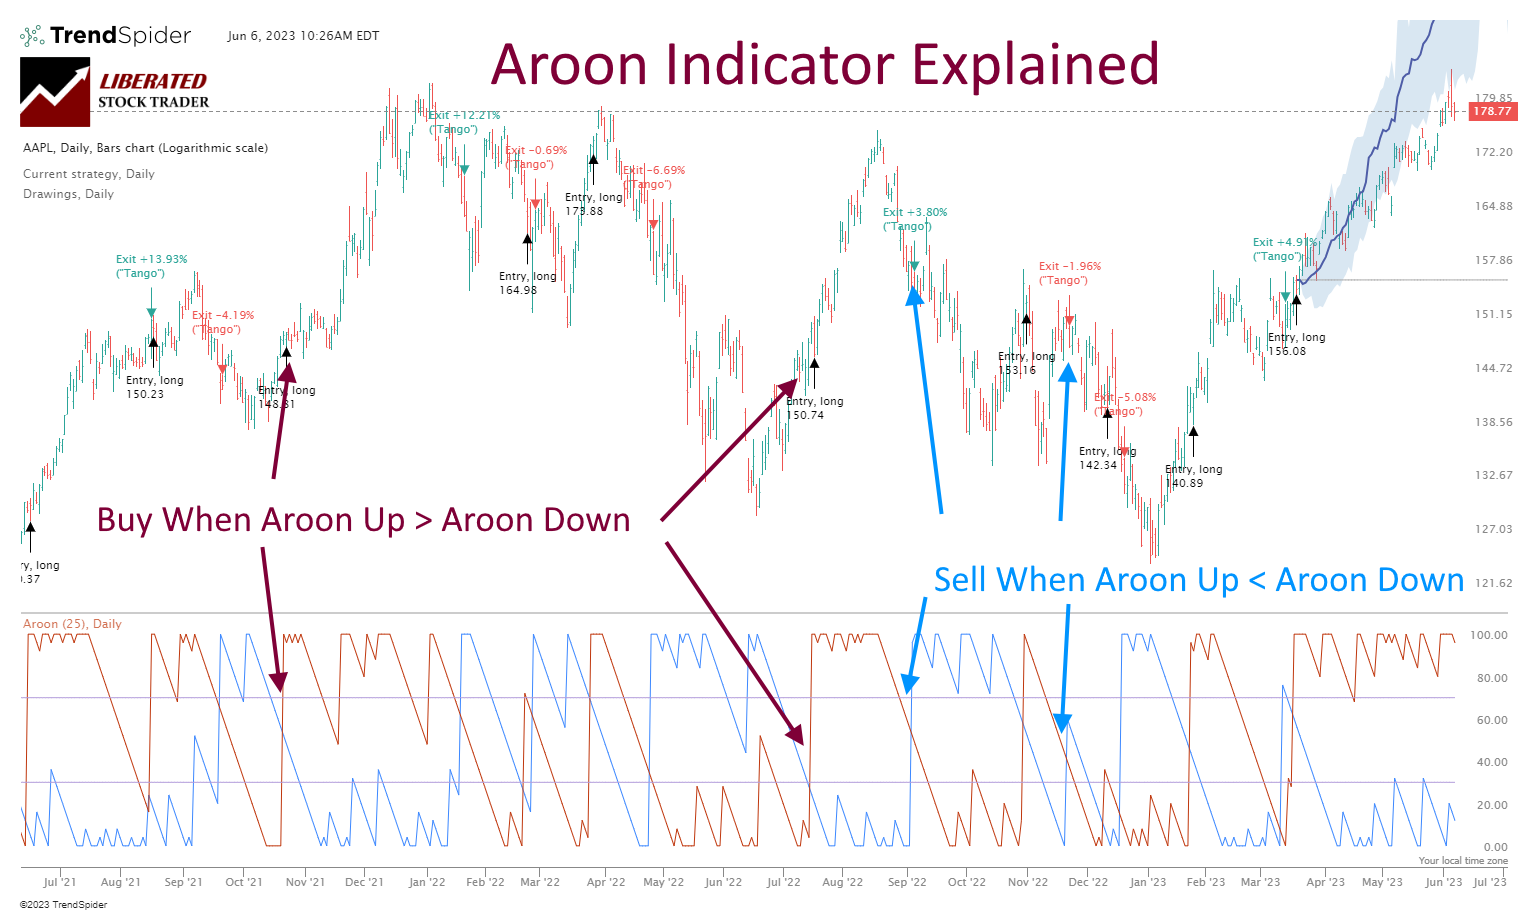
Chart Produced with TrendSpider
But the big question is whether the Aroon buy and sell signals are profitable, like the ROC indicator, or if the Aroon is another chart indicator that does not work, such as moving averages.
TrendSpider 4.8/5⭐: My Pick for AI-Power & Auto-Trading
I’ve used TrendSpider for 7 years for my research and testing. It auto-detects trendlines, patterns, and candlesticks, backtests ideas, and lets you use AI to create unique strategies and launch trading bots—with no code.

Save 38% to 45% on TrendSpider
Our Top Rated 4.72 ⭐ Trading Tool
✅ Leader in AI Trading & Chart Pattern Recognition
✅ Scanning & Auto-Trading
Deal Ends In:
How does the Aroon Indicator work?
The Aroon indicator works by plotting two lines on a chart, Aroon Up and Aroon Down:
• Aroon Up – This line measures the strength of an uptrend. It does this by looking at how many days have passed since a new high was set and then plotting that value on the chart.
• Aroon Down – This line measures the strength of a downtrend. It does this by looking at how many days have passed since a new low was set and then plotting that value on the chart.
The Aroon indicator is best used to identify potential trend reversals and determine when a trend is strong or weakening. When both lines are close together, it can indicate that a trend is weakening and may be about to reverse. A higher reading for either line indicates that the trend is strengthening.
The indicator can also help identify areas of support or resistance in advance, which can be used to place entry and exit signals. Lastly, the Aroon indicator can be used as a measure of momentum, allowing traders to identify potential breakouts or new trends. Knowing when to enter and exit a trade is crucial to successful trading, and using the Aroon indicator can help traders increase their profitability.
The Aroon Oscillator
Beyond just the crossovers in the lines, traders can also look for confirmation of buy and sell signals by analyzing the Aroon Oscillator. When the Aroon Oscillator rises above zero, it suggests that an uptrend is strengthening and can be used to confirm a buy signal. On the other hand, when the Aroon Oscillator drops below zero, this could be interpreted as a weakening downtrend, confirming a sell signal. Additionally, traders should consider the magnitude of the Aroon Oscillator when interpreting buy and sell signals. The bigger the distance away from zero, the stronger the trend.
Pros
The Aroon indicator is a reliable measure of trend strength and can be used to determine the direction of price movements. It can also provide helpful insight into potential reversals in market trends. The indicator is easy to use and provides traders with an effective way to identify signals for when to enter or exit positions.
Cons
The main drawback to using the Aroon indicator is its performance track record. Although the indicator is reliable in measuring trend strength, it can be prone to false signals, which could lead to losses. Additionally, the Aroon indicator only measures peaks and troughs in price action over a specific time frame and may miss out on potential opportunities if not used correctly. Finally, the Aroon indicator does not consider other factors, such as volume or support/resistance levels, which can provide additional information for trading decisions.
Overall, the Aroon indicator can be a helpful tool for traders looking to identify trend direction and strength in price action. However, it should not be used in isolation, and traders must combine the Aroon indicator with other analytical methods to make informed trading decisions.
Aroon Buy & Sell Signal Interpretation
When the Aroon Oscillator is above zero, this could be interpreted as a strengthening uptrend, confirming a buy signal. On the other hand, wh
The two lines of the Aroon indicator (up & down) are calculated separately and can offer valuable insight into a stock’s trend. For example, if both lines are rising, this suggests an increase in momentum and that the stock is entering a strong directional trend. The higher the value of the Aroon indicator, the stronger the trend is. If both lines are declining, this may indicate a weakening uptrend and confirm a sell signal. Additionally, if one line rises while the other falls, it could indicate that there is not enough momentum to continue in its current direction and could indicate a potential reversal.
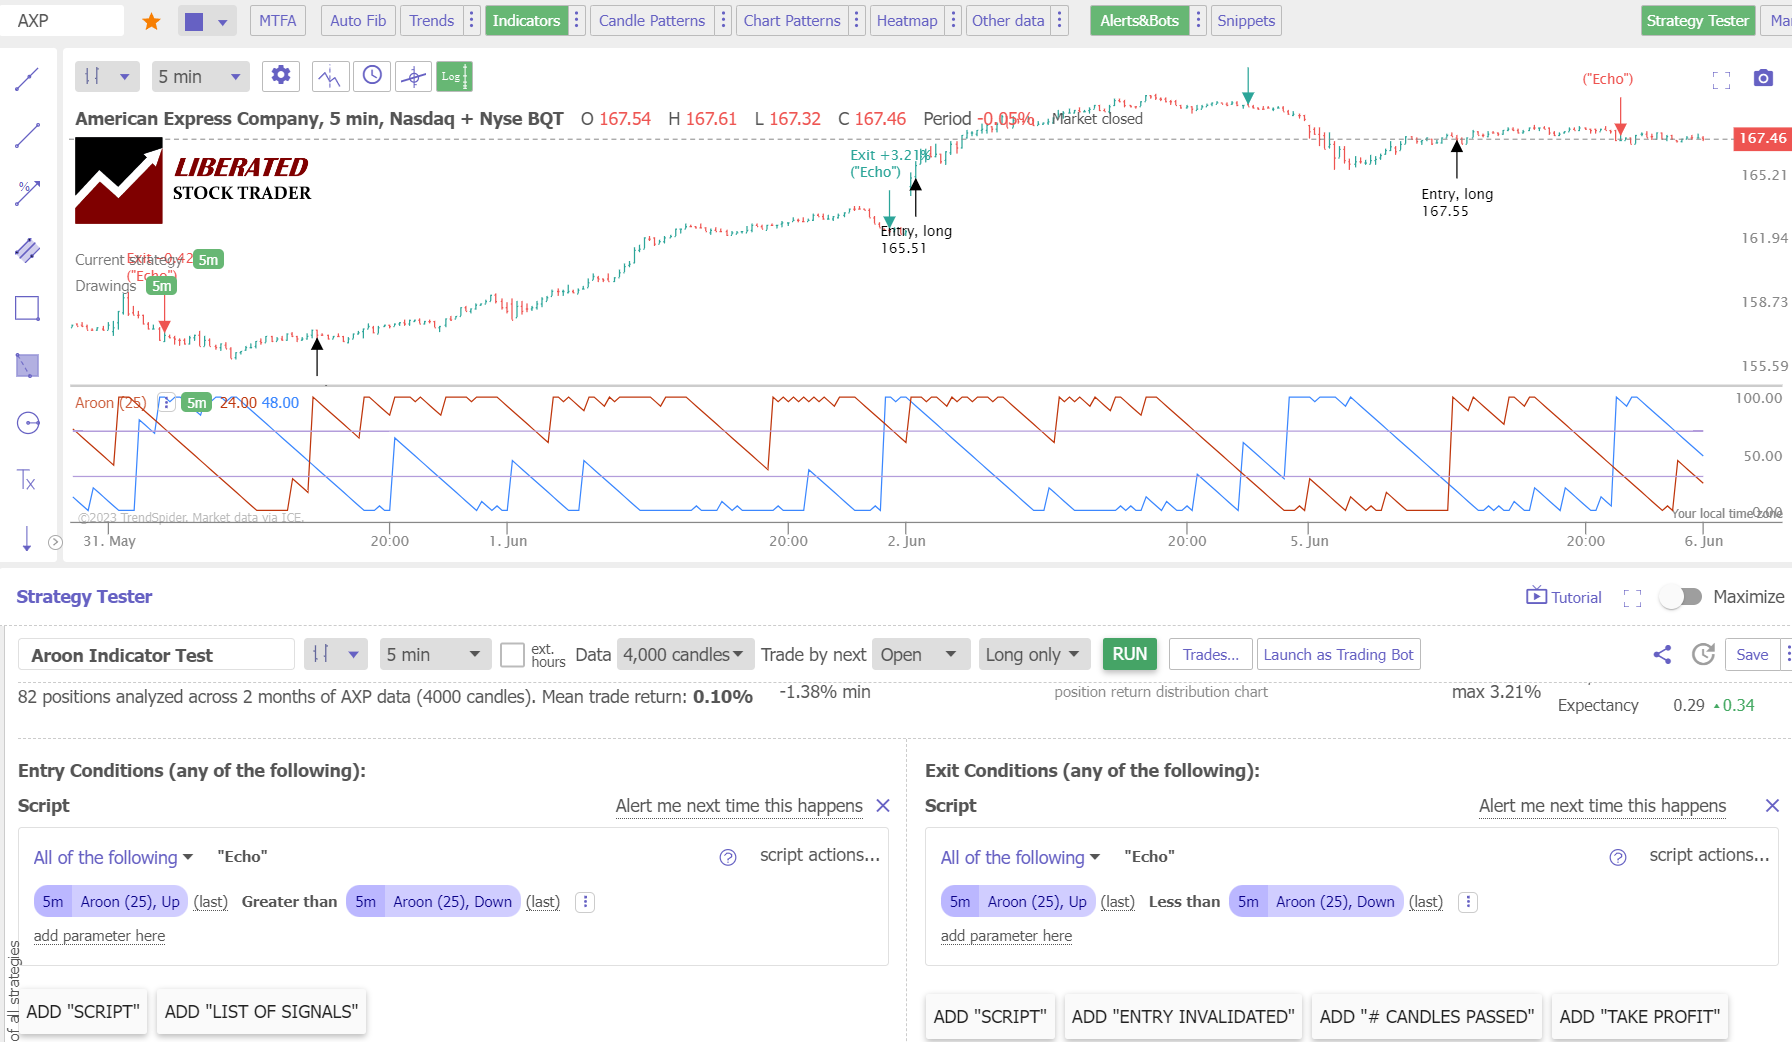
How to Set Up Aroon Backtesting
To set up Aroon backtesting in TrendSpider, follow these steps:
- Register for TrendSpider.
- Select Strategy Tester > Entry Condition > Add Script > Add Parameter > Condition > Indicator > Aroon (25) Up, Greater Than > Aroon (25) Down.
- For the Sell Criteria, select > Add Script > Add Parameter > Condition > Indicator > Aroon (25) Up, Less Than Aroon (25) Down.
- Finally, click “RUN.”
Backtest Your Strategies on TrendSpider Now
Want to test any indicator, chart pattern, or performance for any US stock? The award-winning TrendSpider software makes it easy! My Trendspider review unveils insights into discovering the most powerful trading strategy development and testing service.
Aroon Indicator Backtesting Results
I tested the standard configuration of Aroon 25 on the Dow Jones Industrial Average stocks on four timeframes: 1-minute, 5-minute, 1-hour, and daily charts, and the results were surprising. On a 1-minute chart, Aroon produced only a 27% success rate, and a 5-minute chart over two months produced a 47% win rate.
Interestingly, the standard setting of Aroon 25 on a daily chart, widely recommended by supposed experts, produced an incredibly poor 3% win rate.
| Aroon Indicator Test | OHLC Chart | Duration | % Winners | Avg # Trades |
|---|---|---|---|---|
| Setting 25 | 1-min | 20 Days | 27% | 92 |
| Setting 25 Best | 5-min | 2 Months | 47% | 89 |
| Setting 25 | 1-hour | 2 Years | 20% | 75 |
| Setting 25 | Daily | 12 Years | 3% | 55 |
| Average | 24% | 85 |
The Best Aroon Indicator Settings
My 360 years of TrendSpider backtests revealed conclusively that the best setting for Aroon is using Aroon-25 on a 5-minute chart. This produced a win rate of 47% versus a buy-and-hold strategy. That might not seem like more than a 50-50 chance of success. However, the profitable stocks were incredibly successful.
Next, I will show a selection of those successful trades.
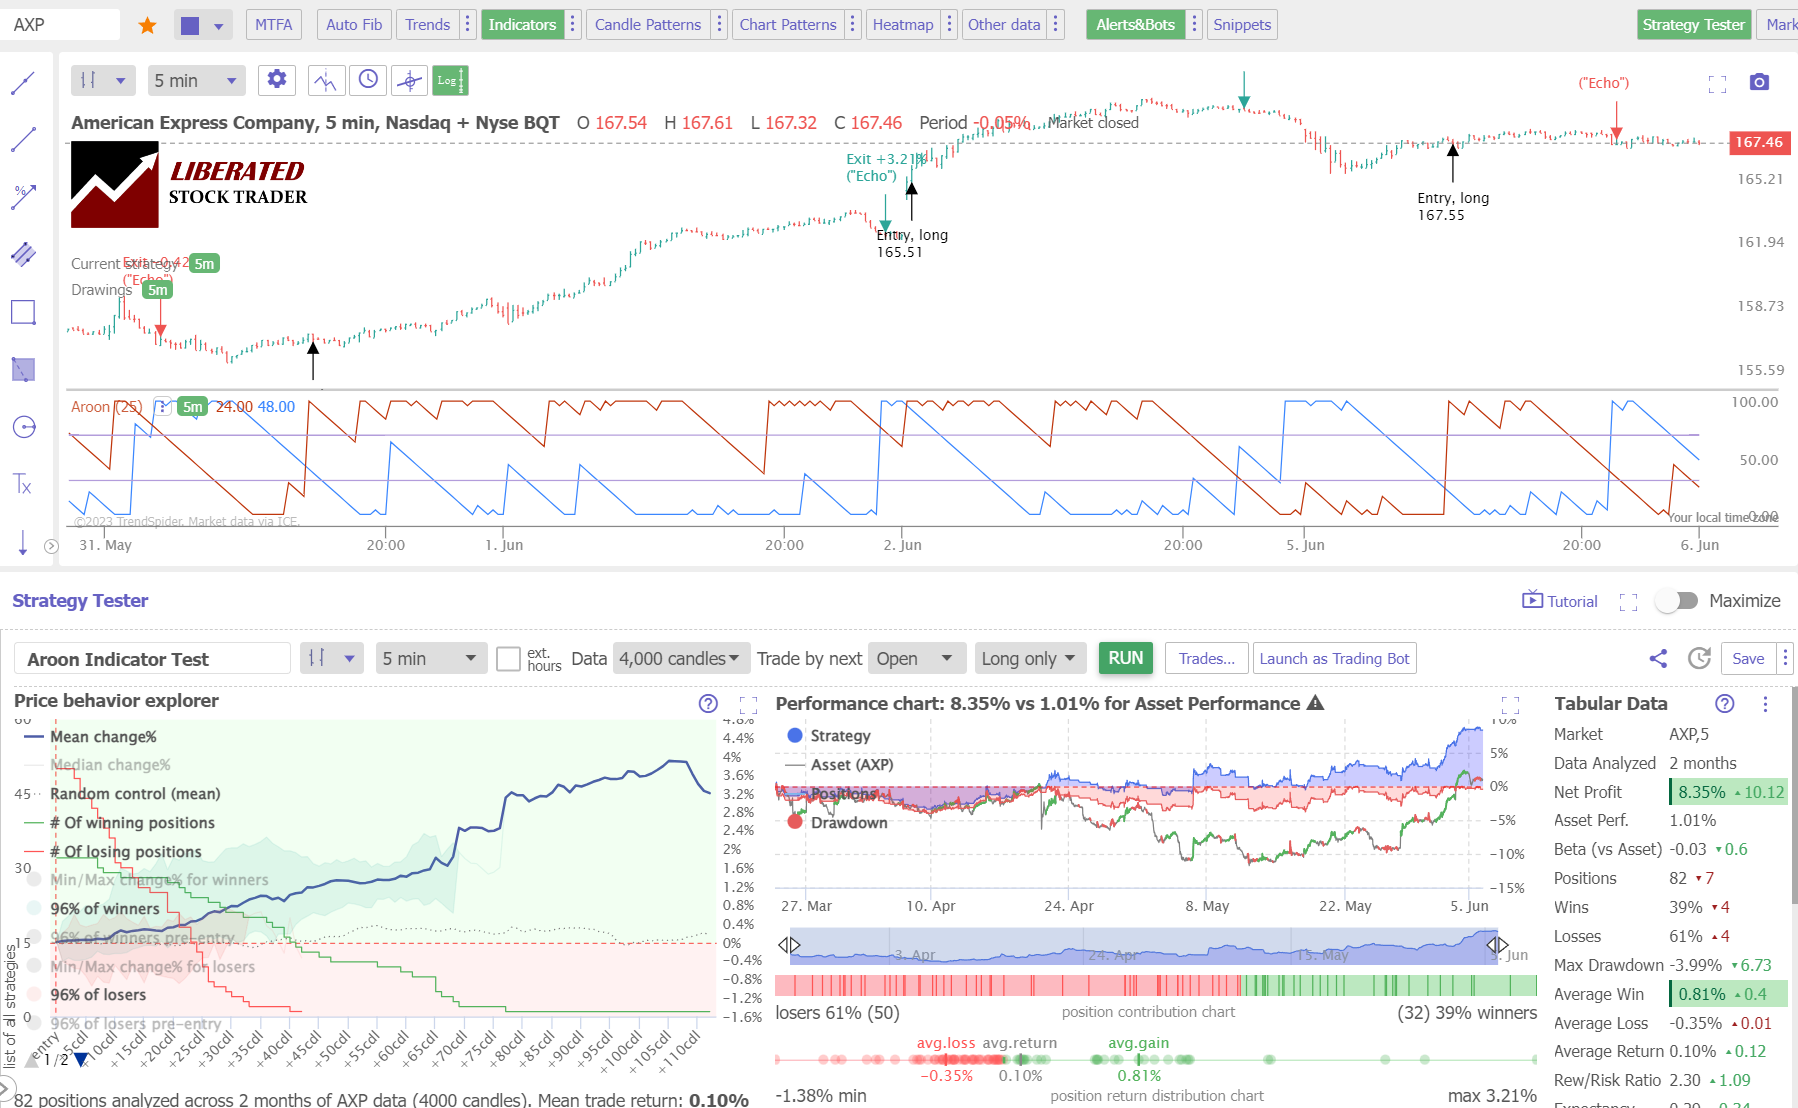
Aroon Indicator Test: 5-Minute chart
My testing of American Express Company (Ticker: AXP) on a 5-minute chart over two months shows an Aroon-25 strategy returning a profit of +8.35% versus the buy-and-hold return of 1.01%. There were 82 trades with an average win of 0.81% versus a loss of -0.35%. However, only 39% of trades were winners.
Backtest Powerful Strategies on TrendSpider Now
A 16-Year Aroon Test on a Daily Chart
My testing of Boeing (Ticker: BA) over 16 years shows the Aroon strategy returned a profit of +1329% versus a buy-and-hold return of 119%. This is a vastly superior return, with 49% of trades being winners and an average trade return of 11.2% versus losses of -5.7%.
This highlights the power of using tailored Aroon strategies for long-term investments and short-term trades. Furthermore, this is just one example of the strategies available to traders with the right tools.
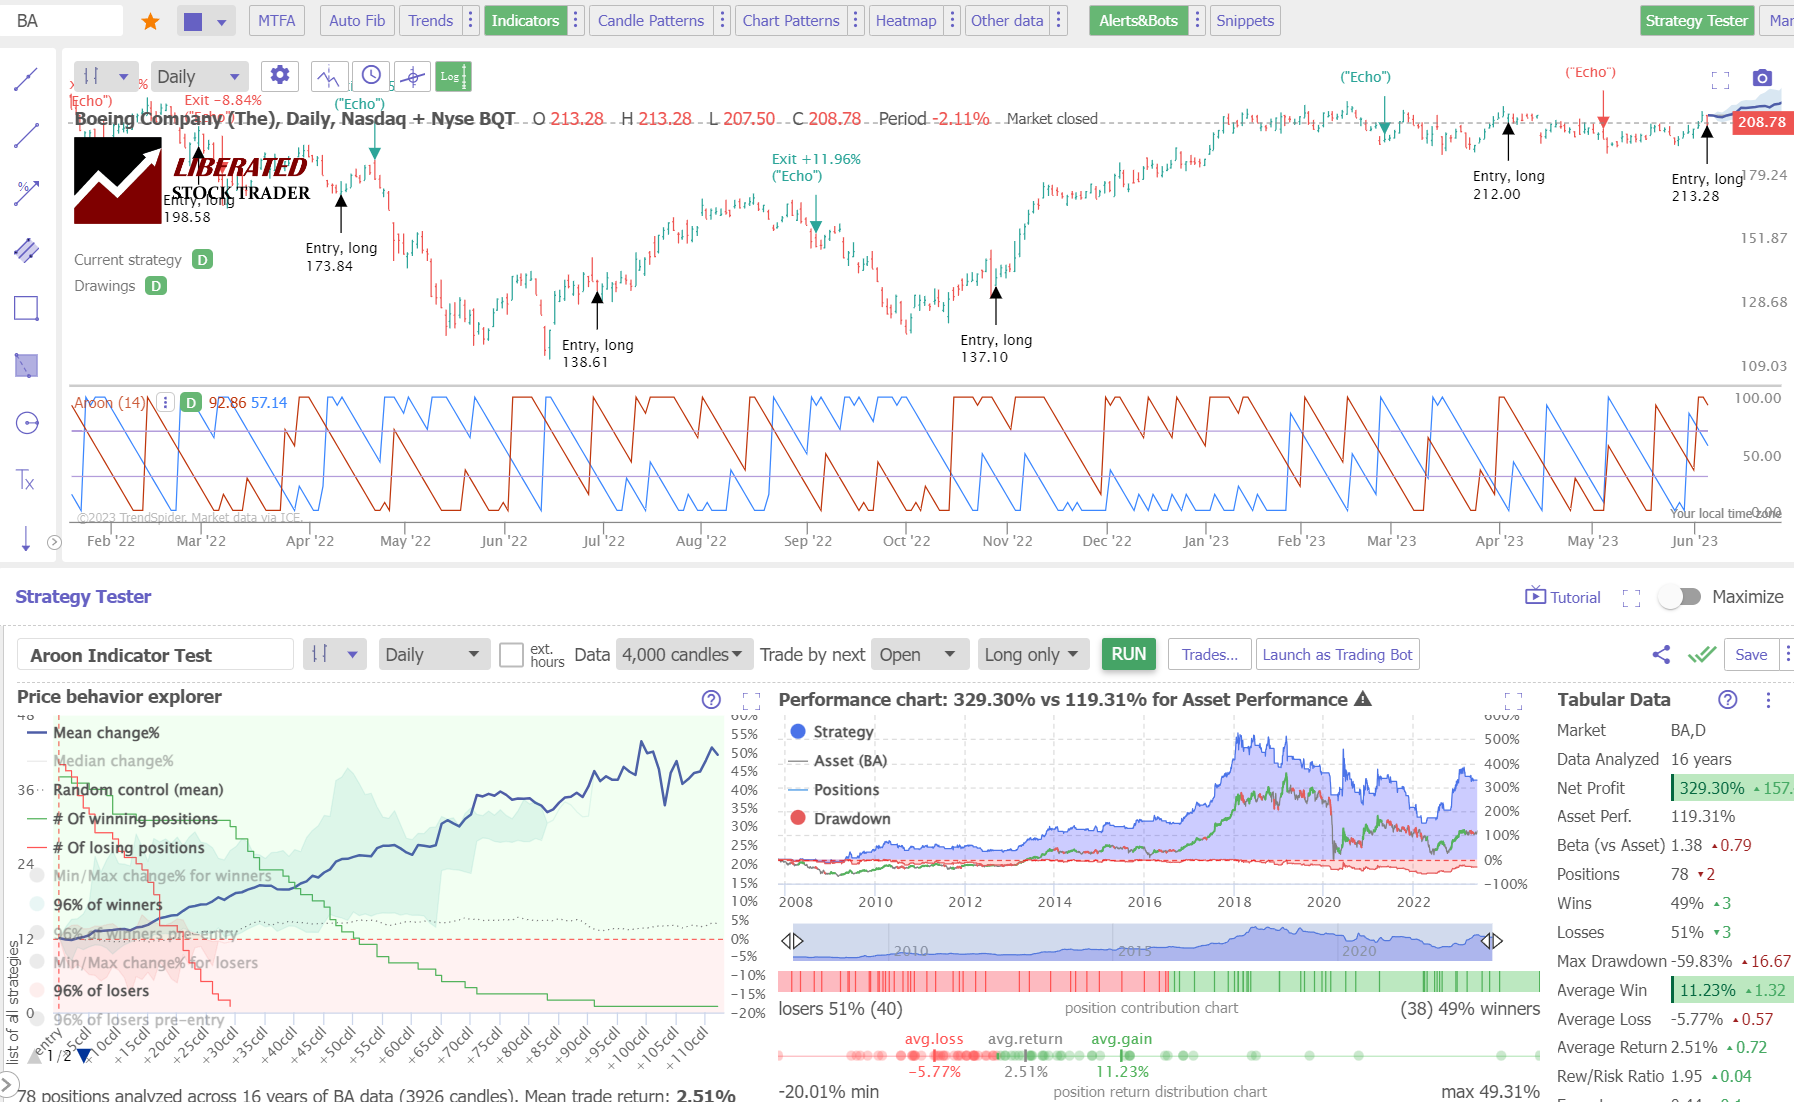
Aroon Indicator Backtest Results: Daily Chart.
Get Point & Click Backtesting on TrendSpider
Boost Your Trading with Automated Strategy Testing
Armed with the right strategy, you have a much better chance of success in stock trading. But what if there was a way to automate that strategy and take the guesswork out? With TrendSpider, you can do just that.
Using their strategy tester feature, you can backtest Aroon strategies and other popular indicators to see how they would have performed in the past. That way, you can get insights into your trading before entering a trade. Plus, you can automate those same strategies at any time frame with TrendSpider’s automated alerts and Bot system. Make sure to check out their feature-packed platform today!
How to Backtest Aroon Using FinViz Elite.
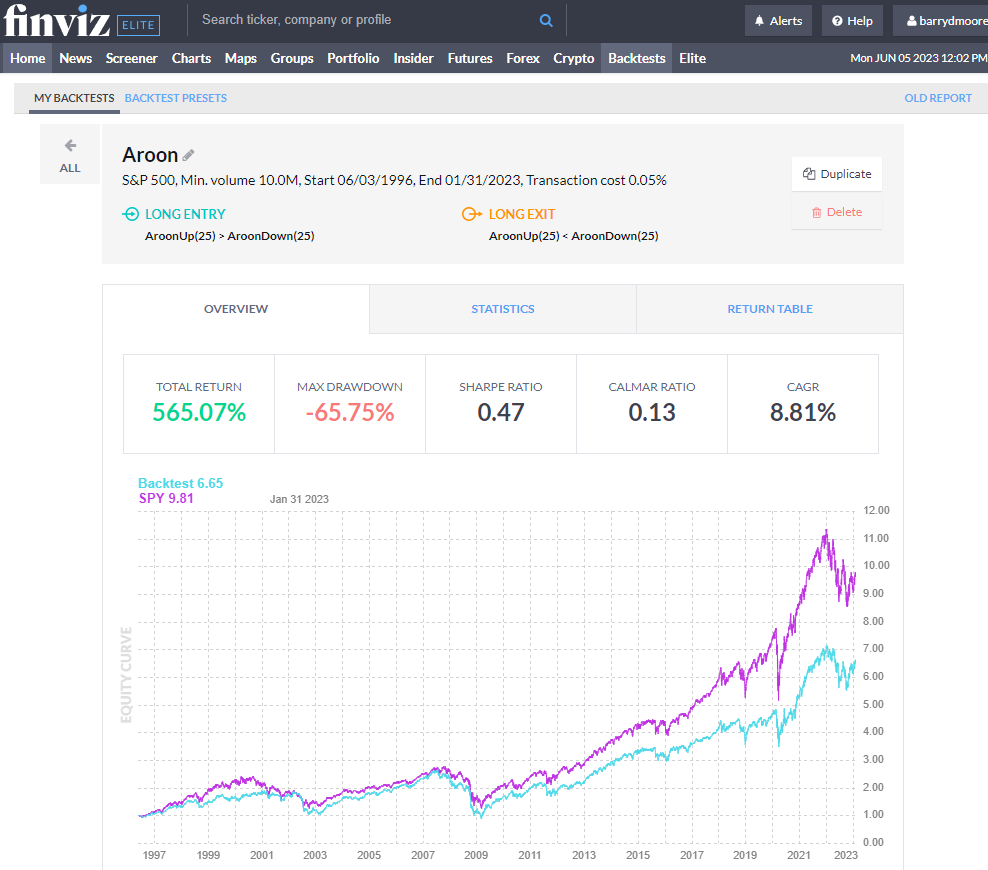
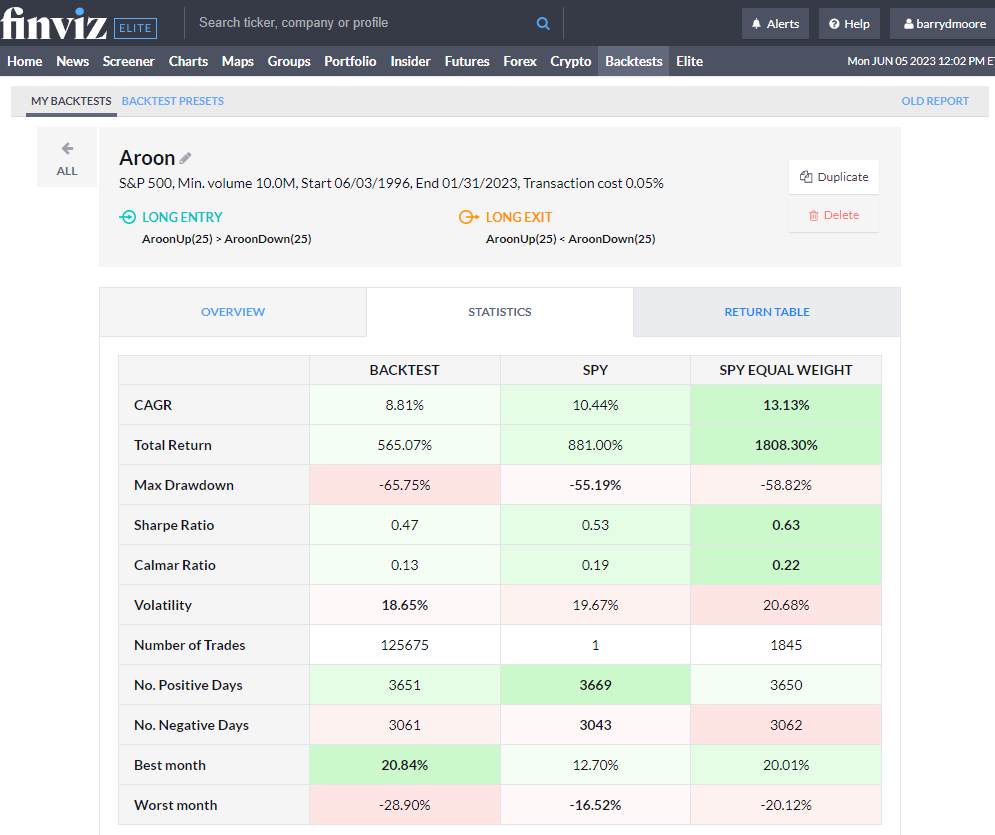
To set up Aroon backtesting in FinViz, follow these steps. Register for FINVIZ, select Backtests > Index=S&P500 > Entry When > Indicator > Aroon 25 Up > Greater Than > Aroon 25 Down. For the Sell Criteria, select Entry When > Indicator > Aroon 25 Up > Less Than > Aroon 25 Down. Finally, click “Run Backtest.”
Testing Aroon on the S&P 500 Index Over 26 Years.
To test the Aroon indicator on the largest US stocks in the S&P 500, I used the excellent backtesting solution provided by FinViz Elite. Finviz’s point-and-click backtesting engine allowed me to test Aroon-25 on a daily chart over the previous 26 years.
Here are the results.
Get FinViz Elite Backtesting & Screening
26-Year Aroon Indicator S&P 500 Results
The Aroon indicator with a 25 setting did not perform well on daily charts over 26 years. It made a total return of 565% versus a buy-and-hold strategy profit of 881%. There were 125,675 trades, of which 54% were winners; however, the losing days were very poor, leading to underperformance.
Get FinViz Elite Backtesting & Screening
Combining Aroon with Other Indicators
The Aroon indicator can be combined with other technical indicators to form a complete trading strategy. For example, using the MACD or Moving Average Convergence Divergence indicator, you can set up a strategy that buys when the Aroon 25 Up reaches positive values. At the same time, the MACD crosses above its signal line. Additionally, you can use the MACD’s Histogram to signal when a trade should be exited. Alternatively, you can try to combine Aroon with the Price Rate of Change or bullish chart patterns.
To test whether combining Aroon with other indicators is profitable, I suggest using TrendSpider, my recommended stock research and AI-powered trading software.
Can Aroon be used for Buy and Sell Signals?
Yes, my 13,360 years of data across the DJIA and S&P500 suggest the standard Aroon setting of 25 on a 5-minute chart is useful for identifying profitable buy and sell signals with a 47% success rate and 54% average winning trades. Beware, some of the losing trades will be larger, which weighs on the overall indicator performance.
Should You Use the Aroon Indicator?
Yes, my testing shows that using Aroon on its standard setting of 25 on a 5-minute chart is a profitable tool for trading, but you will need to combine it with a solid stop-loss strategy to reduce the size of losing trades. On a daily chart, it failed to beat the S&P 500 over 26 years.
Is the Aroon Indicator Accurate?
No, on 1-minute, hourly, and daily charts, the Aroon indicator is not accurate enough to be used as a standard indicator, as it failed to beat a buy-and-hold strategy. Over 26 years of testing, it produced a return of 565% versus a buy-and-hold strategy profit of 881%.
Limitations of Using Aroon
Aroon should not be used in isolation. It is best utilized when combined with different chart patterns and indicators. This will help you avoid false signals and larger losses. Additionally, when using the Aroon for buy and sell signals, ensure that stock volume confirms the validity.
How to Calculate the Aroon Indicator
Aroon is automatically calculated using the best charting software, such as TrendSpider or TradingView. But if you want to calculate Aroon yourself, read on.
To calculate the Aroon Indicator, traders must first find the maximum high over a given period (usually 25 days). The highest closing price in that period is divided by the total number of trading days. This calculation is repeated for the lowest low over the same period, and that value is divided by the total number of trading days. The result for the maximum high and lowest low is then subtracted from each other to form the Aroon Oscillator.
The Aroon indicator is calculated by subtracting the number of days since the most recent 25-day period high from the number of days since the most recent 25-day period low.
The Aroon Indicator Formula
Aroon is mathematically expressed as:
Aroon Up = (25 – Days Since 25-day High) / 25
Aroon Down = (25 – Days Since 25-day Low) / 25.
The resulting values are then used to generate a line graph representing the trend strength over a given period. The farther away each line lies from zero, the stronger the trend. If the lines are crossing, this indicates a weakening or reversal of the trend. The Aroon Oscillator is calculated by subtracting Aroon Down from Aroon Up and expressed as AO = Aroon Up.
Is the Aroon Indicator Reliable?
No, the Aroon chart indicator is not reliable or accurate. Based on my thorough backtesting of 30 major US stocks across 360 years, the likelihood of surpassing a buy-and-hold strategy is only 24%.
Summary
After testing 13,360 years of data, it’s safe to say that using Aroon as a trading indicator on candlestick charts is generally a losing strategy. Use this indicator on 5-minute charts, using the Aroon-25 setting to improve your chances of trading profitability.
The Aroon indicator is mainly used to identify potential tops, bottoms, and trend strength. It can be a valuable tool when combined with other technical indicators. However, it should not be the only indicator you use, as it has proven to underperform buy-and-hold strategies.
FAQ
Is the Aroon indicator good for trading?
No, our research shows that Aroon is a poor indicator on all timeframes from 1 minute to daily charts. Aroon produced a weak 24% average success rate versus a long-term buy-and-hold strategy. Our 12-year tests of the 30 Dow Jones Industrial Average stocks prove Aroon should be avoided.
What is the best setting for Aroon?
Our testing shows that the best setting for Aroon is 25 on an OHLC 5-minute chart which yields a 47% win rate. Aroon, on all other timeframes, underperformed the average stock market returns.
What indicators are better than Aroon?
Aroon is an unprofitable indicator, but others have higher success rates, such as Heikin Ashi charts, combined with the rate of change, RSI, and bullish chart patterns. Our testing has proven these indicators to be more effective, work on many timeframes, and are more successful in trading strategies.
Is Aroon the best indicator?
No, Aroon is a very poor indicator for trading, with a 53 percent failure rate; bullish chart patterns such as the Double Bottom have an 88 percent success rate.
What is the best timeframe for Aroon?
The best timeframe for Aroon is a 25 setting on a 5-minute chart, which produced a 47 percent win rate, according to independent testing. We conducted a 360-year backtest on 30 stocks and found Aroon-25 on a daily chart had a 97 percent failure rate.
How reliable is Aroon?
Aroon is an unreliable technical analysis chart indicator. Our 360 years of backtested data on 30 major US stocks show a 24% chance of beating a buy-and-hold strategy across all chart timeframes.
What is the best software for trading and testing Aroon?
Our in-depth Aroon trading analysis relied on TrendSpider - the industry-leading trading tool for backtesting and strategy development. Its power and simplicity impressed me, which made our research much more efficient and successful.
Which is better, Aroon or Moving Averages?
Aroon's low average success rate of 24% is still better than the moving average performance of 10% on standard OHLC charts based on 5,640 years of backtested exchange data. Our research indicates that an exponential moving average of 20 on a Heikin Ashi chart outperforms Aroon with an 83% success rate.
How to read the Aroon chart?
To read an Aroon chart, look for two lines, the Aroon Up and the Aroon Down. The Aroon Up line is a momentum indicator that measures bullish trends in the market, while the Aroon Down line is a measure of bearish trends. When both lines are close together, it indicates no clear trend in the asset.
What is the best software for Aroon indicator trading?
TrendSpider is by far the top software for trading and backtesting Aroon indicators; with point-and-click backtesting requiring no coding, it's a game-changer! TradingView is also good, offing pine code backtesting and global stock exchange, crypto, and forex coverage.
Is Aroon the same as a moving average?
No, Aroon is not the same as a moving average. There are four main moving averages; simple, exponential, weighted, and Hull. Aroon is an oscillating indicator with a different calculation and better performance.
Does Aroon work?
Yes, Aroon works reasonably well, but only with a specific configuration using Aroon-25 on a 5-minute chart. This setup is tested to have a 47% success rate on DJ30 stocks. All other standard settings on OHLC/candlestick charts are not profitable.
How accurate is Aroon?
The Aroon indicator is inaccurate, especially with a standard OHLC, Heikin Ashi, or candlestick chart. Our research indicates that Aroon has a 24 percent win rate. Exponential Moving Averages on a Heikin Ashi chart are more effective at 83 percent.
How to make money trading Aroon?
Making money using the Aroon is difficult. However, it is possible. The best way to succeed with Aroon is by using a specific setup tested for higher reliability. This involves using the Aroon-25 on a 5-minute chart and implementing a supporting strategy using a volume indicator.
Is Aroon effective for day trading?
No, Aroon is not effective for day trading. Our test results on 1-minute charts show a low success rate of 27 percent, and a 60-minute chart had a 20 percent success rate. You can develop and test your own original day trading Aroon strategy by backtesting with automated software.
You want to be a successful stock investor but don't know where to start.
Learning stock market investing on your own can be overwhelming. There's so much information out there, and it's hard to know what's true and what's not.

Liberated Stock Trader Pro Investing Course
Our pro investing classes are the perfect way to learn stock investing. You will learn everything you need to know about financial analysis, charts, stock screening, and portfolio building so you can start building wealth today.
★ 16 Hours of Video Lessons + eBook ★
★ Complete Financial Analysis Lessons ★
★ 6 Proven Investing Strategies ★
★ Professional Grade Stock Chart Analysis Classes ★