The Donchian Channels indicator in technical analysis helps traders understand market trends and potential price breakouts. It consists of three lines formed by taking the highest and lowest low of a predetermined number of periods, typically 20.
I backtested Donchian Channels with 360 years of stock exchange data. My results reveal that 35% of trades are profitable, with a reward-to-risk ratio of 2.4:1. Unfortunately, this means Donchian Channels show only a minimal profit expectation of 0.2. A profit expectancy ratio of 0.2 means traders can anticipate earning $0.20 for every dollar at risk.
The Donchian Channel’s low reward-to-risk ratio and a losing trade percentage of 65% mean it is not a reliable trading indicator.
Key Takeaways
- Donchian channels help identify market trends and price breakouts through the highest highs and lowest lows over a set period.
- The indicator is practical for setting stop-loss orders and determining strategic entry and exit points in trading.
- Our 4,887 test trades on 360 years of data suggest Donchian channels have a reward/risk ratio of 2.4.
- Trading Donchian Channels results in a very low 0.2 profit expectancy ratio.
- Based on our research, we do not recommend using Donchian Channels in trading.
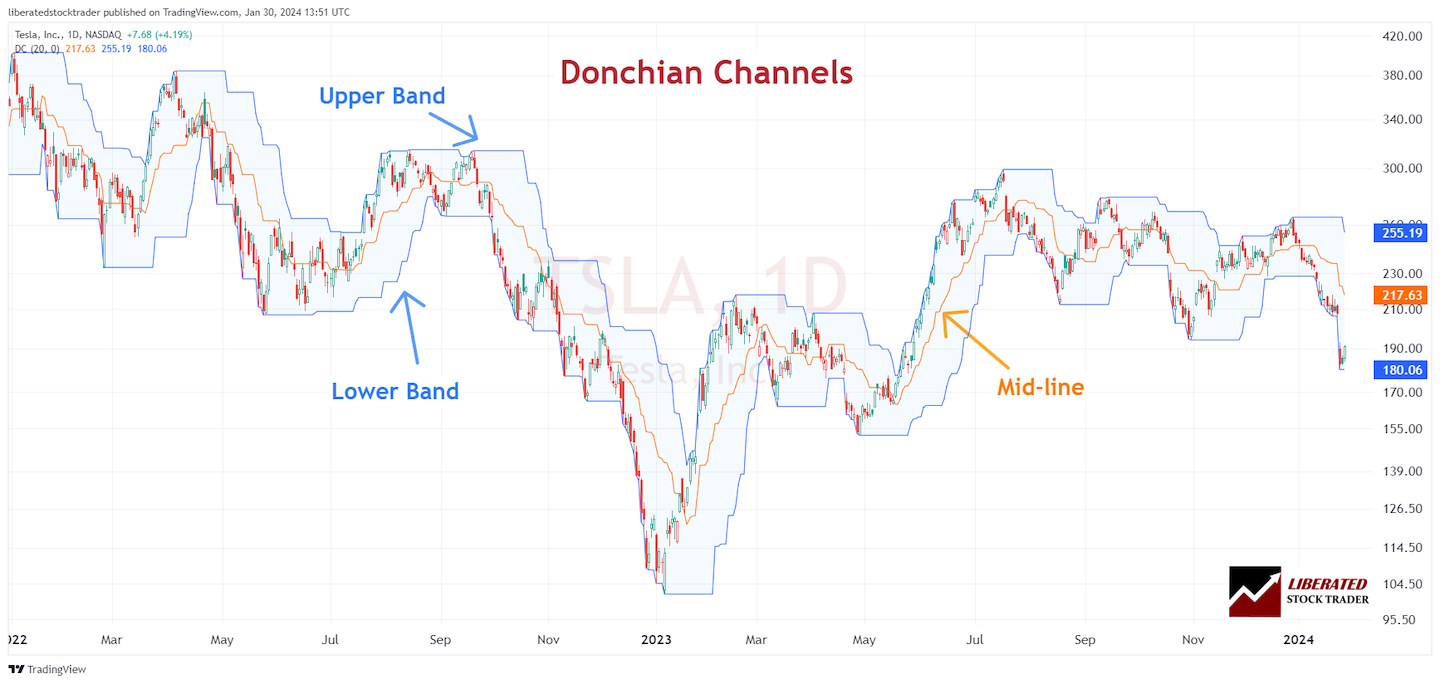
The Donchian Channels indicator in technical analysis helps traders understand market trends and potential price breakouts. It consists of three lines formed by taking the highest and lowest low of a predetermined number of periods, typically 20.
The area between the upper and lower bands represents the Donchian channel, providing a visual depiction of the price range over a certain period and signaling the volatility and momentum of the market.
Donchian channels identify breakout levels—the points at which the price surpasses the mid-line of the channel, potentially indicating the start of a new trend.
Richard Donchian created Donchian Channels in the late 1940s for commodity and futures trading. It captures price breakouts using a channel formed by the highest high and lowest low of a set number of past trading days, typically 20.
What are Donchian Channels
According to our testing, Donchian Channels are a proven profitable chart indicator. They use three bands to reflect price movements and volatility, resulting in moderate profitability.
- The upper band represents the highest high of the asset’s price over a set number of periods.
- The lower band depicts the lowest low of the asset’s price during the same number of periods.
- The middle line is the average of the upper and lower bands and is often used as a pivot point between uptrends and downtrends.
Key Parameters
To properly use the Donchian Channel indicator, you should be aware of certain key parameters:
Calculation of bands:
- Upper Band: Highest price reached in the past ‘N’ periods.
- Lower Band: Lowest price reached in the same ‘N’ periods.
Periods:
Typically, a 20-period setting is used, where ‘N’ refers to the chosen number of periods, be it days, weeks, or minutes, depending on the chart time frame.
By setting these parameters, the Donchian Channel can highlight potential breakout areas you might consider for your trading decisions. Remember, while the indicator might seem straightforward, proper understanding and practice are crucial for effective application.
Donchian Channels and Market Analysis
Donchian Channels serve as a dynamic tool in market analysis by mapping out price movements over a specific period. They help you understand market volatility and identify prevailing trends, whether uptrends or downtrends.
Trend Identification
By setting the upper and lower bounds of the Donchian Channel to the highest and lowest prices within a defined number of past trading periods, you gain insight into the current trend.
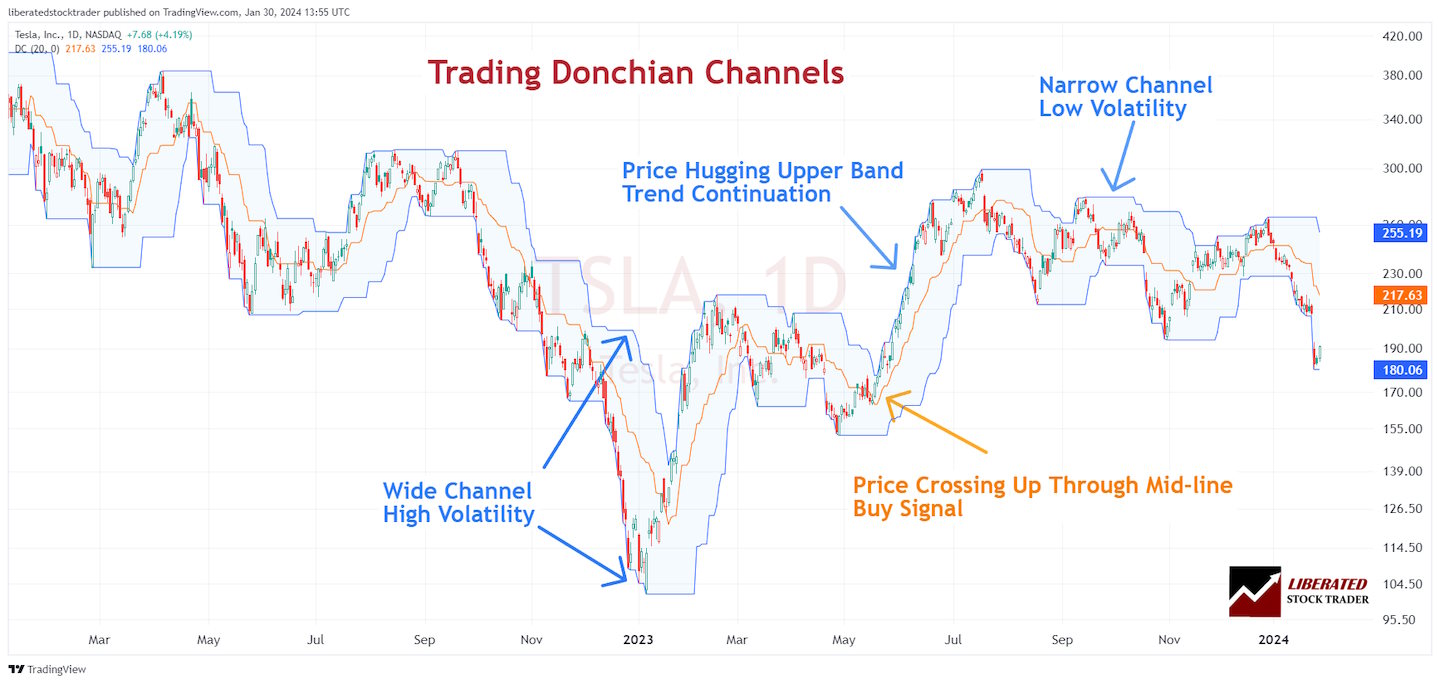
When prices hit the upper band, it suggests an uptrend, and hitting the lower band indicates a downtrend. The middle line of the channel can also act as an indicator of trend strength.
If the price consistently remains above this line, it is considered a strong uptrend and, conversely, a downtrend. Your analysis of trends is critical for trend-following strategies, allowing for strategic entry and exit points based on these signals.
Volatility Measurement
The width of the Donchian Channels reflects volatility in the market. A wide channel indicates high volatility, with larger price movements and potentially greater risk or opportunity.
Conversely, a narrow channel suggests low market volatility, indicating that prices are relatively stable. Watching how the channel expands or contracts gives you a visual representation of the market’s changing volatility, which can inform risk management decisions.
TrendSpider 4.8/5⭐: My Pick for AI-Power & Auto-Trading
I’ve used TrendSpider for 7 years for my research and testing. It auto-detects trendlines, patterns, and candlesticks, backtests ideas, and lets you use AI to create unique strategies and launch trading bots—with no code.

Trading Strategies Using Donchian Channels
Donchian Channels provide dynamic support and resistance levels that can enhance your trading strategies. They allow for clearly identifying breakout and reversal opportunities within different market conditions.
Breakout Approaches
When trading with Donchian Channels, breakouts signify potential entry points. A bullish breakout occurs when the price moves above the upper channel, suggesting you might consider taking a long position. Conversely, a bearish breakout is signaled by the price dropping below the lower channel, indicating a possible short position.
- Entry Signal:
- Long Position: Price crosses above the upper channel.
- Short Position: Price crosses below the lower channel.
- Exit Signal: Some traders exit their position when the price hits the opposite channel, while others might set a predefined profit target or use a trailing stop loss.
Reversal Techniques
Reversal techniques with Donchian Channels involve identifying when a trend is losing momentum and might reverse. You observe the price bouncing off the lower channel for a potential bullish reversal. Similarly, the price falling from the upper channel suggests a potential bearish reversal.
- Entry Signal:
- Long Position: Price rebounds from the lower channel.
- Short Position: Price retracts from the upper channel.
- Exit Strategy: Positioning stop-loss orders outside the channel can protect you from large losses if the expected reversal does not materialize. Some traders may also use the midline of the Donchian Channel as a take-profit level or an indicator for trend continuation.
Donchian Channel Indicator Backtesting
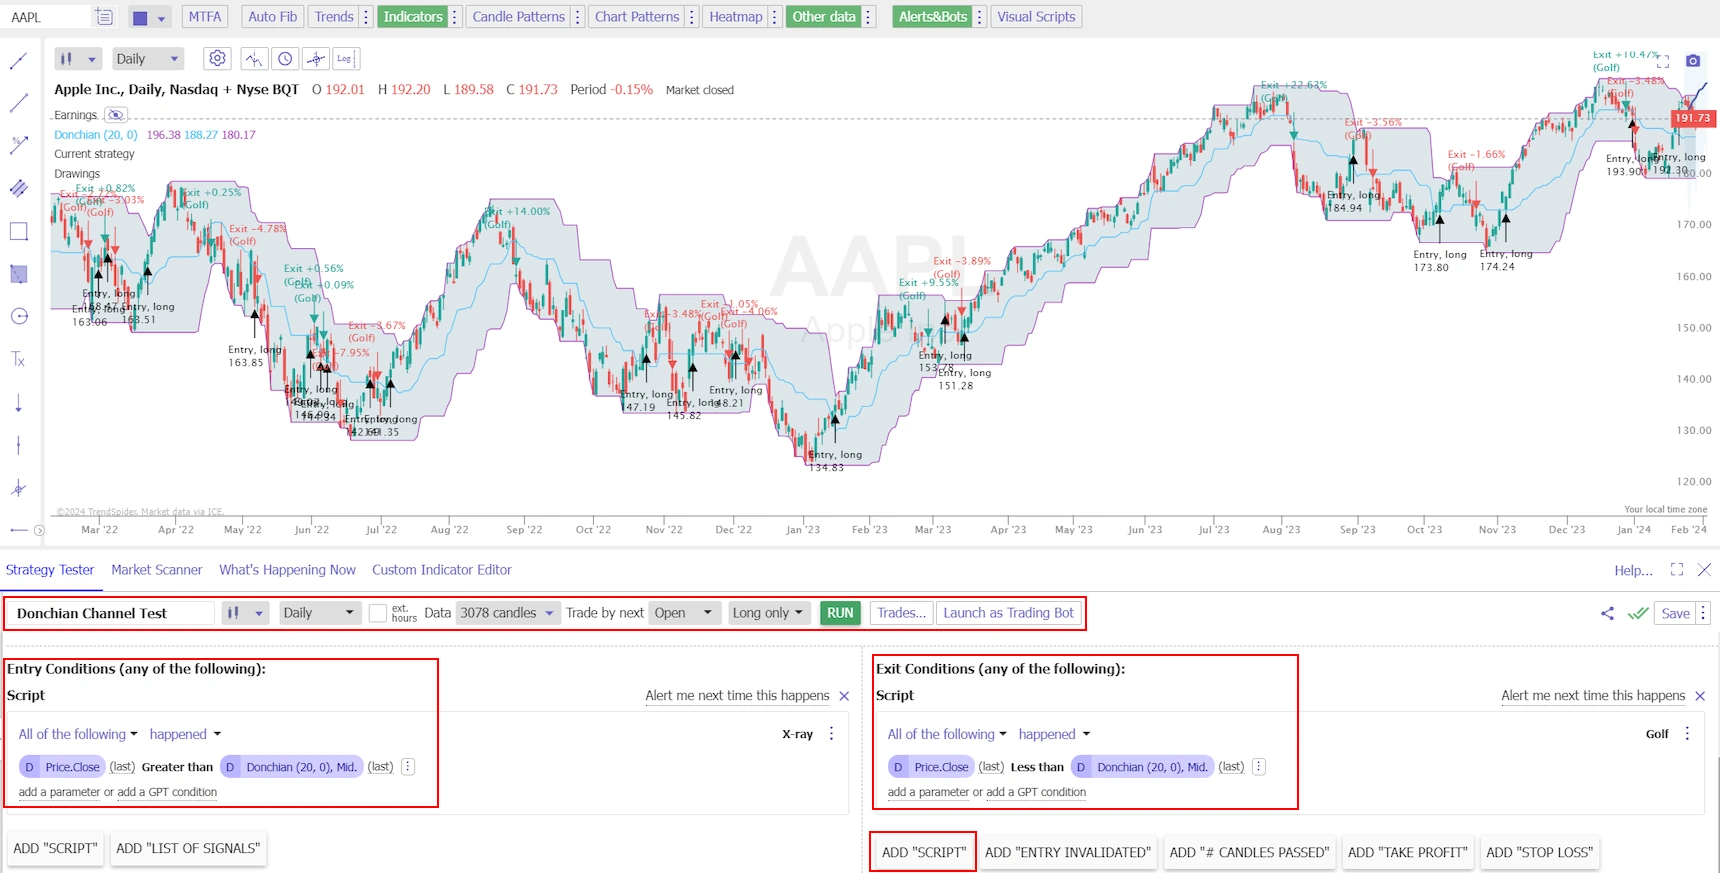
To backtest the Donchian Channel indicator, I used TrendSpider, the leading AI stock trading software with pattern recognition and a codeless backtesting engine. Testing was configured using OHLC daily charts, and the exit criteria were set to the next trading day, HL2 (Price High + Low /2).
| Testing Criteria | Daily Settings |
| Index: | DJIA – All 30 Stocks Tested |
| Date Range | 12 Years |
| Settings: | 20 |
| Entry Criteria: | Price Close > Donchian, 20, Mid-line |
| Exit Criteria: | Price Close < Donchian, 20, Mid-line |
| Sell | Next Open |
I test all indicators on their standard recommended settings, on different timeframes, and using different chart types; this provides an unbiased result.
How to Set Up Donchian Channel Backtesting in TrendSpider
To set up backtesting, I used TrendSpider, our recommended trading software for serious traders. The screenshot below shows the exact configuration for our Donchian Channel backtesting.
Backtest Setup
- Register for TrendSpider
- Buy Signal: Select Strategy Tester > Entry Condition > Add Script > Add Parameter > Condition > Price > Greater Than > Donchian, 20, Mid.
- Sell Criteria: Select > Add Script > Add Parameter > Condition > Price > Less Than > Donchian, 20, Mid.
- Finally, click “RUN.”
Set up expert backtesting now with TrendSpider
Donchian Channel Indicator Test Results
Using Donchian channels with the default 20 setting on a daily chart is profitable, with a positive expectancy ratio of 0.2. With an expectancy ratio of 0.2, you can expect to make $0.20 for every dollar risked on a trade.
With a reward-to-risk ratio of 2.4:1, the Donchian Channel is a reliable trading indicator; however, the losing trade percentage of 65% is too high, resulting in minimal profits.
| Donchian Channel Test | Results |
| # Stocks | 30 |
| Total Data (Years) | 360 |
| Net Perf, all stocks | 92% |
| Asset Perf (Buy & Hold) | 345% |
| Trades | 4,887 |
| Win % | 35% |
| Loss % | 65% |
| Max Drawdown | -36% |
| Average Win | 5% |
| Average Loss | -2% |
| Average Return | 0.4% |
| Rew/Risk Ratio | 2.40 |
| Expectancy | 0.20 |
| Exposure | 64% |
| Average Trade Length | 10.64 |
These results provide insights into the performance and characteristics of the Donchian Channel Indicator strategy when applied to the Dow Jones Industrial Average 30 stocks.
Our backtest indicates a positive net performance, although the win percentage is relatively low at 35%. The average return and reward/risk ratio of 2.4:1 suggest a reasonably profitable strategy, but the low win percentage offsets this result.
The average trade length is 10.6 days, and the market exposure is 64%, meaning you have open trades in the market 64% of the time. The average win is 5%, and the average loss is 2%.
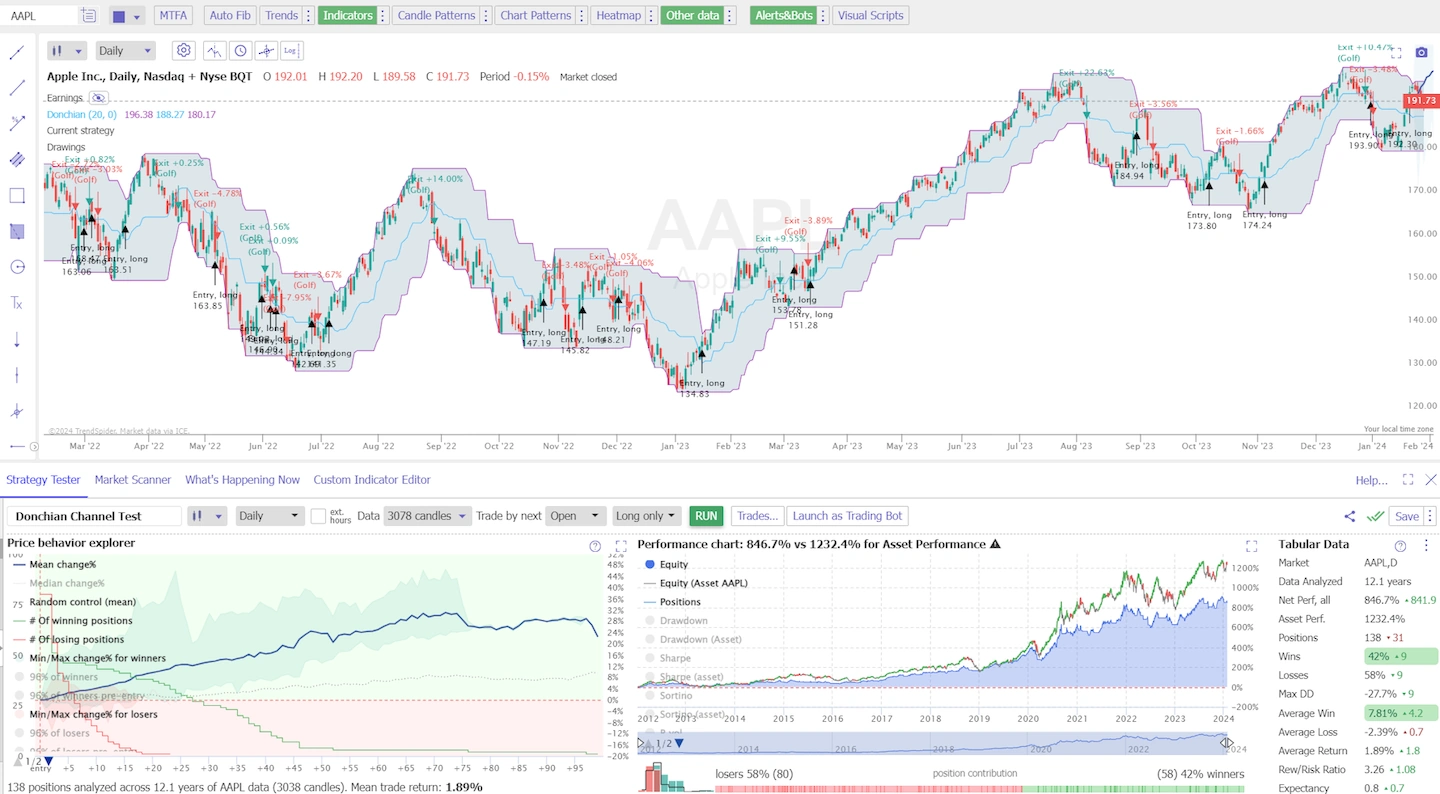
Trading Apple Inc. with Donchian Channels
The stock you choose to trade is really important to your profitability as a trader. Apple Inc. was the most profitable stock in our testing, with a high expected ratio of 0.8 and a risk-reward ratio of 3.26 based on 138 trades over 12 years.
Set up expert backtesting now with TrendSpider
Donchian Channel Apple Inc. Test Results.
| Results | Ticker: AAPL |
| Data Analyzed | 12.1 years |
| Net Perf, all | 846.70% |
| Asset Perf. | 1232.40% |
| Positions | 138 |
| Wins | 42% |
| Losses | 58% |
| Max DD | -27.70% |
| Max DD (Asset) | -44.80% |
| Average Win | 7.81% |
| Average Loss | -2.39% |
| Average Return | 1.89% |
| Rew/Risk Ratio | 3.26 |
| Expectancy | 0.8 |
| Exposure | 67.80% |
| Avg. Length | 13.9 |
Comparison with Other Indicators
Donchian Channels are a popular technical indicator; in this section, you will see how they compare to Bollinger Bands and the Average True Range. The insights will help you understand each indicator’s unique features and uses.
Bollinger Bands Versus Donchian Channels
Bollinger Bands and Donchian Channels provide different methods of understanding market volatility and price levels, but approach them differently. Bollinger Bands consist of a moving average (typically a 20-day simple moving average), with two standard deviation lines plotted above and below this average.
Conversely, Donchian Channels are formed by taking the highest high and the lowest low over a set period, often 20 days, to create the upper and lower bounds.
| Feature | Bollinger Bands | Donchian Channels |
|---|---|---|
| Composition | 20-day SMA with standard deviation | Highest high and lowest low |
| Volatility Measurement | Adjusts with standard deviation | Fixed range without volatility adjustment |
| Primary Use | Identify overbought/oversold conditions | Highlight breakouts and provide clear trading signals |
When deciding between the two, consider that Bollinger Bands adapt to changes in market volatility. At the same time, Donchian Channels offer a simpler, more straightforward method to identify potential breakouts by marking clear support and resistance levels.
Average True Range and Donchian Channels
The Average True Range (ATR) differs significantly from Donchian Channels. ATR is a volatility indicator that measures market movement intensity without providing actual price levels. In contrast, Donchian Channels offer specific price boundaries that indicate where the market is expected to find support or resistance.
| Component | Average True Range | Donchian Channels |
|---|---|---|
| Focus | Market volatility | Price channels |
| Indicator Type | Descriptive (does not provide trading signals) | Prescriptive (offers potential buy/sell signals) |
| Calculation Basis | The true range of a period | Price extremes over a set period |
For a clear comparison, ATR is valuable for gauging the volatility and potential price movement magnitude, aiding risk management strategies. Meanwhile, you can look to Donchian Channels as an actionable signal generator, giving more direct insights on when to enter or exit a trade based on the clear-cut boundaries set by price highs and lows.
Practical Application in Trading
When using Donchian Channels, the main focus is identifying potential entry and exit points for your trades by observing price breakouts and retracements.
Setting Up Donchian Channels on Charts
To set up Donchian Channels on a chart, select a Donchian Channels indicator from the indicators list on your trading platform. For example, if using TradingView:
- Click on the ‘Indicators’ button at the top of the chart.
- Type “Donchian Channels” into the search box.
- Select the Donchian Channels indicator.
In the settings, specify the period, typically 20 days, for the mid-range channel. This can be adjusted according to your trading strategy. Most trading platforms, like Investopedia or TradingView, allow you to customize the channel’s look.
Entry and Exit Points
Entry Points: You’ll want to consider a position when the price breaks above the upper band of the Donchian Channel, signaling a potential uptrend. Alternatively, a break below the lower band may indicate a possible downtrend, suggesting a short position.
Exit Points: For exits, traders often close their positions when the price touches the opposite band, ensuring profits are secured before a potential trend reversal. It is also common to set stop losses outside the Donchian Channel to protect against large losses in volatile markets.
Combine Donchian Channels with other indicators and analysis techniques to validate trade signals and strengthen your trading strategy.
Additional Considerations
When using Donchian channels, it’s essential to consider how risk management and the adjustment of time frames can influence the effectiveness of the indicator. Properly configured, Donchian channels can serve as a foundation for establishing stop-loss orders and gauging trend direction.
Risk Management
Stop-loss orders can be effectively placed at the lower band of the Donchian channel for a long position or at the upper band for a short position. This tactic helps protect your capital by providing a predetermined point of exit. For example:
- Long Position: If a stock is bought at $50 and the lower Donchian band is at $45, a stop-loss order can be set at or near $45.
- Short Position: Conversely, if a stock is sold short at $50 and the upper Donchian band is at $55, a stop-loss could be positioned at or around $55.
Using a risk-reward ratio helps determine the potential profitability of a trade compared to its risk of loss.
Time Frame and Adjustment
The time frame you select for the Donchian channel will depend on your trading style:
- Short-term traders may prefer a shorter time frame (e.g., 20 periods).
- Long-term investors may opt for a wider time frame (e.g., 50 to 100 periods).
It’s important to adjust the settings of the Donchian channel to match the instrument and market conditions. For instance:
- A highly volatile market may require a wider channel (larger period setting) to avoid false signals.
- A less volatile market might benefit from a narrower channel (smaller period setting) to be more responsive to price changes.
Offset can also be introduced as an additional parameter to shift the channel up or down. An offset could give you a buffer to accommodate minor price fluctuations and avoid premature stop-loss triggers.
Advanced Techniques and Modifications
When applying advanced techniques to Donchian Channels, you tailor the indicator to meet your specific trading needs. These refinements can lead to a more nuanced understanding of market movements and potentially better trading decisions.
Customizing Donchian Channels
You can modify the standard Donchian Channels to fit your analysis better. For instance, by adjusting the length of the period you’re assessing, typically a 20-day window, you fine-tune the channel’s sensitivity. A shorter timeframe creates a more sensitive channel that reacts quickly to price changes, whereas a longer period smooths out volatility.
Another aspect you can tailor is the color and average middle line. While the upper and lower lines are based on the high and low over the said period, the middle line, usually the average of the two, visually represents the average price. Adjusting this line to represent a different formula, like a moving average of the closing prices, can give you a unique portrayal of the market.
| Modification | Effect |
|---|---|
| Shortening time period | Increased sensitivity to price movements |
| Lengthening time period | Decreased sensitivity, smoother trends |
| Changing the middle line formula | Alters the average line for unique insights |
Integrating with Other Analytical Tools
Leveraging Donchian Channels with other analytical tools can provide a robust framework for market analysis. By merging the concept of Donchian Channels with a Supertrend indicator, you can craft a comprehensive view of market direction and volatility. The Supertrend provides additional information on the predominant trend.
Overlaying trend lines and, specifically, price patterns can also further define the market direction. If your Donchian Channel and the trend line suggest a similar market trajectory, it may reinforce your analysis, giving you a stronger basis for assessing potential entries and exits.
FAQ
Is the Donchian Channel worth trading?
Yes, the Donchian Channel indicator is worth using in a trading strategy because our tests show a 2.4:1 risk-reward ratio and and 0.2 expectancy. This means it is a moderately profitable technical analysis indicator.
Is the Donchian Channel profitable?
Yes, the Donchian Channel indicator is a profitable trading strategy with a 2.4:1 risk-reward ratio and 0.2 expectancies. This means it is moderately profitable, yielding 20 cents per dollar risked.
Is the Donchian Channel reliable?
The Donchian Channel indicator is less reliable than other indicators; it usually results in 35% winning trades and 65% losing trades. It is profitable overall because it has a high reward-to-risk ratio, which offsets the number of losing trades.
Can one effectively backtest a strategy using Donchian channels?
Yes, our test results are conclusive. To backtest a strategy with Donchian channels, ensure historical price data is accurate and reflects market conditions. Test different time frames and channel settings to evaluate the strategy's performance across various market scenarios. Consistency in backtesting parameters is crucial for reliable results.
What are the optimal settings for Donchian channels for short-term trading?
Typically, a 20-period setting for Donchian channels is used for short-term trading, reflecting the highs and lows of the past month of trading days. However, optimal settings may vary based on volatility and the specific asset you are trading. Adjust the periods to find the best fit for your trading style.
What is the best strategy for utilizing Donchian channels?
The best strategy for using Donchian channels involves buying when the price breaks above the middle band of the channel and selling when it breaks below. This breakout strategy combines well with other RSI to filter signals and manage risk.
How does the Donchian channel indicator function as a part of a trading system?
As part of a trading system, the Donchian channel indicator defines the market's high and low price points over a set period, signaling potential breakouts. It is frequently used in trend-following systems and can be paired with momentum indicators to discern the strength of a trend.
What is the process of calculating the Donchian channel formula?
To calculate Donchian channels, identify the highest high and the lowest low within the set number of periods. The top band is the highest high, the bottom band is the lowest low, and the middle band is the average of the two. Adjust the period to suit your trading approach.