Best Commodity Channel Index (CCI) Settings Tested on 43,297 Trades
Our test data shows that using the CCI indicator with a 50 setting on the S&P 500 index stocks over 20 years was incredibly profitable, returning a 1,108% profit compared to the market, which returned 555%.
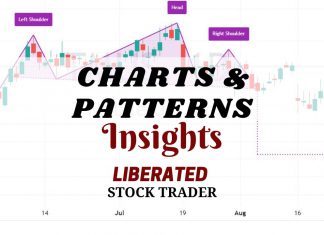
12 Accurate Chart Patterns Proven Profitable & Reliable
Research shows that the most reliable chart patterns are the Head and Shoulders, with an 89% success rate, the Double Bottom (88%), and the Triple Bottom and Descending Triangle (87%). The Rectangle Top is the most profitable, with an average win of 51%.
Master Technical Analysis: A 14-Video Ultimate Guide
Our ultimate guide to technical analysis will fast-track your knowledge with our 14 videos covering charts, trends, indicators, patterns, and tools.
Donchian Channels Indicator Explained & Profitability Tested
The Donchian Channels indicator in technical analysis helps traders understand market trends and potential price breakouts. It consists of three lines formed by taking the highest and lowest low of a predetermined number of periods, typically 20.
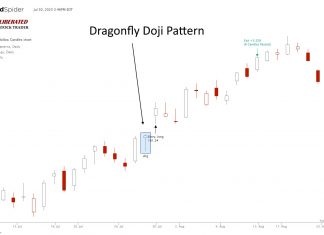
Dragonfly Doji Explained: Is it Reliable? I Test It!
The Dragonfly Doji is a candlestick chart pattern that indicates an equilibrium between buyers and sellers after a day of trading volatility. Our 1,703 test trades prove it can be profitable under the right circumstances, but the margins are thin.
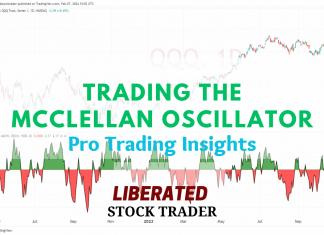
How to Trade the McClellan Oscillator Effectively
The McClellan Oscillator is a technical analysis tool designed to assess the market breadth of the New York Stock Exchange (NYSE). It is renowned for its effectiveness in revealing the underlying strength or weakness of the market by comparing the number of advancing to declining stocks.
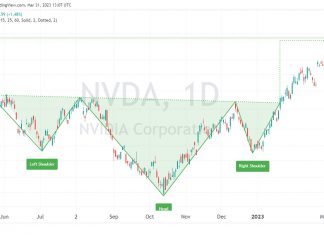
How to Trade the Inverse Head & Shoulders with 89% Accuracy
The inverse head and shoulders pattern is one of the most accurate technical analysis reversal patterns, with a reliability of 89%. It occurs when the price hits new lows on three separate occasions, with two lows forming the shoulders and the central trough forming the head.
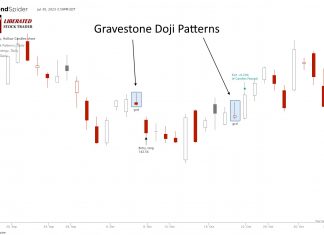
Gravestone Doji Explained & Reliability Tested!
A Gravestone Doji candle indicates a battle between buyers and sellers and is considered bearish. Our 1,553 test trades prove it is the third most profitable candle pattern. But it does not work as most traders believe.
Bollinger Band Trading Strategies Tested by LiberatedStockTrader
Our reliability testing of Bollinger Bands on the S&P 500, using 13,360 years of data, suggests it is an unreliable, unprofitable indicator for traders. However, Bollinger Bands can be profitable, but you need to know how it works, how to trade it, and the optimal settings.
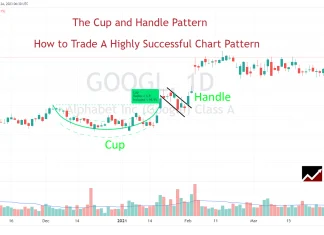
How to Trade a Cup and Handle’s 95% Reliability & 54%...
Twenty years of trading research show that the cup and handle pattern has a 95% success rate in bull markets and returns an average profit of +54%.
Linear vs. Logarithmic Charts Explained for Traders
Linear chart scales plot data at regular intervals, making it simple to see changes in data that have small fluctuations. Logarithmic chart scales represent percentage moves.
3 Top Momentum Indicators Explained & Tested
In technical analysis, momentum indicators help traders identify the strength and direction of a stock's price. We explain and test three popular momentum indicators for reliability.
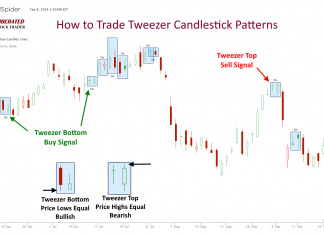
Do Tweezer Top & Bottom Candle Patterns Work? I Test It!
Based on our testing of 1,892 trades, the tweezer top and bottom patterns are highly unreliable and unprofitable. These patterns exhibit a reward-to-risk ratio of only 1.07, with 50% of trades resulting in losses. Relying on tweezers as a trading strategy yields poor results.
5 Moving Average Indicators Tested on 43,770 Trades
The best moving average settings are SMA or EMA 20 on a daily chart, which achieves a 23% win rate. At settings 50, 100, and 200, it is better to use the Hull moving average, which has win rates of 27%, 10%, and 17%, respectively.
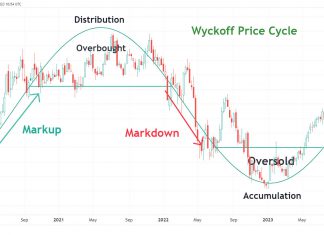
Wyckoff Method Explained: Accumulation & Distribution Trading
The Wyckoff Method is built upon three cardinal laws that govern the financial markets: the Law of Supply and Demand, the Law of Cause and Effect, and the Law of Effort versus Result.
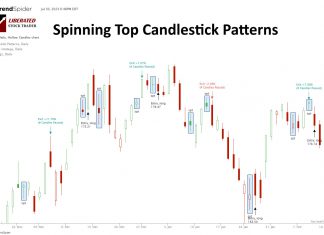
9,894 Trades Test a Spinning Top Candle Pattern’s Reliability
Our original research found that the Spinning Top candle is a bullish pattern, with a 55.9% success rate and a 3.7% average winning trade. Trading with a Spinning Top yields an average profit of 0.49%, ranking it the 10th best candle to trade.
Simple Moving Average Trading Settings & Strategy Tested
The simple moving average (SMA) technical analysis indicator helps identify stock price trends. It calculates an arithmetic average of prices, offering a smooth line that eliminates short-term price volatility.
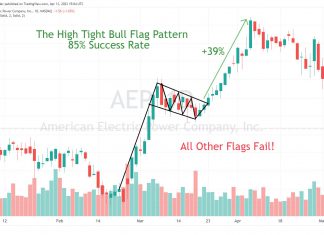
55% Of Bull Flags Fail. Trade a High Tight Flag’s 85%...
According to an analysis of 1,028 trades, most bull flags have a failure rate of 55%. The high-tight bull flag has a success rate of 85% and is the only flag pattern you should trade.
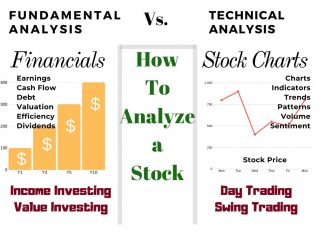
How To Analyze Stocks with Fundamental & Technical Analysis
There are two ways to analyze stocks. Fundamental analysis, which evaluates criteria such as PE ratio, earnings, and cash flow. Technical analysis, which involves studying charts, stock prices, volume, and indicators.
Is the S&P 500 200-Day Moving Average Profitable? I Test It!
Our testing of the 200-day MA on the S&P500 over 16 years revealed that using this indicator is a losing proposition. A buy-and-hold strategy made a profit of 192% vs. the 200-day MA, which made only 152%.
Our Best Training & Strategies
Liberated Stock Trader Pro: Learn Stock Market Investing
Learn stock market investing with the complete online stock trading course by Barry D. Moore, a certified financial analyst from the International Federation of Technical Analysts (IFTA).
ETF Investing Strategy: MOSES Improves Performance & Lowers Risk
The MOSES ETF investing strategy is a powerful suite of indicators meticulously backtested over 100 years. Designed to empower you to outperform the market, it equips you with the tools to navigate major stock market crashes and unlock greater investing performance.
LiberatedStockTrader’s Strategy Beat the Market By 102%
Decades of research and testing unveiled the Liberated Stock Trader Beat the Market System. Our 9-year, backtested, and proven strategy targets 35 financially healthy high-growth stocks, producing a track record of beating the S&P 500 by 102%.


