12 Proven Ways to Trade Stock Chart Indicators Profitably
Professional market analysts build effective trading strategies using techniques such as indicator divergences, multi-time frame analysis, indicator combinations, and rigorous backtesting.
How to Trade “Buy the Rumor, Sell the News”
"Buy the Rumor, Sell the News" means being one step ahead of other traders by reading the price and volume action leading up to a news or earnings announcement.
How to Trade Real-Time News: Tools, Tactics & Feeds Tested
From my experience in trading real-time news events, you should seek to gather and interpret the financial newsfeed as quickly as possible to initiate short-term trades to take advantage of profitable situations.
How to Trade International Stocks: Global Markets Explained
Trading international stocks can open up new opportunities and risks. However, you can also trade international ETFs from your home country, which will give you exposure and reduce risk through diversification.
Top 5 Candle Chart Pattern Recognition Software for Traders
After rigorous testing, TrendSpider, TradingView, FinViz, Tickeron, and MetaStock are our recommended chart pattern recognition software.
How to Find & Trade the Highest Short Interest Stocks
Short interest is the total number of outstanding shares sold short. Our data suggests short-sell traders should look for a high short interest float over 6% and a short interest ratio (coverage) greater than 19 days to find highly profitable short squeeze scenarios.
LiberatedStockTrader’s 14-Video Guide to Technical Analysis
Our ultimate guide to technical analysis will fast-track your knowledge with our 14 videos covering charts, trends, indicators, patterns, and tools.
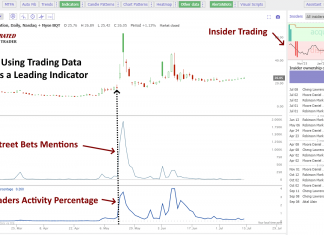
How to Find & Analyze Insider Trading Data for Smart Investing
Legal insider trading happens when corporate insiders trade their own company's stock following SEC reporting rules. Illegal insider trading, in contrast, involves trading a public company's stock based on nonpublic, material information.
A Traders Guide to the Short Sale Rule (SSR)/Uptick Rule
When a stock's price declines significantly, the Short Sale Rule triggers a temporary restriction that prevents investors from shorting the stock unless the price is above the current highest bid.
Using Seasonality Stock Charts to Improve Market Timing
Seasonality charts provide predictable patterns that stocks follow during specific days, weeks, and months of the year. These trends are influenced by recurring events or cycles.
8 Steps to Develop an Algorithmic Trading System From Scratch
To create an algo trading system, you must choose a strategy, select a trading platform, choose the asset type, select the indicators and patterns, backtest, and refine the strategy.
Dollar Cost Averaging (DCA) Examples & Strategy For Investors
Dollar cost averaging is an investment strategy that divides the total investment amount across periodic purchases, reducing risks from lump-sum investments and capitalizing on market price variations.
KST Indicator Best Settings & Strategy Tested on 2746 Trades
My research on 2,746 test trades spanning 10 years confirms that using the KST indicator's default settings on daily and weekly charts provides profitable and reliable signals for traders.
The Best Month to Buy Stocks: 53 Years of Analysis
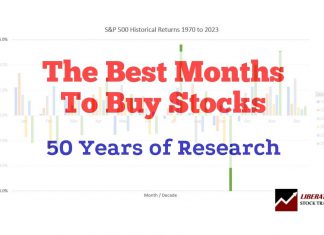
According to our research, using 53 years of stock exchange data, the best time to buy stocks is in October, and the best time to sell stocks is in July.
KDJ Indicator Explained: Best Settings & Strategy Tested
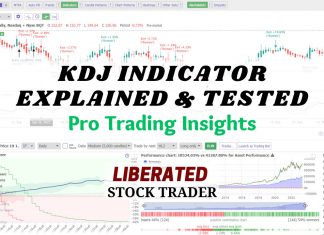
The KDJ is a stochastic oscillating technical analysis indicator that helps traders predict price reversals. According to our research, the KDJ has a 63% success rate if configured correctly.
Top 4 Best Momentum Indicators Explained & Tested
In technical analysis, momentum indicators help traders identify the strength and direction of a stock's price. We explain and test three popular momentum indicators for reliability.
11 Accurate Day Trading Indicators Tested & Proven with Data
Our research on 10,400 years of exchange data shows the best day trading indicators are the Price Rate of Change, VWAP, Weighted Moving Average, Hull Moving Average, Simple Moving Average, and RSI.
12 Accurate Chart Patterns Proven Profitable & Reliable
Research shows that the most reliable chart patterns are the Head and Shoulders, with an 89% success rate, the Double Bottom (88%), and the Triple Bottom and Descending Triangle (87%). The Rectangle Top is the most profitable, with an average win of 51%, followed by the Rectangle Bottom with 48%.
10 Best Candle Patterns for Traders Proven Reliable
My rigorous testing shows the most reliable candle patterns are the Inverted Hammer (60% success rate), Bearish Marubozu (56.1%), Gravestone Doji (57%), and Bearish Engulfing (57%). The inverted hammer is the most profitable candle pattern, with a 1.12% profit per trade.
A Market Analyst’s Guide to Stock Volume Indicator Trading
Stock volume measures the number of shares traded and indicates market strength. Rising markets with increasing volume are viewed as bullish, and falling prices on higher volume are bearish.

