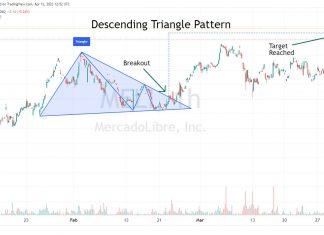
How to Trade a Descending Triangle’s 87% Success Rate
Twenty years of trading research show the descending triangle pattern has an 87% success rate in bull markets and an average profit potential of +38%.
Is the Supertrend Indicator Super? 4,052 Test Trades Show How to...
Based on our extensive testing, it has been determined that when used as a standalone indicator, Supertrend does not demonstrate reliability or profitability. With an average profit expectancy of 0.24, it is recommended to combine Supertrend with other indicators.
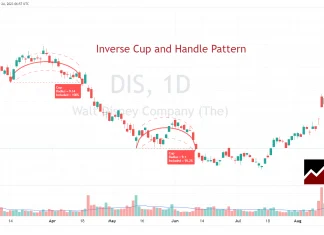
How to Short-Sell an Inverse Cup and Handle’s 82% Reliability
Two decades of trading research indicate that the inverse cup and handle pattern has an 82% success rate and average price drops of 17%. It is an ideal pattern for short-selling.
Rate of Change Indicator Test: Trading a 66% Success Rate
The Rate of Change (ROC) is a momentum indicator that measures the speed and direction of asset price movements. It helps traders determine whether a security is trending and how quickly its price changes.
VWAP Indicator Best Settings & Strategy Based on 13,681 Trades
Using VWAP with a 14 setting on a daily Heikin Ashi chart is vastly superior to conventional OHLC charts. Using an OHLC chart, the strategy barely breaks even with a low-profit expectancy of 0.15. In contrast with a Heikin Ashi chart, the strategy is incredibly profitable, with a profit expectance of 0.83 and a reward-to-risk ratio of 3.03.
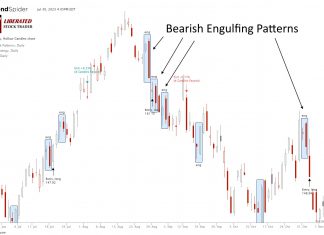
Bearish Engulfing Candles Explained & Reliability Tested
Our research shows the Bearish Engulfing candle is an accurate and profitable pattern. Our 568 years of data reveals a 57% success rate and an average win of 3.7%.
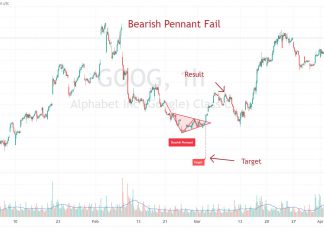
Why Traders Must Avoid the Bear Pennant Pattern!
Traders should avoid using bear pennants. Decades of testing on over 1,600 trades show bearish pennants have a low success rate of 54% and a low price decrease of 6%.
Price Action Trading: Mastering Day & Swing Trading Strategy
Price action trading is a method of day trading that relies on technical analysis but ignores conventional fundamental indicators, focusing instead on the movement of prices.
10 Best Day Trading Indicators Proven with Data!
Our research on 10,400 years of exchange data shows the best day trading indicators are the Price Rate of Change, VWAP, Weighted Moving Average, Hull Moving Average, Simple Moving Average, and RSI.
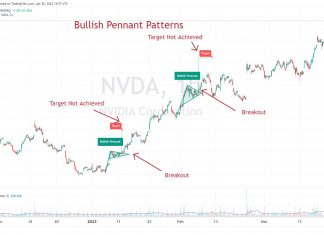
Why Traders Should Avoid Using Bull Pennant Chart Patterns
Traders must be cautious when using bull pennant chart patterns. Published research reveals a low success rate of 54% and a meager price increase of 7%.
RSI Indicator Explained: Best Settings & Strategy Tested
The Relative Strength Index (RSI) is an oscillating momentum indicator that measures the speed and change of stock price movements. RSI uses a scale from 0 to 100 to indicate overbought or oversold conditions.
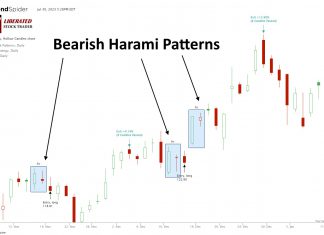
Bearish Harami Pattern: 5,624 Trades Tested for Reliability!
Our research shows Bearish Harami and Bearish Harami Cross are profitable patterns. Based on 1,136 years of data, the Bullish Harami has an average profit per trade of 0.48% and the Harami Cross 0.57%.
Our Best Training & Strategies
Liberated Stock Trader Pro: Learn Stock Market Investing
Learn stock market investing with the complete online stock trading course by Barry D. Moore, a certified financial analyst from the International Federation of Technical Analysts (IFTA).
ETF Investing Strategy: MOSES Improves Performance & Lowers Risk
The MOSES ETF investing strategy is a powerful suite of indicators meticulously backtested over 100 years. Designed to empower you to outperform the market, it equips you with the tools to navigate major stock market crashes and unlock greater investing performance.
LiberatedStockTrader’s Strategy Beat the Market By 102%
Decades of research and testing unveiled the Liberated Stock Trader Beat the Market System. Our 9-year, backtested, and proven strategy targets 35 financially healthy high-growth stocks, producing a track record of beating the S&P 500 by 102%.

