12 Proven Ways to Trade Stock Chart Indicators Profitably
Professional market analysts build effective trading strategies using techniques such as indicator divergences, multi-time frame analysis, indicator combinations, and rigorous backtesting.
Top 5 Candle Chart Pattern Recognition Software for Traders
After rigorous testing, TrendSpider, TradingView, FinViz, Tickeron, and MetaStock are our recommended chart pattern recognition software.
LiberatedStockTrader’s 14-Video Guide to Technical Analysis
Our ultimate guide to technical analysis will fast-track your knowledge with our 14 videos covering charts, trends, indicators, patterns, and tools.
Using Seasonality Stock Charts to Improve Market Timing
Seasonality charts provide predictable patterns that stocks follow during specific days, weeks, and months of the year. These trends are influenced by recurring events or cycles.
KST Indicator Best Settings & Strategy Tested on 2746 Trades
My research on 2,746 test trades spanning 10 years confirms that using the KST indicator's default settings on daily and weekly charts provides profitable and reliable signals for traders.
KDJ Indicator Explained: Best Settings & Strategy Tested
The KDJ is a stochastic oscillating technical analysis indicator that helps traders predict price reversals. According to our research, the KDJ has a 63% success rate if configured correctly.
Top 4 Best Momentum Indicators Explained & Tested
In technical analysis, momentum indicators help traders identify the strength and direction of a stock's price. We explain and test three popular momentum indicators for reliability.
11 Accurate Day Trading Indicators Tested & Proven with Data
Our research on 10,400 years of exchange data shows the best day trading indicators are the Price Rate of Change, VWAP, Weighted Moving Average, Hull Moving Average, Simple Moving Average, and RSI.
12 Accurate Chart Patterns Proven Profitable & Reliable
Research shows that the most reliable chart patterns are the Head and Shoulders, with an 89% success rate, the Double Bottom (88%), and the Triple Bottom and Descending Triangle (87%). The Rectangle Top is the most profitable, with an average win of 51%, followed by the Rectangle Bottom with 48%.
10 Best Candle Patterns for Traders Proven Reliable
My rigorous testing shows the most reliable candle patterns are the Inverted Hammer (60% success rate), Bearish Marubozu (56.1%), Gravestone Doji (57%), and Bearish Engulfing (57%). The inverted hammer is the most profitable candle pattern, with a 1.12% profit per trade.
A Market Analyst’s Guide to Stock Volume Indicator Trading
Stock volume measures the number of shares traded and indicates market strength. Rising markets with increasing volume are viewed as bullish, and falling prices on higher volume are bearish.
LiberatedStockTrader’s Guide to Backtesting Trading Strategies
Experienced investors backtest their trading strategies to optimize their portfolios. Backtesting is a critical step that enables traders to assess the potential viability of a trading strategy by applying it to historical data.
6 Principles of Dow Theory Explained by LiberatedStockTrader
Dow theory's six principles underpin technical analysis: The market discounts everything; it has three trends and phases; the averages must confirm each other; volume confirms the trend and a trend continues until it reverses.
Donchian Channels Indicator Explained & Profitability Tested
The Donchian Channels indicator in technical analysis helps traders understand market trends and potential price breakouts. It consists of three lines formed by taking the highest and lowest low of a predetermined number of periods, typically 20.
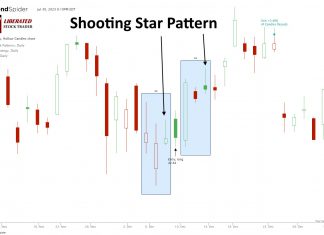
Is the Shooting Star Candle Worth Trading? Our Data Says Yes!
Based on our 568 years of backtested data, the Shooting Star candle is profitable. It has a 57.1% upside success rate and an average winning trade of 3.6%. Each trade made using a shooting star nets an average of 0.56% profit.
6 Steps for Better Stock Market Trend Analysis
All stock market trends can be described by using the following definitions. Market timeframes are short-term-medium-term, and long-term. Market direction is described using uptrend, downtrend, or consolidation.
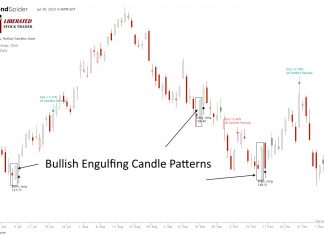
3,735 Bullish Engulfing Candle Trades Test its Reliability
Our research shows the Bullish Engulfing candle is not as profitable as most traders believe. Based on 568 years of data, it has a 55% success rate and an average win of 3.5%.
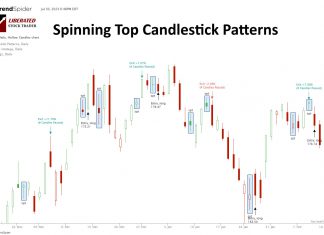
9,894 Trades Test a Spinning Top Candle Pattern’s Reliability
Our original research found that the Spinning Top candle is a bullish pattern, with a 55.9% success rate and a 3.7% average winning trade. Trading with a Spinning Top yields an average profit of 0.49%, ranking it the 10th best candle to trade.
6 Researched & Data Driven Tips for Money Flow Index Trading
To optimally trade using the MFI indicator, traders should look for overbought, oversold, and divergence conditions as key signals. For the best results, consider backtesting your strategy.
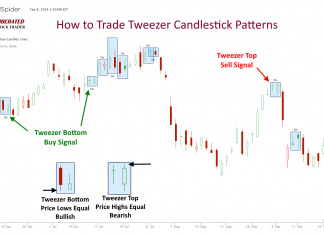
Our Data Research Proves Tweezer Candle Patterns Don’t Work!
Based on our testing of 1,892 trades, the tweezer top and bottom patterns are highly unreliable and unprofitable. These patterns exhibit a reward-to-risk ratio of only 1.07, with 50% of trades resulting in losses. Relying on tweezers as a trading strategy yields poor results.


