Charting & Technical Analysis
Charts are an essential tool in technical analysis. They display and track the price movements of assets over time. Technical analysis analyzes stock or other asset price movements to predict future patterns and market trends.
Our original research into chart types, reliability, success rates, and how to use them will provide you with unique trading insights.
When combined with the right indicators, charts can provide profound insight into future stock price moves.
Unveiling the Secret Japanese Trading Tactics of Kagi Charts
Kagi charts provide traders with a unique perspective on price action, filtering out much of the noise and highlighting genuine trends.
Getting a handle on how to use Kagi charts, dialing in the right settings, and understanding how they compare to other chart types can really sharpen your technical analysis and trading decisions.
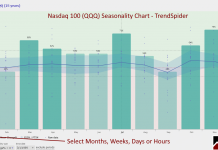
How to Identify & Trade Seasonal Trends in Financial Markets
Seasonal trends refer to certain sectors, like retail, which often perform better during holiday seasons, while agricultural products might see spikes during harvest times.
Fear & Greed Index July 2025: Decode Market Trends Now
Our Fear and Greed Index goes beyond the basics, offering nine real-time and historical charts to help you stay ahead. With live data from the Federal Reserve, VIX CBOE, and 15 technical stock price signals, you'll have the tools to make smarter decisions today.
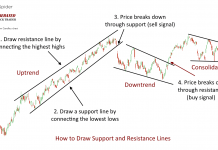
How Pro Investors Use Chart Trendlines to Make Better Trades
Drawing trendlines on stock charts is a powerful way to assess the market's direction. They help you understand the trend direction and timeframe to set expectations for future market moves, helping you improve your trading.
How to Trade Market Sentiment Using Live Chart Examples
Successful traders use market sentiment to gain a competitive edge and improve their chances of making profitable trades.
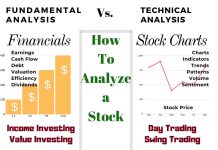
How To Analyze Stocks with Fundamental & Technical Analysis
There are two ways to analyze stocks. Fundamental analysis, which evaluates criteria such as PE ratio, earnings, and cash flow. Technical analysis, which involves studying charts, stock prices, volume, and indicators.


