★ Chart Pattern Research & Guides ★
- 22 Proven Stock Chart Price Patterns
- 10 Accurate Bullish Chart Patterns
- 1. Cup & Handle (95%)
- 2. Inverse Head & Shoulders (89%)
- 3. Double Bottom (88%)
- 4. Triple Bottom (87%)
- 5. Descending Triangle (87%)
- 6. Rectangle Bottom (85%)
- 7. Bull Flag (84%)
- 8. Ascending Triangle (83%)
- 9. Rising Wedge (81%)
- 9. Falling Wedge (74%)
- 10. Bull Pennant (54%)
- Bonus Indicator: The Wyckoff Method
- 8 Accurate Bearish Chart Patterns
- Top 6 Profitable Harmonic Patterns
- Candlestick Patterns Guide
- 10 Profitable Candle Patterns Tested
- 1. Inverted Hammer (60%)
- 2. Shooting Star (57.1)
- 3. Gravestone Doji (57%)
- 4. Bearish Engulfing (57%)
- 5. Bearish Harami Cross (57%)
- 6. Marubozu (56.1)
- 7. Spinning Top (55.9%)
- 8. Doji (55.6%)
- 9. Bullish Harami Cross (55.3%)
- 10. Dragonfly Doji (55.3%)
- 11. Bullish Engulfing (55%)
- 12. Hammer (52.1%)
- 13. Tweezer Top (44%)
- Next Section – Trading Guides >>
Candlestick Pattern Research & Backtesting
Candle patterns are visual formations made up of one or more candlesticks that can be used to predict the direction of future price movements.
Our original candlestick research meticulously explains and tests the most important patterns to reveal success rates, reliability, profitability, and how to trade them.
How to Read Candlestick Charts Using 5 Reliable Patterns
You can read candlestick charts using pattern recognition software to identify five reliable patterns, the Inverted Hammer, Bearish Marubozu, Gravestone Doji, Bearish Engulfing, and Bullish Harami Cross.
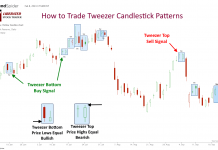
My Data Research Proves Tweezer Candle Patterns Don’t Work!
Based on our testing of 1,892 trades, the tweezer top and bottom patterns are highly unreliable and unprofitable. These patterns exhibit a reward-to-risk ratio of only 1.07, with 50% of trades resulting in losses. Relying on tweezers as a trading strategy yields poor results.
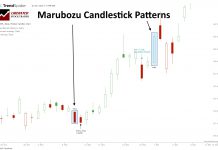
I Test Bullish & Bearish Marubozu Candle Reliability
Our research shows Bearish Marubozu candles are among the most profitable patterns. Based on 568 years of data, it has a 56.1% success rate and an average win of 4.1%. Conversely, the Bullish Marubozu is one of the worst.
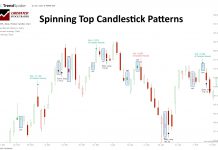
9,894 Trades Test a Spinning Top Candle Pattern’s Reliability
Our original research found that the Spinning Top candle is a bullish pattern, with a 55.9% success rate and a 3.7% average winning trade. Trading with a Spinning Top yields an average profit of 0.49%, ranking it the 10th best candle to trade.
10 Best Candle Patterns for Traders Proven Reliable
My rigorous testing shows the most reliable candle patterns are the Inverted Hammer (60% success rate), Bearish Marubozu (56.1%), Gravestone Doji (57%), and Bearish Engulfing (57%). The inverted hammer is the most profitable candle pattern, with a 1.12% profit per trade.
Our Data Proves Why Heikin-Ashi Charts Are Best for Traders
I backtested 360 years of data on the 30 most important US stocks, and our findings prove that Heikin-Ashi chart strategies outperform 66% of equities vs. a buy-and-hold strategy.


