Determining when to buy stocks is a significant decision, and that’s where buy signals play a crucial role.
A buy signal is essentially an indicator or event that suggests it may be a good time to purchase a particular stock, whether based on technical data, chart patterns, or intrinsic value.
Both traders and investors rely on these signals to make informed choices, rather than relying on gut reactions, hopefully alleviating some of the stress and second-guessing.

Buy signals show up in all kinds of ways—think moving average crossovers, shifts in technical indicators, or even sudden changes in market sentiment. If you can spot these signals, you might just time your entries better and, with any luck, boost your results in the market.
Key Takeaways
- Buy signals indicate potential entry points for stocks.
- You need to understand the main strategies and tools to spot and use buy signals.
- Following best practices can boost your confidence and help lower risk.
What Is a Buy Signal?

A buy signal is essentially an alert or indication that it may be a favorable moment to purchase a stock or other asset. It lies at the core of many trading and investing methods.
Most buy signals originate from analyzing technical indicators, chart patterns, or examining fundamentals. Traders and investors use these signals to guide their decisions and attempt to enter at a favorable time.
Common sources of buy signals include:
- Moving averages crossing over
- Price breaking out above resistance
- Oversold readings on indicators like RSI
- Positive earnings reports or upgrades
| Analysis Type | Example Buy Signal |
|---|---|
| Technical Analysis | 50-day MA crosses above 200-day MA |
| Fundamental Analysis | Better-than-expected earnings |
| Sentiment | Extreme bearish sentiment (contrarian) |
Automated systems and trading software generate buy signals based on predefined patterns and data. But it’s honestly smart to double-check and do your homework before acting—none of these signals are a sure thing.
Buy signals can help both day traders and longer-term investors. They turn messy market data into something actionable, though you’ll want to back them up with some extra research or confirmation.
The Importance of Buy Signals for Traders and Investors

Buy signals are crucial for both traders and investors seeking to navigate the complexities of financial markets. They offer a bit of clarity—some guidance on where you might want to jump in, so you’re not just guessing or letting nerves take over.
When you follow buy signals, you’re adding a bit of structure to your buying decisions. That structure can help you align your actions with your broader strategy, not just the latest headline or hunch.
Key benefits of using buy signals include:
- Better timing: Buy signals can highlight moments when your odds appear slightly more favorable.
- Risk management: Pairing signals with stop-losses can help cap your losses.
- Consistency: Relying on signals (instead of drama) can keep your trading more disciplined.
Buy signals can pop up from technical indicators, chart patterns, or triggers in fundamental data. Most seasoned investors mix and match these to double-check their choices.
Here’s how buy signals fit into a few different trading styles:
| Trading Style | Use of Buy Signals |
|---|---|
| Day Traders | Quick decisions, lots of signals |
| Swing Traders | Short- to medium-term entries |
| Long-Term Investors | Look for big trend shifts |
Solid buy signals can help you react faster to new chances and give you a bit more confidence, since you’re leaning on something objective instead of just a feeling.
Key Methods To Identify Buy Signals
Most traders combine various market analysis tools and signals in an attempt to pinpoint their entries. The most reliable buy signals typically come from analyzing technical indicators, chart patterns, price action, company fundamentals, and occasionally using automated systems.
Technical Analysis and Indicators
Technical analysis is a go-to for spotting buy signals. Traders use technical indicators such as moving averages, the Relative Strength Index (RSI), Moving Average Convergence Divergence (MACD), and Bollinger Bands to gauge trends and momentum.
One common signal: price moving above a key moving average, or the RSI bouncing out of oversold territory. Oscillators like the MACD help indicate momentum shifts and potential reversals.
Volume matters, too—it can confirm if a move has real strength behind it. Using a few indicators together usually works better than relying on just one. Looking back at how these indicators performed in different markets helps traders tweak their approach.
Chart Patterns and Price Movements
Chart patterns are like the market’s body language—visual cues that hint at what might come next. Some of the classic patterns include the double bottom, head and shoulders, and ascending triangles.
If you see a breakout above resistance, that can be a buy sign, especially if volume picks up. Reversal patterns, such as the hammer candlestick, can signal a trend shift.
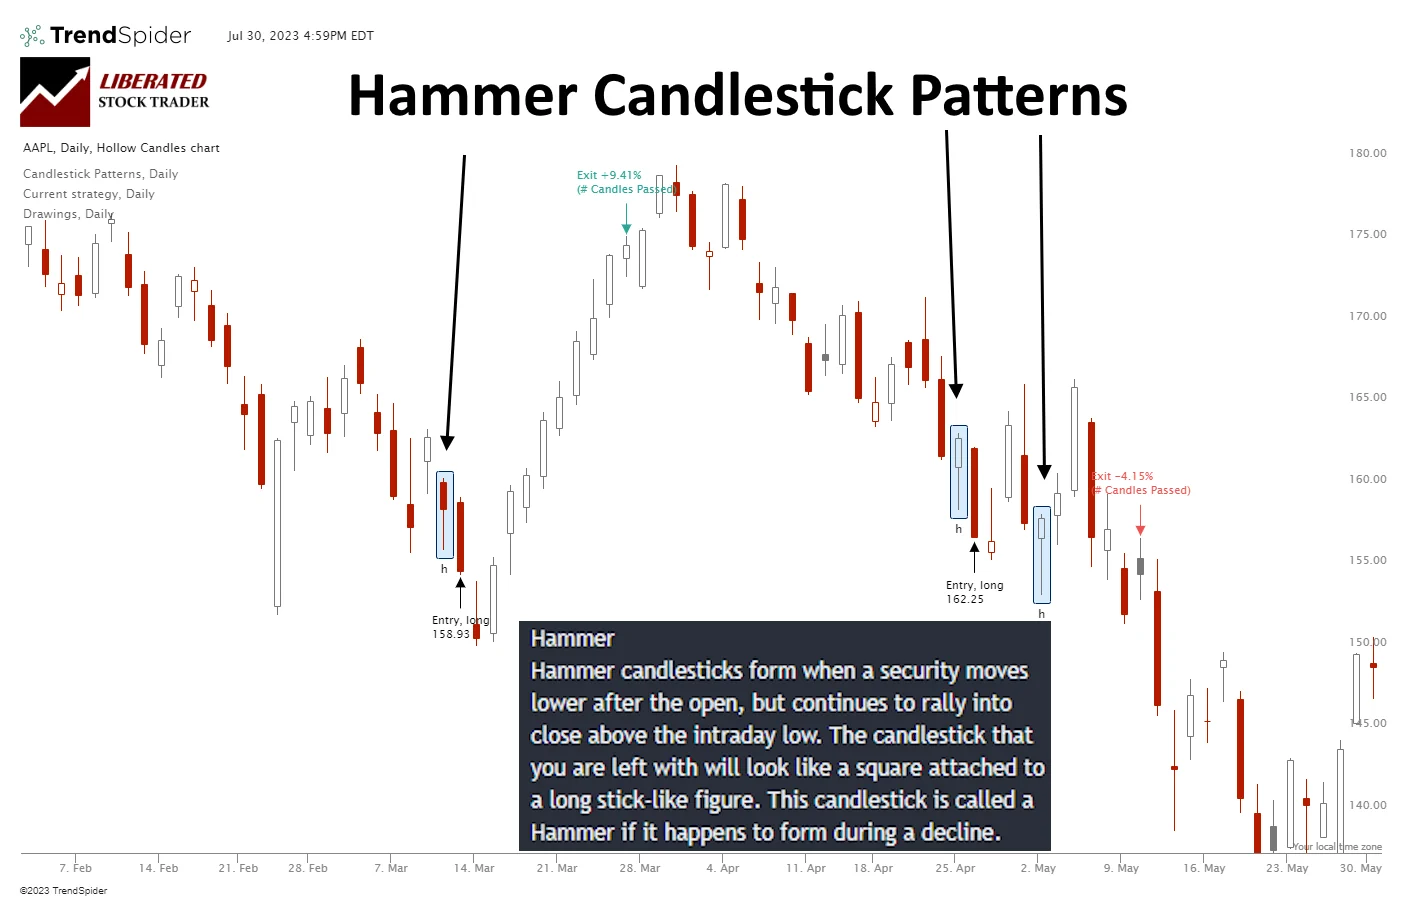
Mixing these patterns with recent price action helps weed out fake-outs. Looking back at old charts can show how these setups have played out before, though nothing is ever guaranteed.
Fundamental Analysis in Identifying Buy Signals
Fundamental analysis focuses on the company itself—its financials, industry position, and economic indicators. Factors such as strong earnings, steady revenue, low debt, or a major product launch can all trigger buy signals.
Some traders wait for a company to post solid quarterly results or raise its outlook before buying in. Economic news—such as GDP, jobs data, and central bank moves—can also influence stock prices.
Doing the research helps you separate the truly undervalued from the hype. Combining solid fundamentals with technical buy signals typically provides a better opportunity for a successful trade.
Automated Trading Systems and Signal Providers
Automated trading systems run on algorithms that hunt for buy signals based on rules pulled from technicals, chart setups, and sometimes fundamentals. These bots can process vast amounts of data and execute trades in seconds.
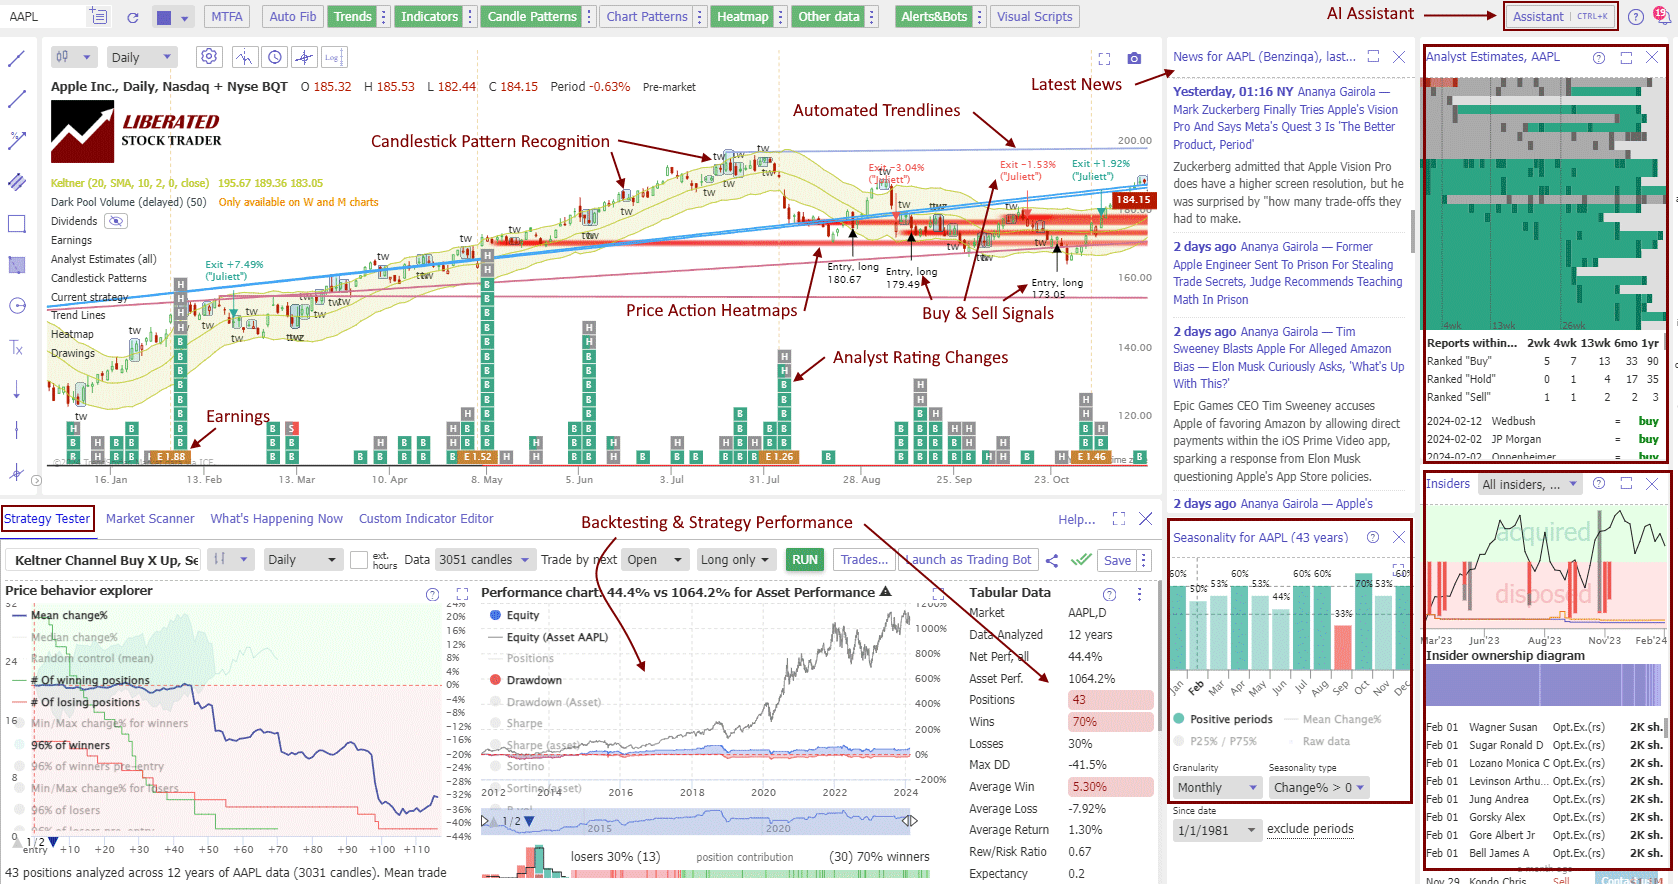
Using TrendSpider for Buy Signals
TrendSpider offers automated technical analysis tools that help you identify potential buy signals quickly. Its algorithms chew through price action, volume, and trends in real time, pinging you when things match your criteria.
You can set up automated alerts for key events like trendline breaks, crossovers, or candlestick patterns that often hint at reversals. The backtesting feature lets you see how your strategies would’ve worked in the past, which is pretty handy for making decisions with some actual data behind them.
TrendSpider – The Smartest AI-Powered Trading Tool on the Planet
- Explore 220+ charts and indicators for next-level analysis
- Master 150+ candlestick patterns to spot opportunities
- Unlock powerful seasonality charts for smarter decisions
- Stay ahead with news and analyst ratings at your fingertips
- Let AI-Powered Chart Analysis turn raw data into winning insights
- Test any trading idea in seconds with easy point-and-click backtesting
- Transform ideas into action with auto-trading bots ready to execute your strategies!
TrendSpider’s visual tools—multi-timeframe analysis and heatmaps—make it easier to confirm signals and cut down on emotional mistakes. If you want, you can even connect it to your broker for smoother trade execution.
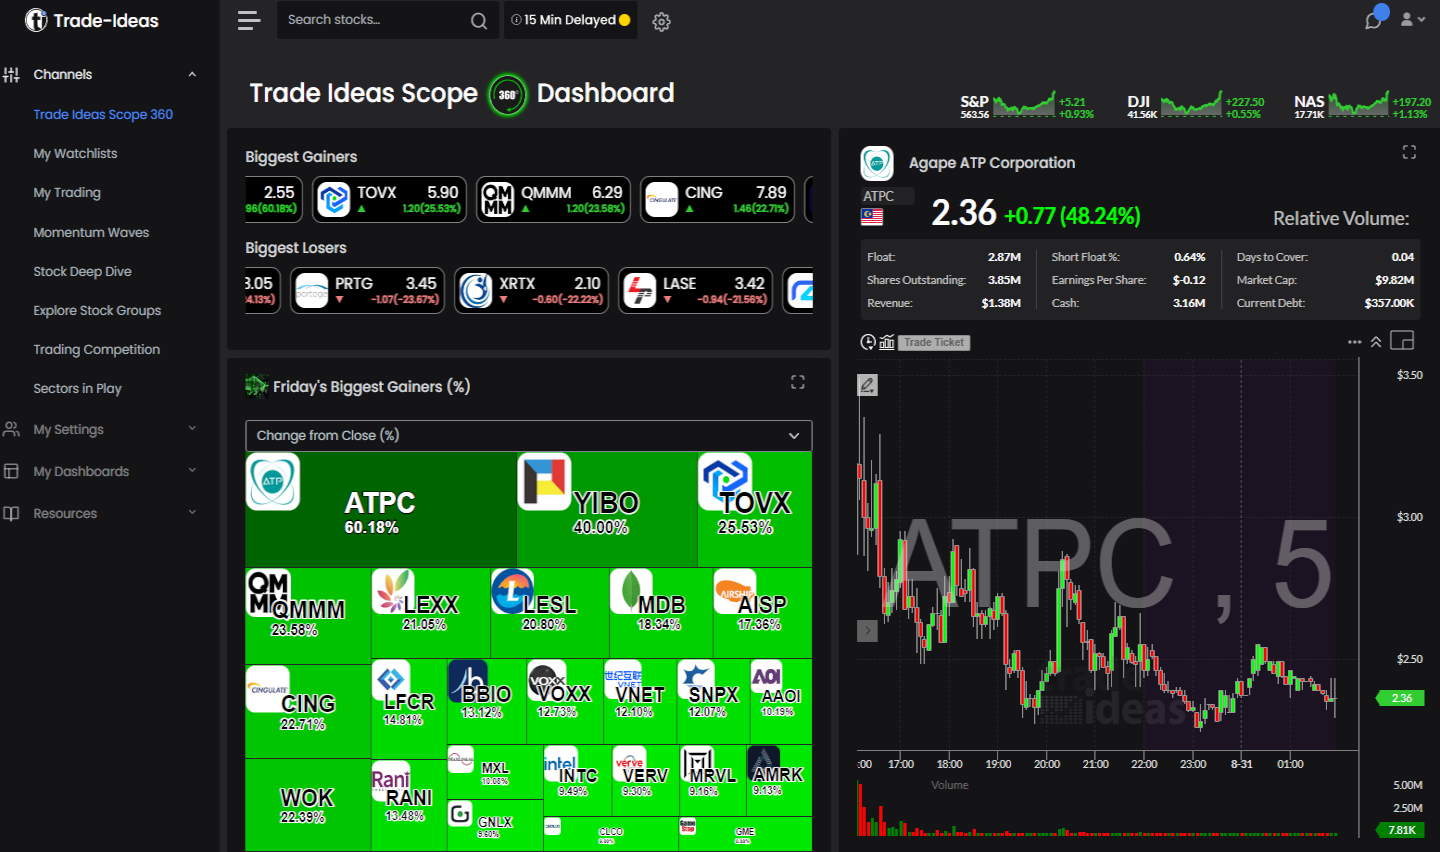
Using the Trade Ideas Platform for Buy Signals
Trade Ideas uses AI to deliver high-probability trade signals from a constant stream of market data. Their AI, “Holly,” scans thousands of stocks all day and spits out trade ideas—including buy signals—by weighing technical, fundamental, and some proprietary factors.
With pre-built or customizable alert windows, you can zero in on sell setups that fit your risk and strategy. Each signal comes with suggested entry, exit, and stop loss points, so you’re not flying blind.
They also give you detailed performance stats and event-based simulations, so you can see if the signals actually work. That kind of transparency is great for figuring out which signals to trust and for tightening up your trading game.
Using TradingView for Buy Signals
TradingView has a huge charting suite and tons of user-created and official scripts that can send out automated buy signals. You can tweak open-source indicators or build your own to match your approach, whether you’re trading stocks, forex, or crypto.
The platform’s alerts system lets you set up notifications for technical events—moving average crossovers, RSI levels, support/resistance breaks, and so on. You’ll get these alerts in real time by email, SMS, or browser pop-up.
There’s also a big community for sharing and discussing trade ideas, which is great for cross-checking and getting other perspectives. With all its tools and collaboration features, TradingView’s pretty flexible for anyone wanting timely, reliable signal alerts.
My thorough testing awarded TradingView a stellar 4.8 stars!
With powerful stock chart analysis, pattern recognition, screening, backtesting, and a 20+ million user community, it’s a game-changer for traders.

Whether you’re trading in the US or internationally, TradingView is my top pick for its unmatched features and ease of use.
Popular Buy Signal Strategies and Tools
Technical traders often stick to certain indicators and chart patterns to spot buy signals. These tools give a framework for finding good entry points by analyzing price, trends, and momentum.
Moving Averages and Moving Average Crossovers
Moving averages smooth out the noise in price data so you can see the bigger trend. The main types are the simple moving average (SMA) and exponential moving average (EMA).
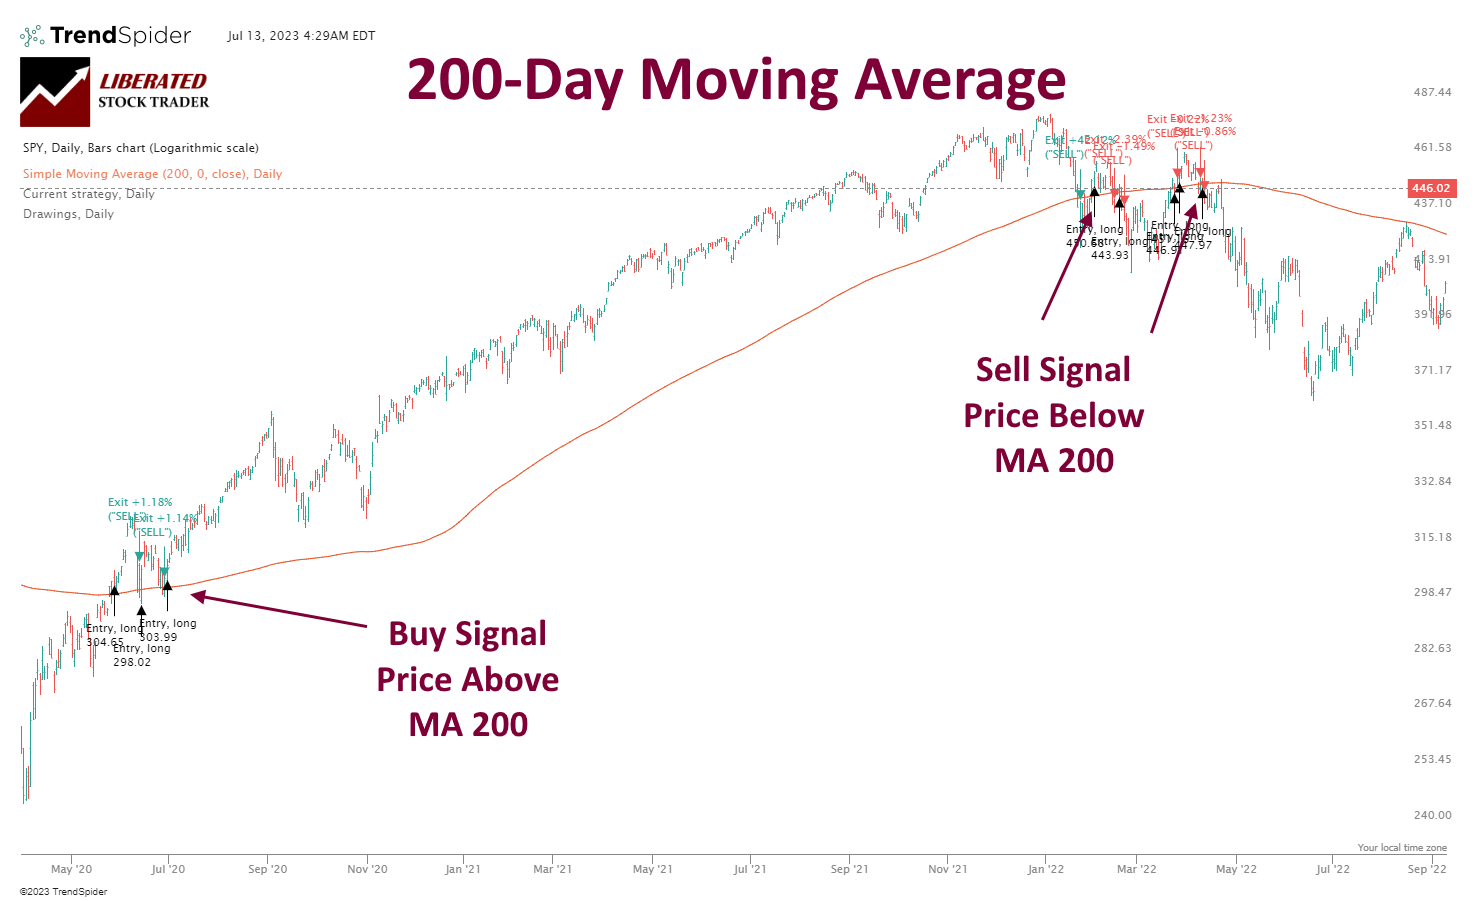
A moving average crossover happens when a short-term moving average (like the 50-day) crosses above a longer-term one (like the 200-day). People call this the golden cross, and it’s widely watched as a buy signal. Some traders use faster crossovers, such as the 9-day and 21-day EMAs, for quicker trades.
Most charting platforms, such as TradingView, make these crossovers easy to spot. They’re straightforward and fit well with trend-following strategies.
| Moving Average Type | Common Periods | Signal |
|---|---|---|
| Simple (SMA) | 50, 200 days | Golden Cross |
| Exponential (EMA) | 9, 21, 50 days | Short-term shifts |
Relative Strength Index (RSI) and Oversold Conditions
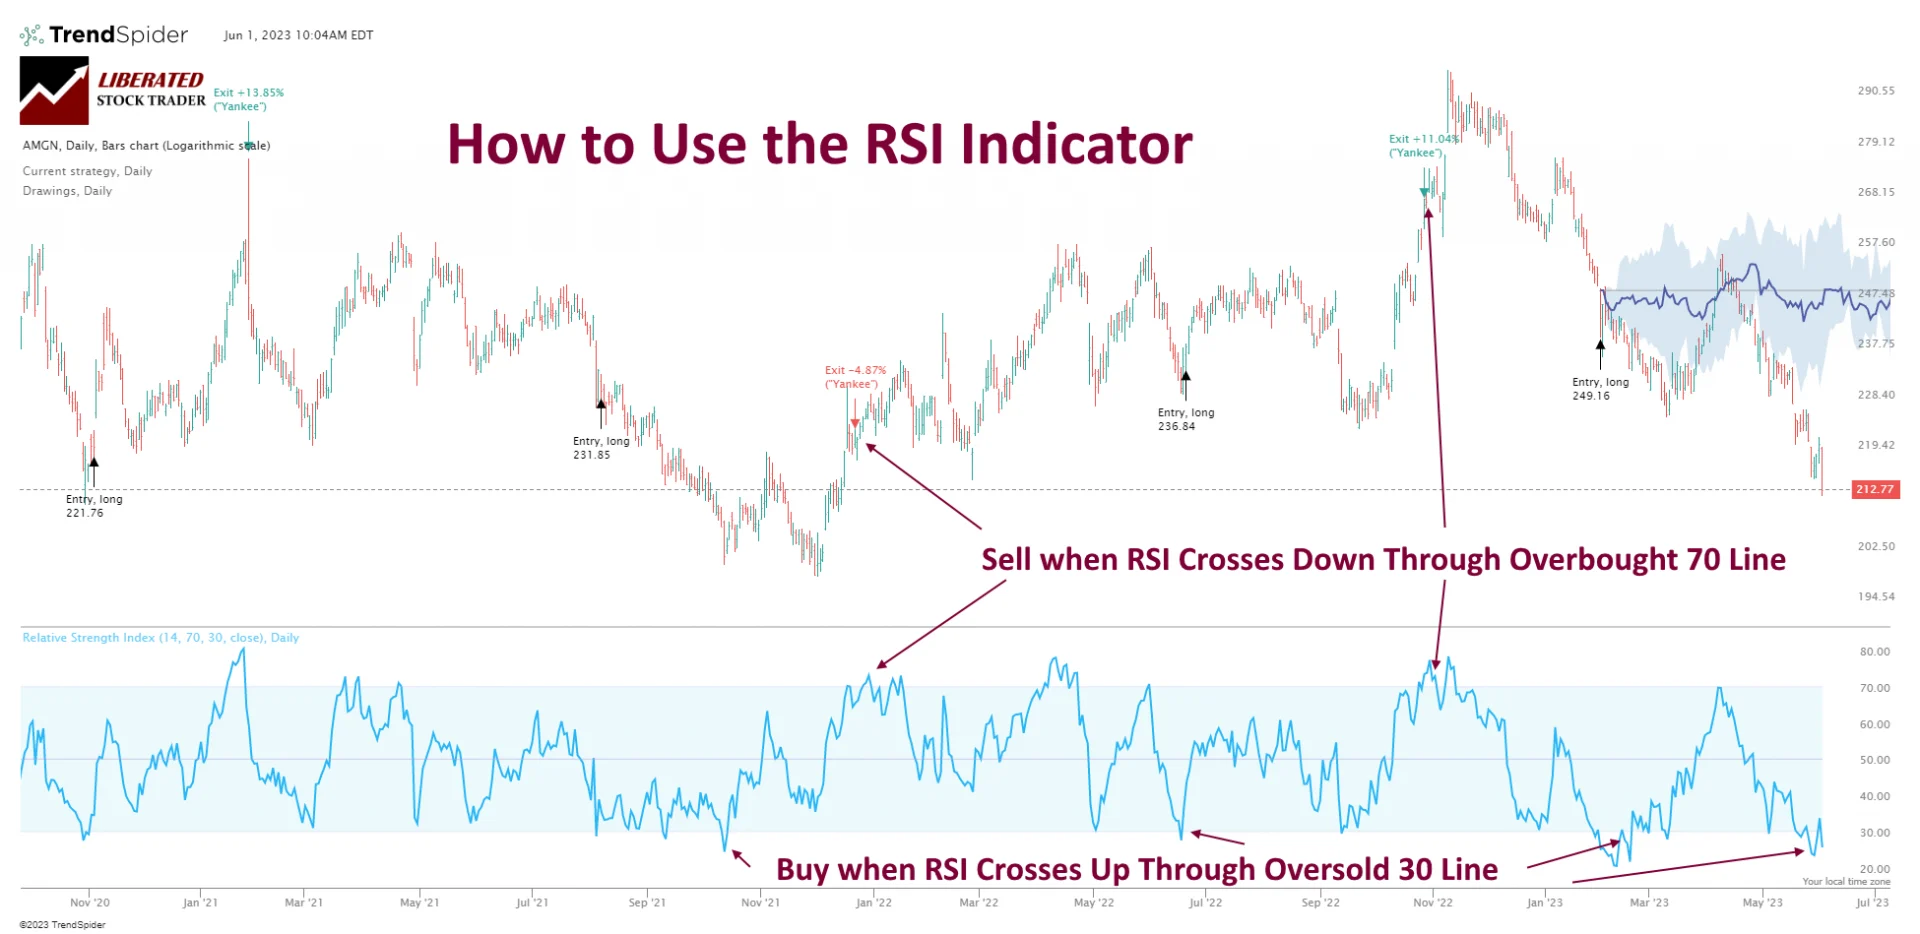
The relative strength index (RSI) is a momentum indicator that measures the speed and magnitude of price movement. It runs from 0 to 100.
If a stock’s RSI drops below 30, it’s considered oversold, which could indicate a potential bounce and a buying opportunity is near.
Some traders prefer to see the RSI rebound from oversold levels near a support zone—that combination can make the signal even stronger.
| RSI Value | Interpretation |
|---|---|
| < 30 | Oversold, possible buy |
| 30 – 70 | Neutral/No signal |
| > 70 | Overbought |
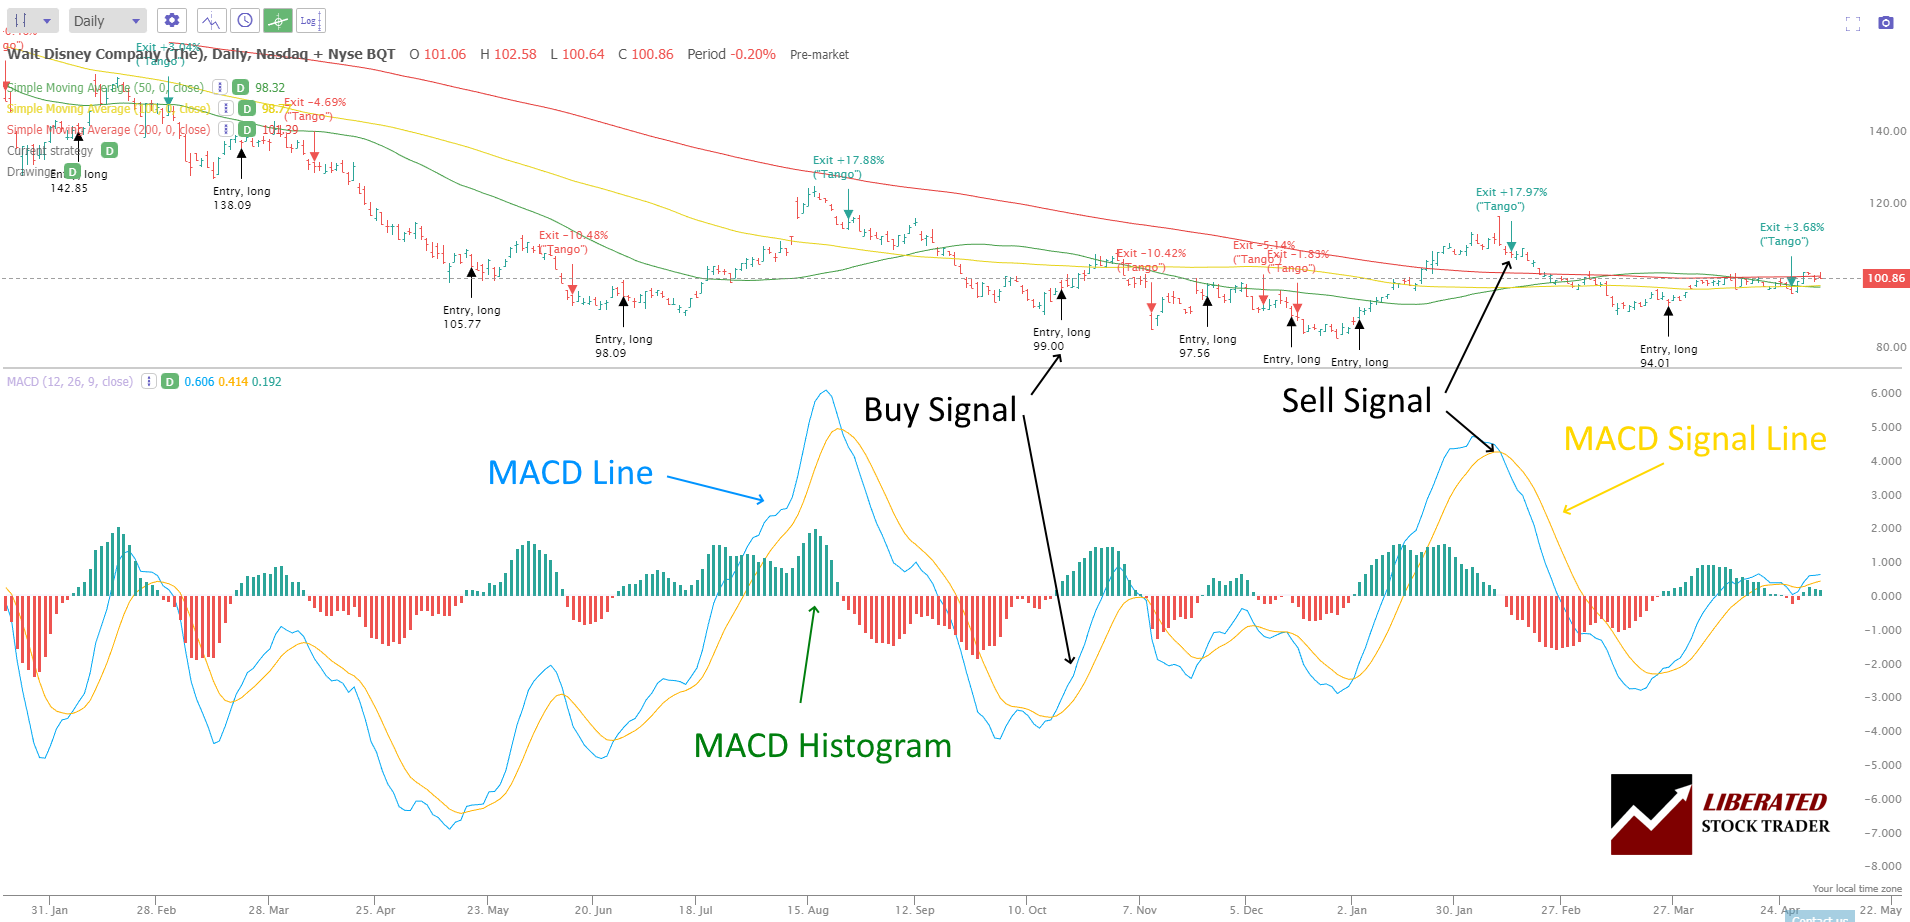
MACD and Signal Line Identification
MACD (Moving Average Convergence Divergence) is a favorite for trend-followers. It compares two EMAs—usually the 12-day and 26-day.
You’ll often see a buy signal when the MACD line crosses above its signal line (which is a 9-day EMA of the MACD). That crossover can mean momentum is flipping from down to up. Some individuals also watch for the MACD histogram to flip from negative to positive, as an additional confirmation.
People usually pair the MACD with other indicators to filter out bad signals, especially when the market is just chopping sideways.
Other Technical Studies: Bollinger Bands and Stochastic Oscillator
Bollinger Bands use a moving average with two standard deviation lines above and below. If a stock price hits or dips below the lower band, that often signals an oversold condition—maybe even a buy opportunity if the price bounces back.
The stochastic oscillator is a momentum tool that compares a stock’s closing price to its price range over a set period. When it drops below 20, that’s a hint the stock’s oversold and could be ready for a reversal.
Many traders seek confirmation from these tools, alongside major support and resistance levels, before pulling the trigger. Using several technical studies together can filter out false alerts and, hopefully, lead to better decisions.
Best Practices for Using Buy Signals in Your Trading Strategy
Getting the most out of buy signals really comes down to having a clear plan for entry and exit, sticking to smart risk management, checking your progress regularly, and being willing to adjust as the market shifts. Doing this can help traders use buy signals to make decisions that are both consistent and well-informed, or at least more so than just guessing.
Entry and Exit Points: Timing Your Trades
Timing is everything in stock trading. A good entry point lets you buy into strength and avoid getting faked out. Moving averages, chart patterns, and momentum indicators can all highlight the right moments to act.
Setting a clear profit target and picking stop-loss levels before entering helps keep emotions in check. For example:
| Entry Signal | Suggested Action |
|---|---|
| Cross above MA(50) | Begin position watch |
| Breakout on volume | Consider entry |
Short-term traders might chase quick price surges, while momentum investors prefer confirmed uptrends. Contrarian or value folks usually hunt for buy signals after declines or in oversold spots.
Incorporating Risk Management Techniques
Traders should match position size to their own risk tolerance and big-picture portfolio plan. Setting stop-loss orders can cap downside risk if things don’t go your way.
It’s usually smart to risk just a small slice of your capital—say, 1-2% per trade. Using clear take profit levels helps lock in gains and avoid giving them back during wild swings. Spreading trades across sectors or trends can also help cut down on concentration risk.
Evaluating Performance, Consistency, and Accuracy
It’s a good idea to regularly review how your buy signals have performed. Tracking accuracy, consistency, and past results can reveal which signals actually work for you under different market conditions.
Key metrics to track include:
- Win/loss ratio
- Average gain per trade
- Maximum drawdown
- Consistency of signals over different time frames
Keeping a trading journal really helps with this kind of analysis. Comparing your signals to market benchmarks can show if your approach is actually beating the market or just riding along with it.
Adapting Buy Signals to Market Volatility and Trends
Buy signals don’t work equally well in every market. High volatility can trigger more false alarms, so some traders tighten stop-losses or scale down position sizes.
Adjusting your criteria in trending or choppy markets can help you keep up with changing sentiment. For example, momentum strategies tend to shine in trending markets, while contrarian approaches might work better when things are range-bound.
Staying tuned in to volatility, sentiment, and what’s hot in different industries lets you tweak your approach on the fly—ideally reducing risk and improving results as the market shifts under your feet.
FAQ
What indicators reflect strong buy signals in stocks today?
Strong buy signals often show up as moving average crossovers, like when the 50-day moving average climbs above the 200-day. Big jumps in trading volume and bullish chart patterns (think double bottoms or breakouts over resistance) can also point to a good buying opportunity.
Analysts keep an eye on MACD (Moving Average Convergence Divergence) flipping positive, or RSI (Relative Strength Index) bouncing up from an oversold level, usually under 30.
How can traders utilize the RSI indicator for buy and sell signals?
If the RSI drops below 30, that often suggests a stock’s oversold and might be due for a rebound—a possible buy signal. On the flip side, an RSI over 70 could mean the stock is overbought and maybe ready for a pullback or sell.
Many traders like to confirm RSI signals by watching for price reversals or pairing them with other indicators.
What are some clear examples of trading signals in stock trading?
Some classic examples: a golden cross (short-term moving average crossing above a long-term one), or breakouts from chart patterns like cup and handle or inverse head and shoulders—these are popular buy signals.
For sell signals, a death cross or a break below support can do the trick.
What strategies help identify buy signals in the stock market?
Trend-following strategies watch price movement for upward momentum. Technical analysis hunts for breakouts, crossovers, or reversals.
Most traders blend a few indicators—like volume with moving averages—to confirm a buy signal before jumping in.
How does the 7% rule apply to buying and selling stocks?
The 7% rule usually means you set a stop-loss order about 7% below what you paid for a stock. If the price slips down by that amount, you just go ahead and sell—better to take a manageable loss than watch it spiral out of control, right?
Plenty of investors lean on this approach to keep risk in check and avoid those gut-wrenching, unexpected plunges.