A boom and bust cycle is when the stock market experiences large increases and decreases in value. Several factors, such as changes in economic conditions, investor sentiment, or company performance, can cause this. The cycle can last for a few months or even years and significantly impact the economy and individual investors.

Stock market booms
During a boom phase, stock prices tend to rise rapidly as investors are optimistic about the future and are willing to pay more for shares. This can lead to a situation where stock prices become “inflated” and are not supported by the underlying fundamentals.
Stock market busts
Eventually, this bubble will burst, leading to a sharp decline in stock prices (the bust phase). This can cause widespread economic damage as investors lose confidence and companies struggle to raise capital.
Boom and bust cycles are a natural part of the stock market, but they can be difficult to predict. For this reason, it’s important to diversify your investment portfolio and to have a long-term view when investing in the stock market.
Moses helps you avoid stock market crashes
Beat The Market, Avoid Crashes & Lower Your Risks
Nobody wants to see their hard-earned money disappear in a stock market crash.
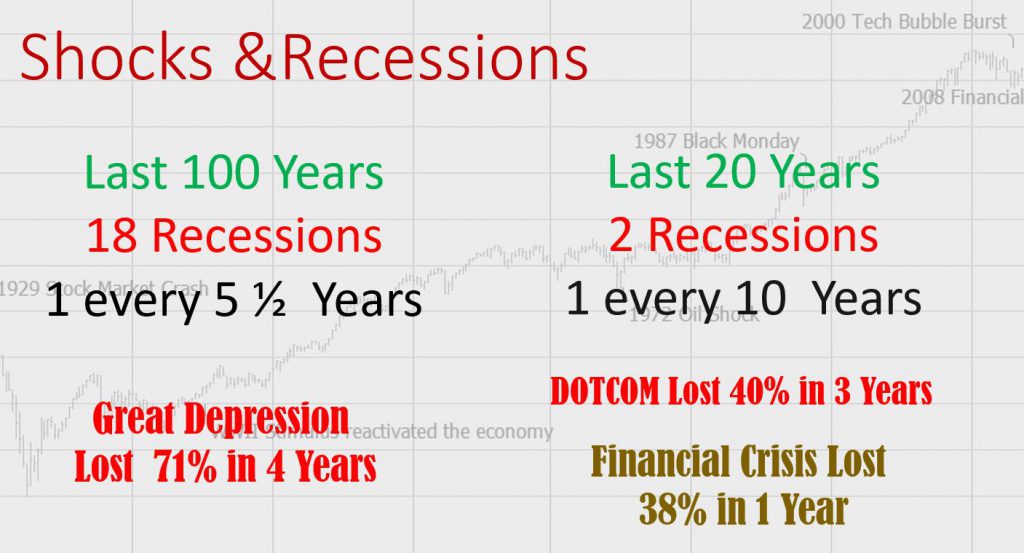
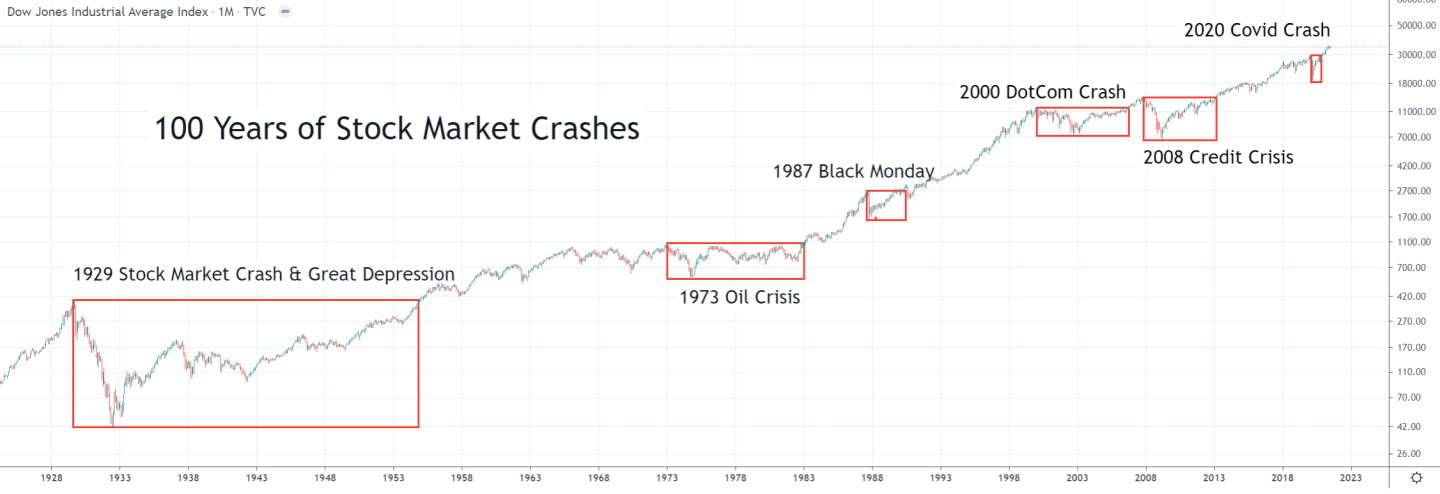
Over the past century, the US stock market has had 6 major crashes that have caused investors to lose trillions of dollars.

The MOSES Index ETF Investing Strategy will help you minimize the impact of major stock market crashes. MOSES will alert you before the next crash happens so you can protect your portfolio. You will also know when the bear market is over and the new rally begins so you can start investing again.
MOSES Helps You Secure & Grow Your Biggest Investments
★ 3 Index ETF Strategies ★
★ Outperforms the NASDAQ 100, S&P500 & Russell 3000 ★
★ Beats the DAX, CAC40 & EURO STOXX Indices ★
★ Buy & Sell Signals Generated ★
MOSES Helps You Sleep Better At Night Knowing You Are Prepared For Future Disasters
Why do booms and busts occur?
Take, for example, the famous Dotcom boom of 2000. Greed surged into the stock market on the misplaced belief that new internet-based technology would fundamentally shift the future market dynamics and business models. Technology became fashionable, and “Bricks and Mortar” businesses were perceived as outdated and almost worthless. This paradigm shift meant that money poured into technology stocks at an unrepentant rate, and capital flowed out of “Bricks and Mortar” shares at an equal rate.
A telltale sign of problems to come was noticeable when stock analysts would suggest price-earnings valuations on tech stocks of 200, 300, or more, which were reasonable even though the companies in question had never made a profit. The Price Earnings Ratio is the ratio of the Stock Price to its actual earnings.
If a P/E Ratio is at 30, it will take the company 30 years to earn back the share price. The higher the P/E ratio, the higher the expectation that the stock will perform well in the future. You can also see the P/E ratio as a valuation of the stock’s worth. If the P/E is 200, you essentially pay 200 times the company’s earnings capacity.
In the Year 2000, the P/E Ratio of the S&P500 reached nearly 45. This was an all-time high and essentially indicated that the market participants’ expectations were utterly unrealistic. By the time the inevitable correction was completed, the P/E ratio for the S&P500 had halved to just over 20.
Professional analysts and so-called market gurus fueled much of the greed and hype. They became greedy and euphoric, a heady mixture. When everyone slowly realized that the tech industry would not meet the enormous profit expectations, the entire sector collapsed, bringing other industries, indexes & markets with it. The Tech Bubble had burst.
Stock market crashes and recoveries
Our analysis of six major US stock market crashes in the last 100 years shows that it takes 9.8 years to recover. The average peak loss of these crashes was 57%. This can be somewhat misleading, though. The 1929 crash was exceptional in its size and duration. Additionally, governments and dovish central banks have realized that they can manage inflation and stimulate the economy to speed up economic and stock market crash recovery.
Over the last 20 years, we have had three major crashes, with an average loss of 62% but an average recovery time of 7 years.
| Stock Market Crash (Year) | Size of Crash % | # Years to Recover |
| 1929 | -89% | 23 |
| 1973 | -46% | 10 |
| 1987 | -35% | 2 |
| 2000 | -83% | 16 |
| 2008 | -54% | 5 |
| 2020 | -38% | 1 |
| Average | -57% | 9.8 |
Table 1: Stock Market Crashes & Their Impact
Stock Market Crashes In History: A Timeline
Video: Stock Market Booms, Crashes & Crisis
Video From The Liberated Stock Trader Pro Masterclass Course
How does this affect our investments?
The boom is good for our investments in the short term, but only if we move into cash before the bust, which, of course, only the enlightened few ever manage to achieve.
So, who suffers the wrath of the bust? The private investor, you and I! We lost money in our pensions, mutual funds, and stock portfolios; we lost jobs, earning power, and risk appetite.
It seems that the time interval between the economic crisis and the boom-bust sequence is happening at shortening intervals, so it always pays to beware. When every analyst is screaming “Buy Buy Buy” and acting like the best thing in the world is happening, that is the time to be most careful.
When all the market reports are reiterating what a depressing time it is, how there is no future in the stock market, and when prices have lost 20% or even 50% of their value, that could be one of the best times to buy.