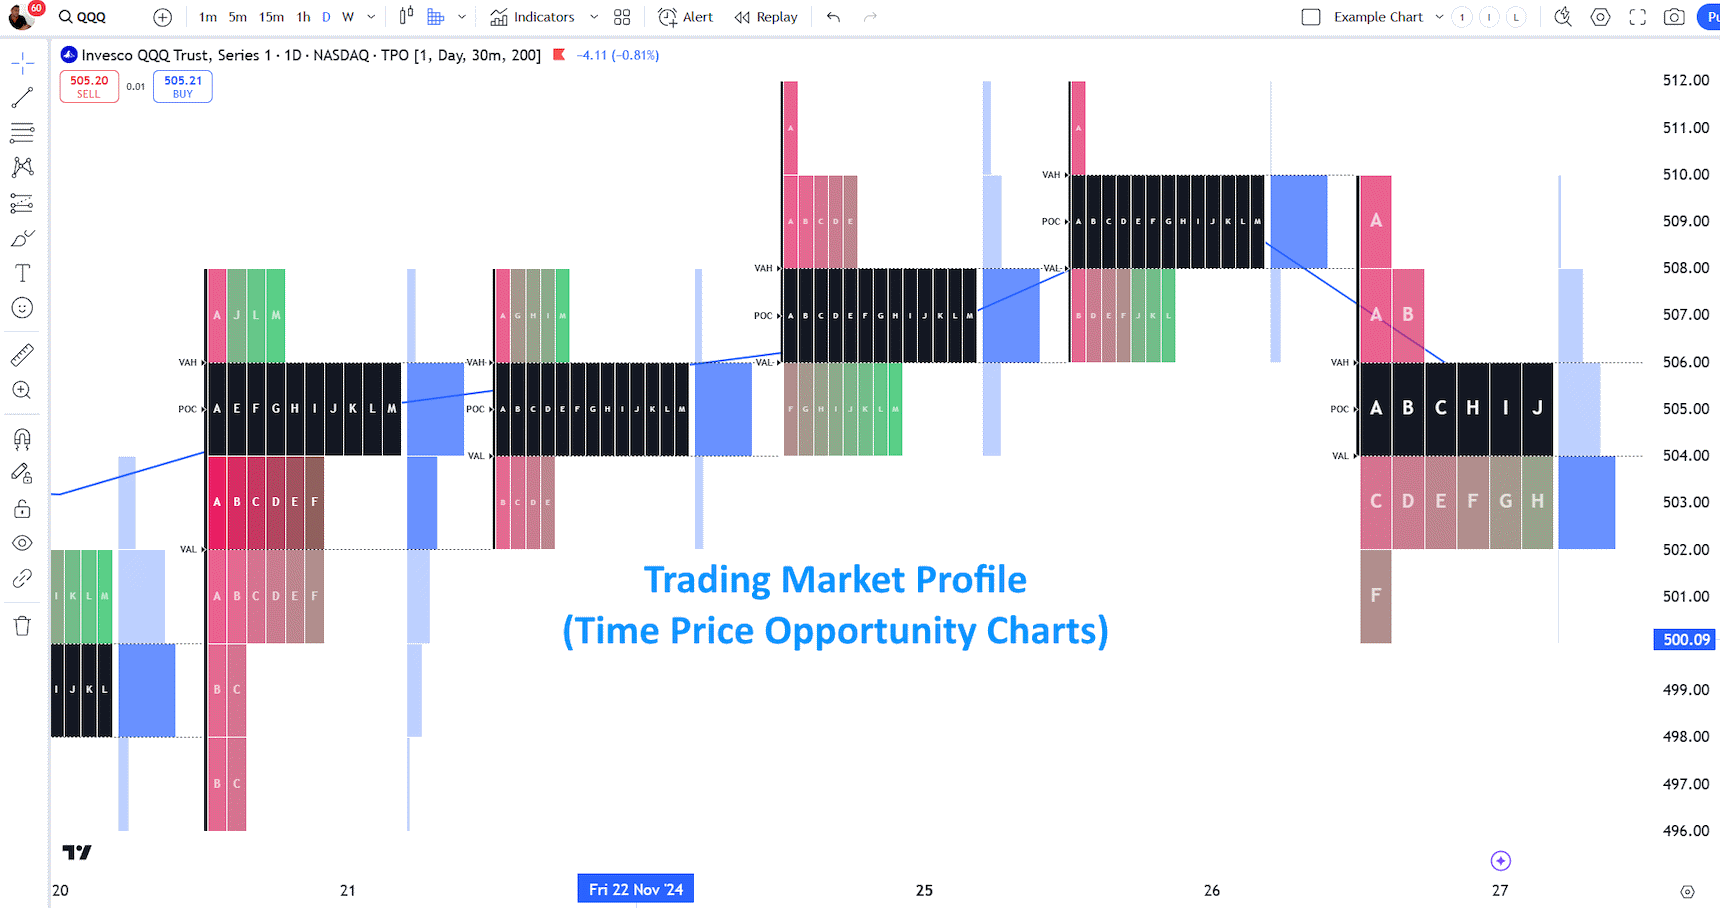
A Market Profile chart displays price activity to identify a time-price opportunity (TPO). It helps traders identify the most traded prices and develop strategies to exploit these areas. It is based on the concept of volume at price, also known as market profile or volume profile.
Each TPO represents a specific price level at which trading occurred during that time segment. The longer the horizontal line represents a TPO, the more transactions occur at that price level. This information can be used to identify key support and resistance levels and areas of high trading activity.
By looking at a Market Profile chart, traders can see where the market has been over the day and develop trading plans accordingly. It helps find supply and demand levels and possible turning points in price action. Using this information, informed traders can enter trades with better chances of being profitable.
Market profile charts were first introduced by J. Peter Steidlmayer in the 1980s and have since become a popular tool among technical analysts and traders. The chart is divided into time segments called TPOs and typically shows one day’s worth of trading activity.
Key Takeaways
- Market Profile Charts display the most traded prices and volumes, helping traders identify key price levels.
- Market Profile Charts identify time-price opportunities (TPOs), highlighting areas where price has spent significant time, indicating strong support or resistance levels.
- Market Profile Charts allow day traders to identify optimal entry and exit points for short-term trades.
- By analyzing the most-traded price and volume profiles, traders can identify patterns, trends, and market sentiment.
What is a Market Profile Chart?
The Market Profile chart uses price and time to visualize market action and the most important prices of a day’s trading. The three core concepts are the point of control (POC), the time price opportunity (TPO), and 30-minute time blocks.
Market Profile Charts were developed in the 1980s by the Chicago Board of Trade Director and trader J. Peter Stiedlmayer. Stiedlmayer’s concepts of Market Profile charting and the Liquidity Databank were huge steps forward in using charting for trading and providing liquidity.
How to Read a Market Profile Chart
To interpret a Market Profile Chart, you must understand the key terminology, the point of control (POC), the time price opportunity (TPO), and the time block.
1. Point of Control (POC)
The Point of Control (POC) is the price at which most trades occur during a certain period. It can be considered an important reference point for traders, as it reflects the majority opinion on where prices may move.

The Point of Control is the stock’s fair price for the day. This is when the stock is traded the most during the day, week, or month. This is also called value pricing, where most traders see the equity value as fair.
The value area is the price range at which 70% of the action happens.
2. Time Price Opportunity (TPO)
The Time Price Opportunity (TPO) indicates the volume and liquidity at each price level throughout the day’s trading. It essentially tells you how many trades were done at each price.
Above the point of control suggests the stock is overpriced; therefore, a possible confirmation for a short-term short. Below the point of control would mean a possibly undervalued equity, thus a possible long trade.
Each letter in a time block represents a TPO. This shows the amount of trading activity at each price level.
3. Time Blocks
The 30-minute time blocks indicate the opening and closing of the markets and any noteworthy changes in trading volume throughout the day.
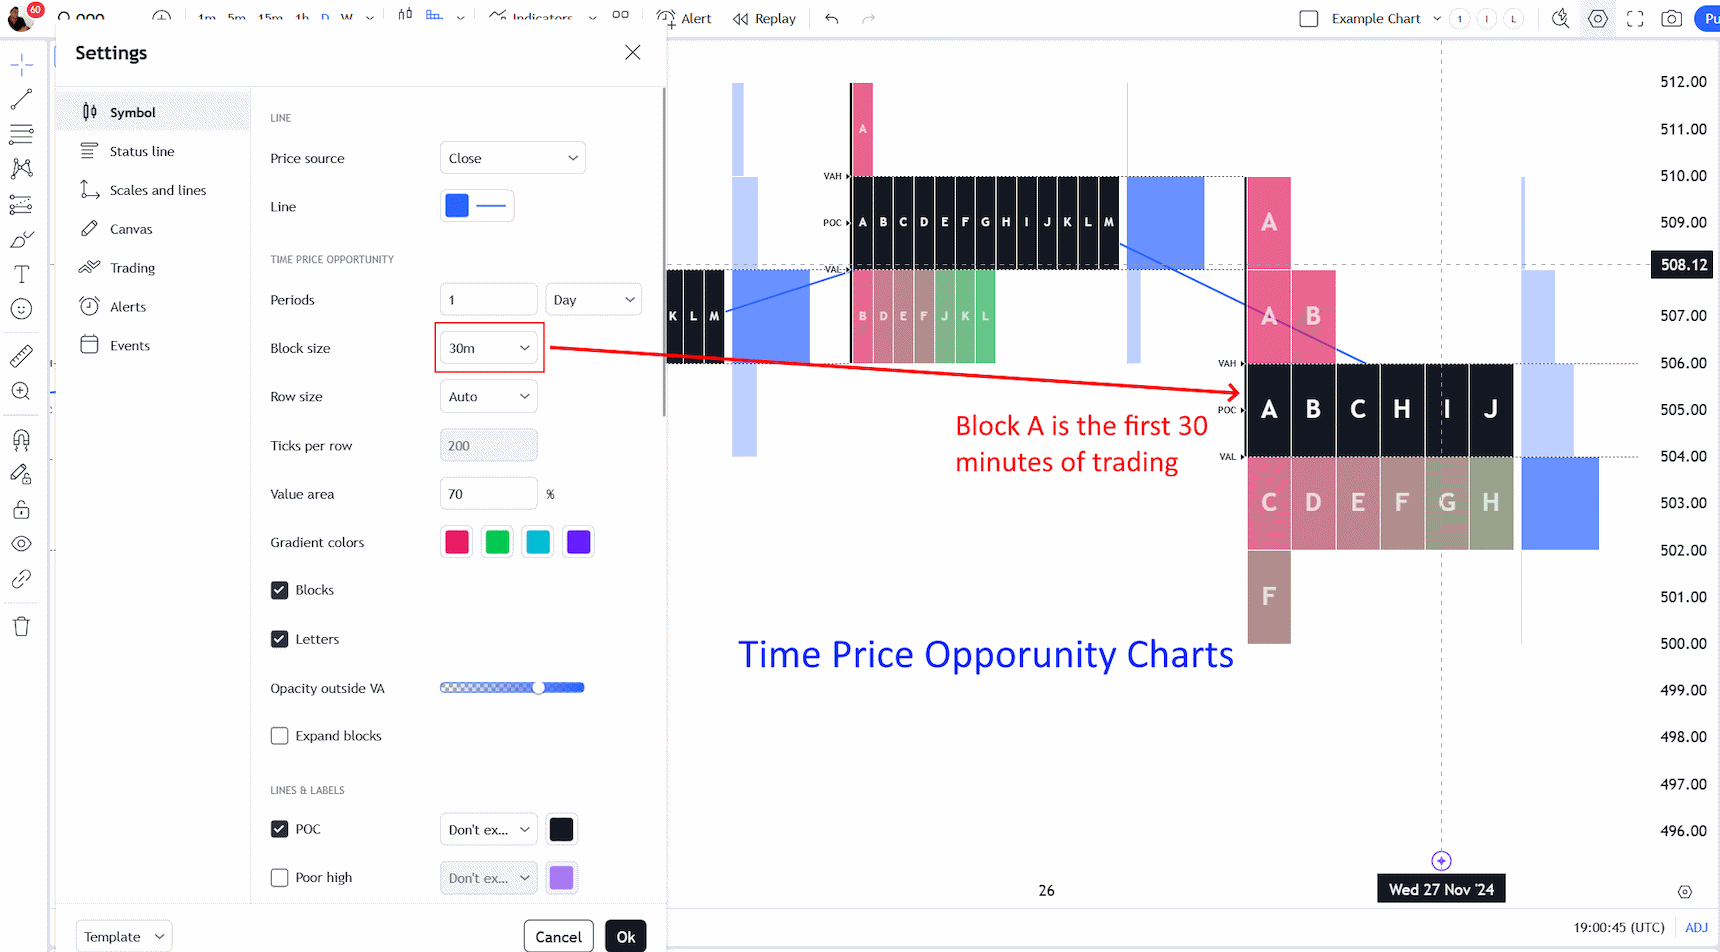
“A” represents the first 30 minutes of trading, and “B” represents the second 30 minutes. The point of control is the area (price range) where most trades occur during the day. Lowercase lettered time blocks represent out-of-market hours trading.
| Market Profile Time Block | Start Time | End Time |
| A – Market Open | 08:00 | 08:29 |
| B | 08:30 | 08:59 |
| C | 09:00 | 09:29 |
| D | 09:30 | 09:59 |
| E | 10:00 | 10:29 |
| F | 10:30 | 10:59 |
| G | 11:00 | 11:29 |
| H | 11:30 | 11:59 |
| I | 12:00 | 12:29 |
| J | 12:30 | 12:59 |
| K | 13:00 | 13:29 |
| L | 13:30 | 13:59 |
| M | 14:00 | 14:29 |
| N | 14:30 | 14:59 |
| O – Market Close | 15:00 | 15:29 |
3. Volume Profile
The volume profile visually represents both the TPO and the value area. It displays the volume traded at each price level, giving traders an idea of where most trading activity is concentrated.
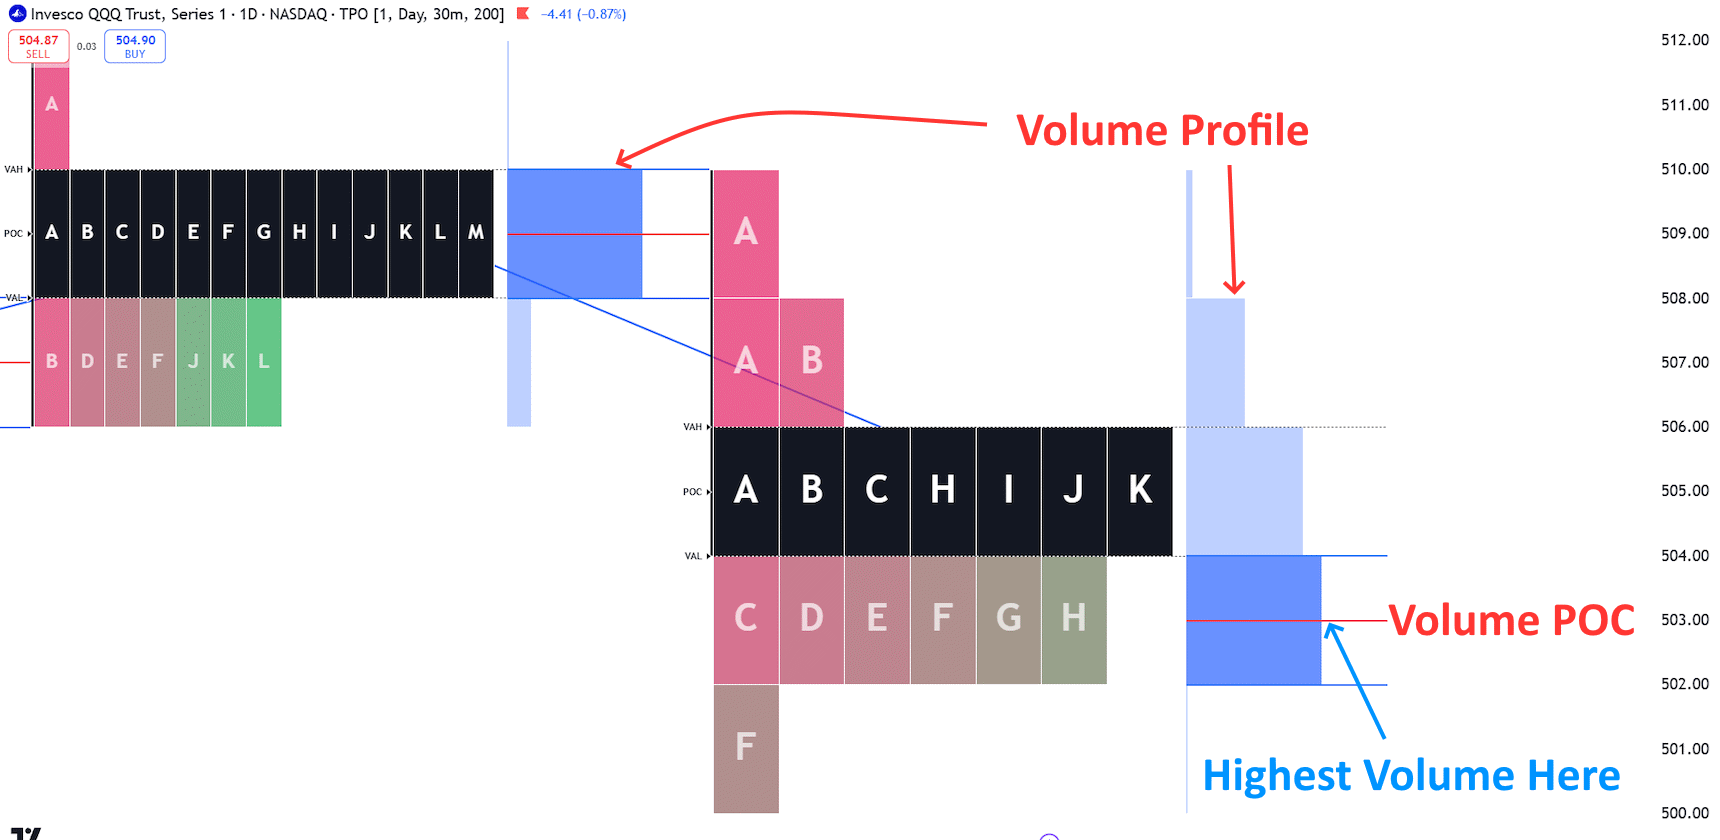
By combining TPO and volume profile, traders can better understand market sentiment and potential trading opportunities. A stock with high volume and trading within or above the value area could indicate strong bullish sentiment. Conversely, low volume within or below the value area may suggest a bearish sentiment.
4. Market Profile
The market profile chart combines all of this information into one easy-to-read chart. It shows the distribution of trades throughout the day’s trading session, with each bar representing a specific period.
The longer the bar, the more volume and trading activity occurred during that time frame.
Traders can use market profile charts to identify key support and resistance levels and potential breakout or reversal areas. By paying attention to where most trading activity occurs on the profile chart, traders can gain insight into market sentiment and potential market direction.
When the price is above and below the value areas, this represents a possible ideal buying or selling point.
TradingView 4.8/5⭐ : The Best Trading Platform I’ve Tested in 20+ Years
With lightning-fast charts, powerful pattern recognition, smart screening, backtesting, and a global community of 20+ million traders — it’s a powerful edge in today’s markets.

If you want one platform that gives you an edge, this is it.
Market Profile Trading
The Market Profile chart is a graphical representation of the traded volume within specific time blocks. It can be used to identify potential buying and selling points for traders.
The higher the traded volume in a time block, the more significant it is as a support or resistance level. The points above and below the value areas represent possible ideal buying or selling points.
The Market Profile chart is also useful for determining market sentiment and the number of active traders during specific time blocks. It can also be helpful for technical analysis, as it provides information about the underlying factors affecting price action.
Buy and Sell Signals
When an area has a higher traded volume, it is typically a good time to buy or sell. Traders should look for areas where the traded volume increases significantly at specific points within the chart.
This could indicate strong support or resistance levels and potential buying or selling opportunities.
When looking at the Market Profile chart, traders should also look for areas of accumulation or distribution. Accumulation occurs when traders buy up an asset, and distribution occurs when traders sell it off.
This can be a good sign for potential buying or selling opportunities, as it indicates an imbalance between supply and demand in the market.
Best Software for Market Profile
In my opinion, TradingView is the best software for market profile analysis. Its charts are user-friendly and offer a wide range of customization options to suit individual trading styles. It also has a feature called “Volume Profile,” which specifically displays the volume traded at each price level, making it easy to identify areas of accumulation or distribution.
Summary
People who use market profile charts become evangelists for the cause. They believe it offers unique insights into buy and sell opportunities. It can be a good option if you are a quick-fire day trader.
On the downside, it can require serious effort to learn how to use them, and very few stock chart services offer this type of chart.