Renko charts are a technical analysis charting technique developed in Japan to identify trends and potential trading opportunities. They are based on the concept of price action rather than time.
Renko charts filter out unnecessary price fluctuations to provide a clear stock price trend that traders can use in their investing strategies.
Unlike traditional candlestick or bar charts, Renko charts only plot price movements above or below a predetermined amount, known as the “brick size.” This means that each brick on the chart represents a certain amount of price movement, regardless of how much time has passed. This makes them less susceptible to distortions caused by time of day, volume, or news releases.
Renko charts are gaining popularity because they can filter out market noise and provide a clearer picture of price action.
What are Renko charts?
Renko means Brick in Japanese, and Renko charts are created by placing a brick in the next column once the price moves a predetermined amount from the previous brick. The size of the move is called the “box size.” Renko charts can identify trends, support and resistance levels, and potential buy and sell signals.
How Renko charts work
Renko charts are a type of chart where you put a brick in the next column every time the price moves a certain amount. This happens when the price goes higher or lower than the price of the last brick. They can determine how strong a trend is, where support and resistance levels are, and when to buy or sell.
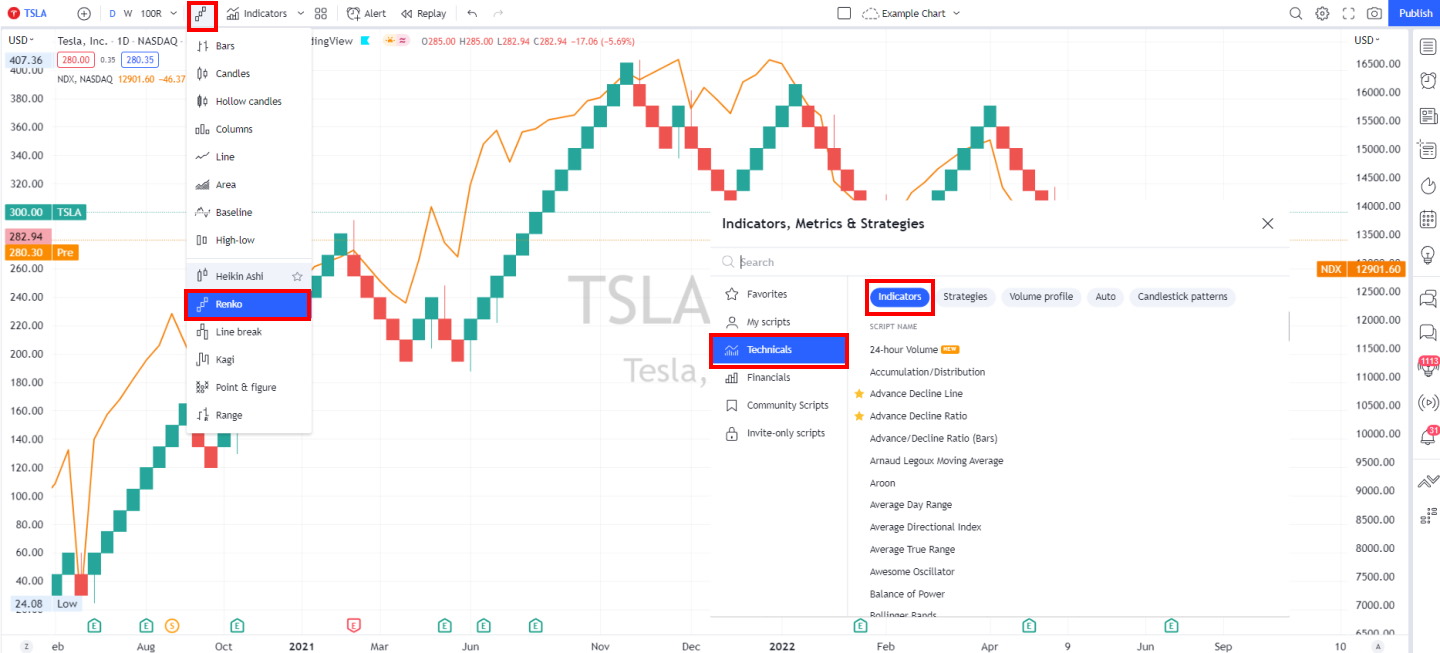
How to Get Free Renko Charts
TradingView offers free Renko charts. Its powerful and flexible real-time Renko charts are available with its free service tier for all users.
TradingView 4.8/5⭐ : The Best Trading Platform I’ve Tested in 20+ Years
With lightning-fast charts, powerful pattern recognition, smart screening, backtesting, and a global community of 20+ million traders — it’s a powerful edge in today’s markets.

If you want one platform that gives you an edge, this is it.
How are Renko charts calculated?
The first step is to determine the box size. This is done by looking at the recent price action and finding a reasonable range in which prices have moved. Once the box size has been determined, the next step is to find the most recent high and low prices. The difference between these two prices is the “true range.”
The next step is to calculate the true range’s midpoint. This is done by adding the most recent high and low prices and dividing by two. The midpoint is then used to plot the first brick on the chart.
If the next price move is higher than the midpoint of the previous true range, a new brick is plotted in the next column with its top at the new high price. If the next price move is lower than the midpoint of the previous true range, a new brick is plotted in the next column with its bottom at the new low price. This process is repeated until no more price moves meet the criteria for plotting a new brick.
Renko chart time axis
The time axis on a Renko chart is not as important as on a candlestick or bar chart. The bricks are only plotted when the price moves a certain amount from the previous brick. As a result, the time axis can be disregarded for most purposes. However, there may be times when it is helpful to look at the time axis to get a better understanding of how long a trend has been going on.
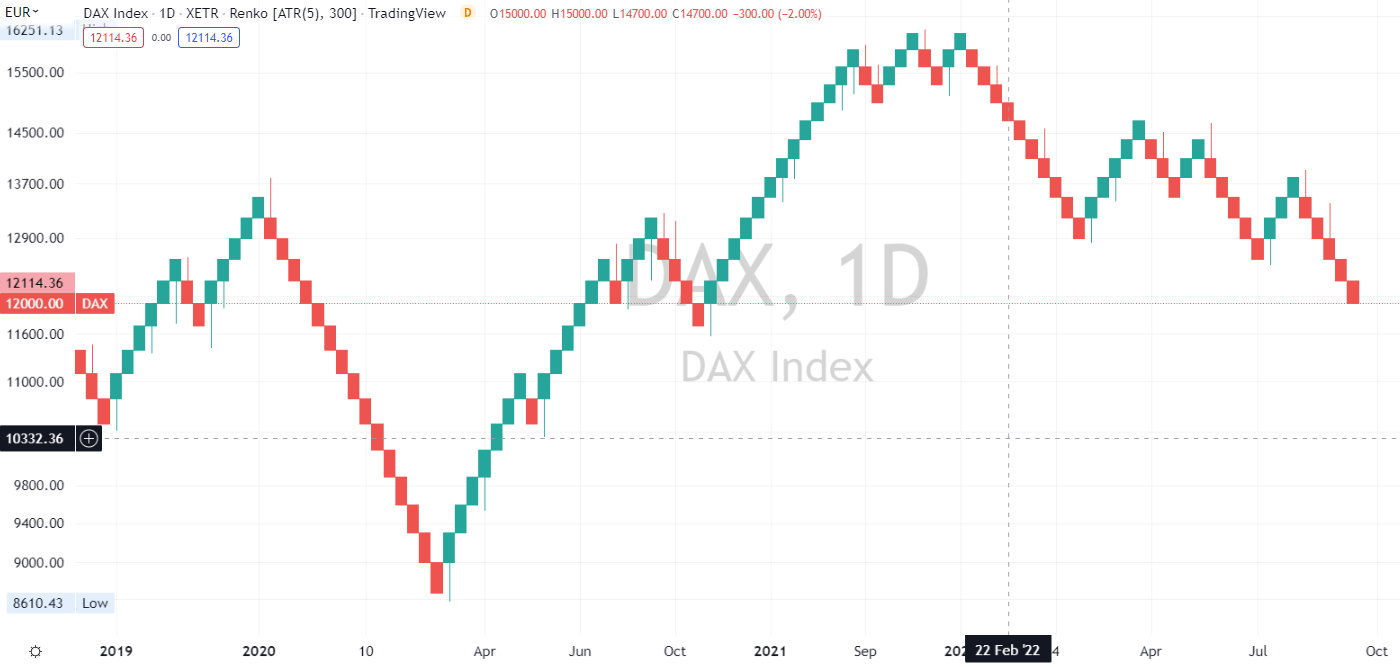
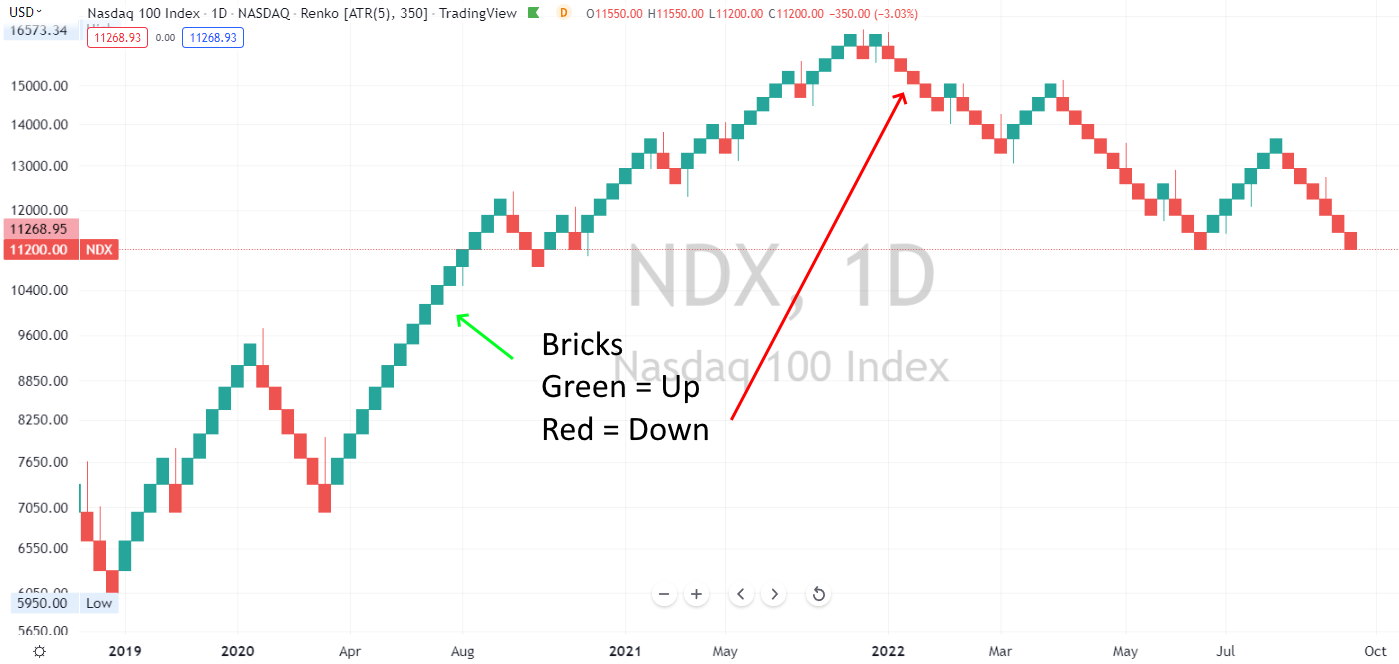
The chart above shows that if a stock moves very little over a given period, the date range on the chart seems very small. This chart of the German DAX shows that between 2019 and 2020, the major German index moved very little and, consequently, was of little interest to traders.
Trading signals
Renko charts can be used to identify potential buy and sell signals. The most common way to generate trading signals on Renko charts is to look for clusters of bricks that form at support and resistance levels. When a buy signal is generated, it is important to wait for the price to break above the resistance level before taking the trade.
Conversely, when a sell signal is generated, waiting for the price to break below the support level before taking the trade is advisable.
The best Renko charting platform
Renko charts are an excellent way to visualize the movement of assets in markets. TradingView provides the leading Renko charting services for free, including Renko pattern recognition.
Why TradingView is the best charting software
Support and resistance levels
Renko charts can be used to identify support and resistance levels. This is because the bricks plotted on the chart represent price moves greater than the box size. As a result, any level with a cluster of bricks is likely to be a support or resistance level.
The chart below shows the support and resistance levels I have plotted to demonstrate that a new price trend emerges when these levels are broken. Breaking these trendlines represents a new buying or selling opportunity.
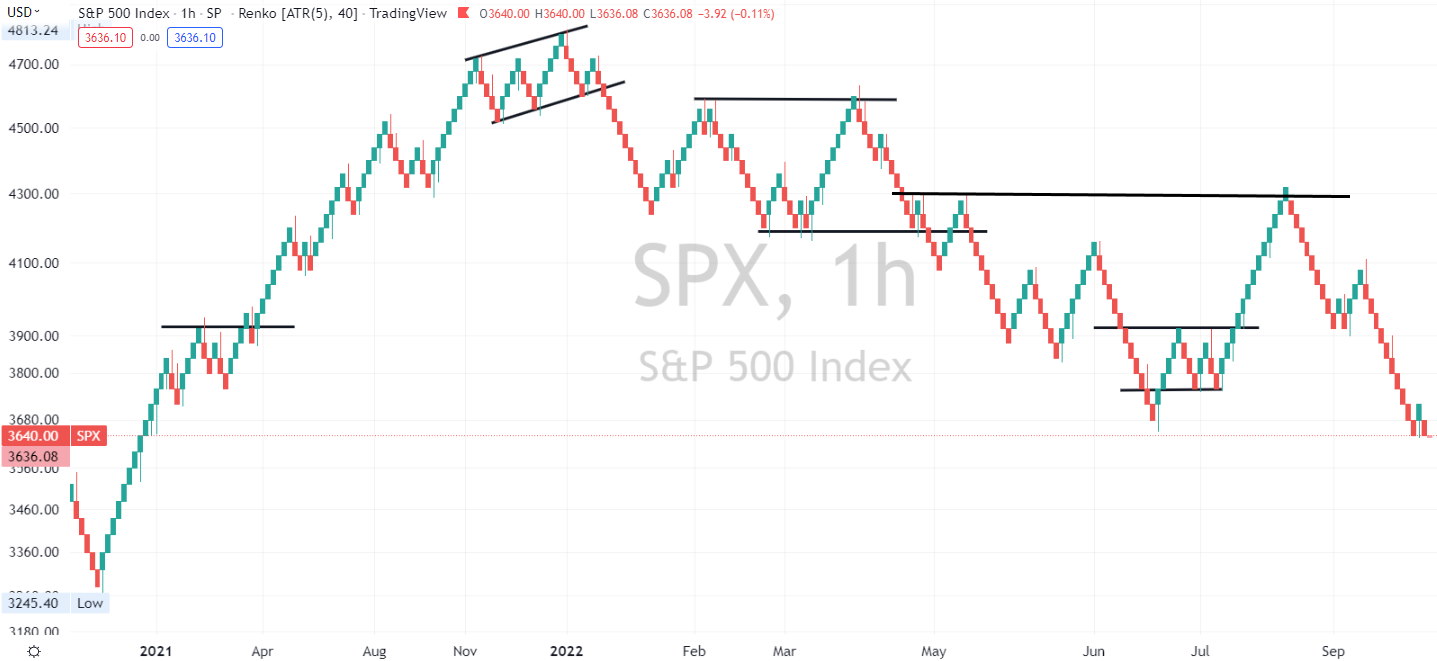
It is also important to note that a Renko chart’s support and resistance levels are more static than other charts. The bricks are only plotted when the price moves a certain amount from the previous brick.
As a result, the support and resistance levels will change as the price moves up or down.
ATR Settings with Renko
As mentioned earlier, it is important to use a box size based on the market’s average true range to ensure that the bricks are plotted in a lower volatility range. You can calculate the average true range by using the following:
ATR = (High – Low) / (High + Low)
Once you have determined the average true range, you can set up your Renko charts. One way to do this is by using the ATR indicator to help you determine the size of your boxes. This can be done by setting up an indicator window with the following settings:
- Period: 14
- Applied price: Close
- Type: Average True Range
Of course, you must visually tune each asset’s Renko chart to ensure you can see clear trends. In the chart below, I have tuned the Nasdaq 100 index to an ATR length of 5, providing clear trend signals.
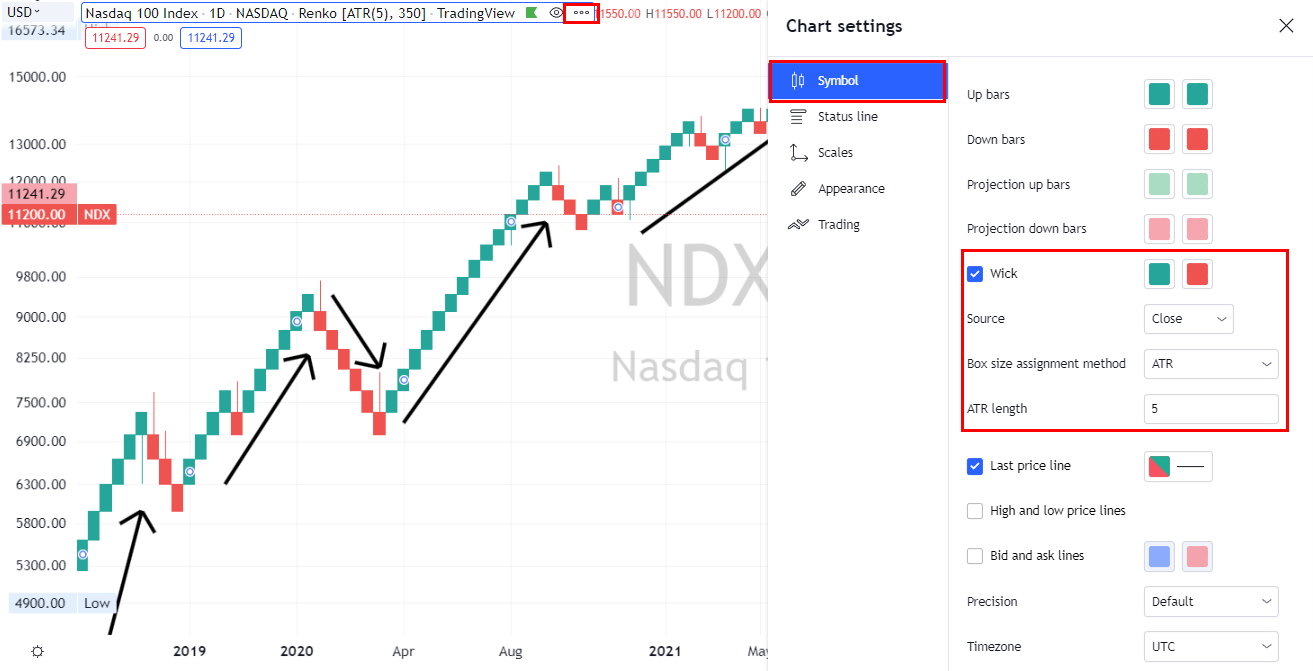
Once these settings are entered, the ATR indicator will automatically calculate the average true range for each bar and plot it on the chart. You can then use this information to set the size of your boxes.
Renko chart wicks
When used on Renko charts, wicks can help traders identify possible support and resistance areas. Wicks represent the high and low points for a given trading period and can help determine where security may be overbought or oversold.
The chart below highlights Renko chart wicks.
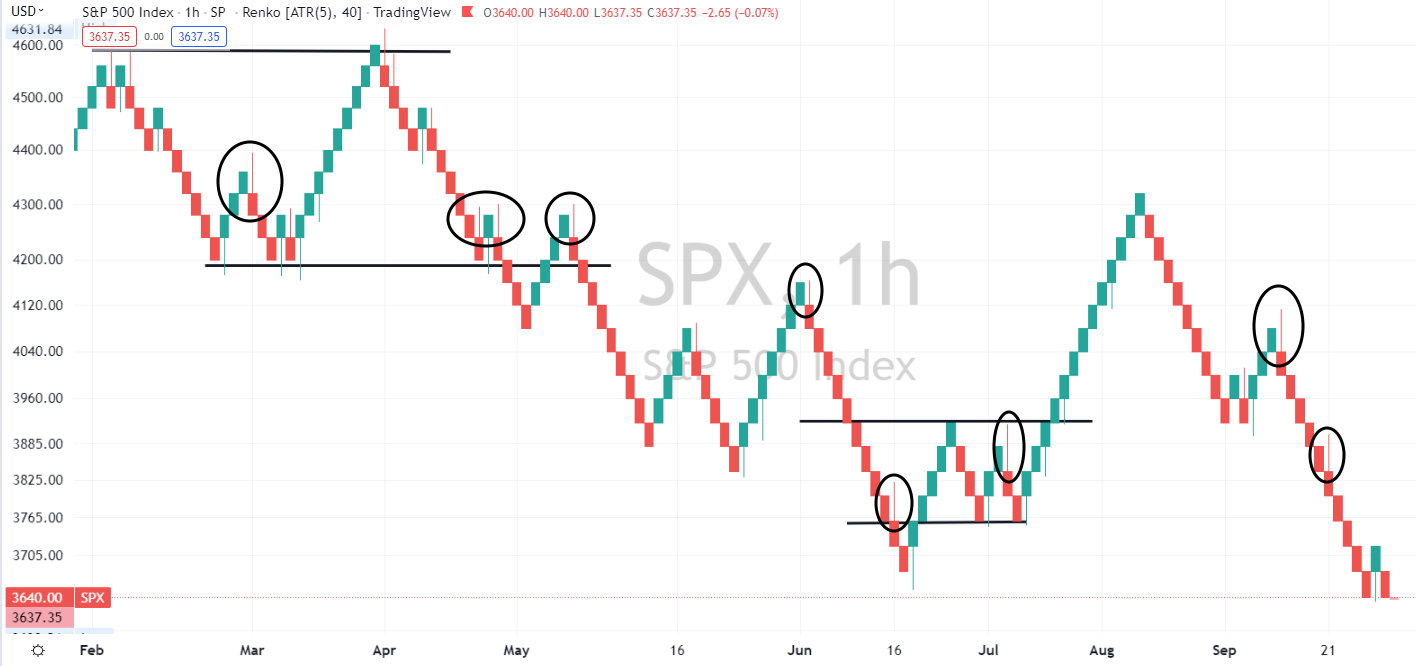
When using wicks on Renko charts, it is important to remember that they represent the high and low points for a given period, not the entire day. As a result, they should not be used as a sole indicator when making trading decisions.
Renko box sizes
The box size is the most important parameter when using Renko charts. It will determine the detail displayed on the chart, so it is important to find a box size that works well for your trading style and market conditions.
There are a few things that you can do to help you select the right box size:
1) Use a box size based on the market’s average true range. This will help ensure that the bricks are plotted within a reasonable range and are not too large or small.
2) Use a box size based on the chart’s time frame. For example, you may want to use a smaller box size when trading shorter time frames and a larger box size when trading longer time frames
3) Choose a box size based on your trading style. For example, an aggressive trader may want to use a smaller box size to get more trade signals. A more conservative trader may want to use a larger box size to wait for better trade setups.
Can you use traditional stock chart patterns on Renko charts?
Yes, you can use traditional stock chart patterns on Renko charts. However, the support and resistance levels will differ from those on traditional charts.
In the chart below, I demonstrate how TradingView’s automated stock chart pattern recognition highlights the major stock chart patterns on the S&P 500 from 2012 to 2022.
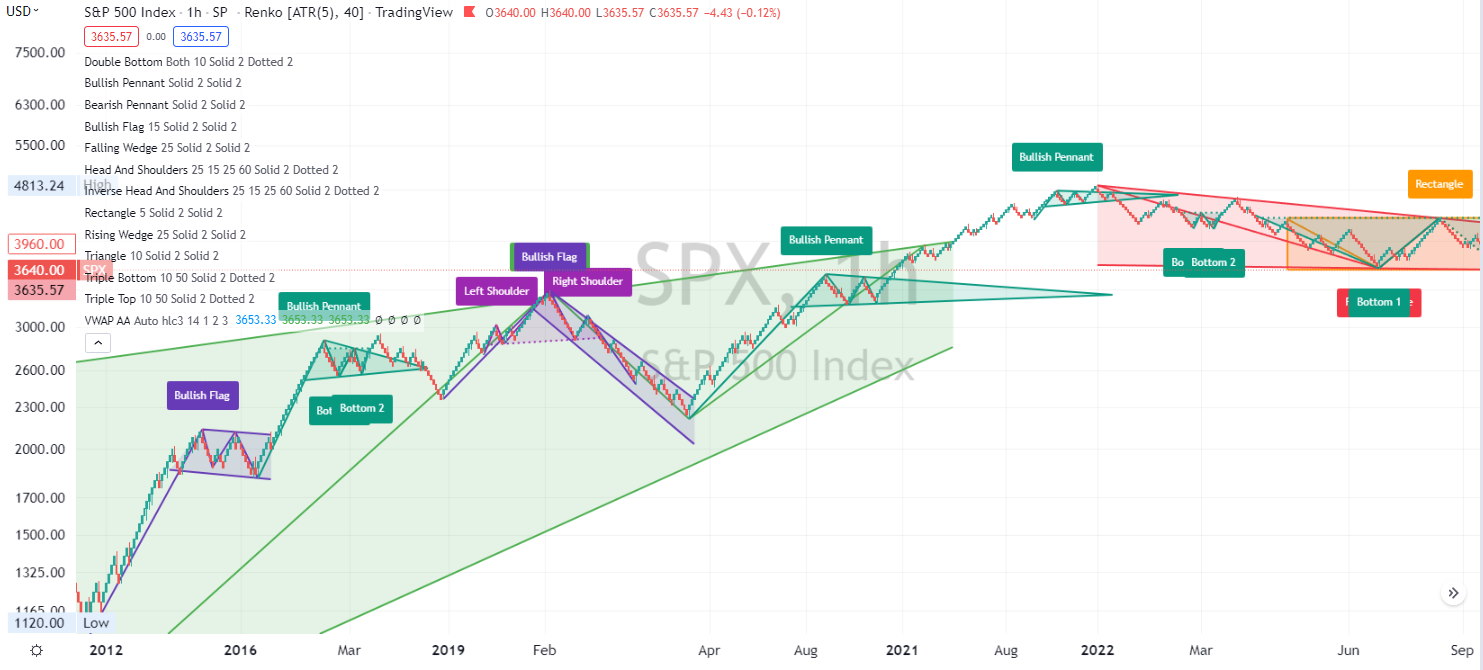
As a result, it is important to use Renko charts in conjunction with other types of charts to get a more complete view of the market.
Pros and cons
Renko charts have a few advantages over traditional candlestick or bar charts. First, they can help to filter out the noise and make it easier to see the underlying trend. Second, they can be used to generate buy and sell signals.
However, there are also a few disadvantages to using Renko charts. One is that they can lag behind the price action, making it difficult to enter trades at the optimal time. Another is that because Renko charts only consider price movement, they do not provide any information about volume or open interest.
Is Renko chart data outdated?
This question has no right answer, as it depends on the individual trader’s opinion. Some traders believe the data on Renko charts can be outdated, as it does not account for volume or open interest.
Others believe the data on Renko charts is more accurate, as it is less affected by outside factors such as news and rumors. As with any trading tool, it is important to experiment with Renko charts to see if they work well for your trading style and market conditions.
What are the best Renko chart settings?
The best settings for Renko charts will vary depending on the individual trader’s preferences and trading strategy. However, some general tips for setting up Renko charts include:
- Determining the box size based on the recent price action
- Using a reasonable range for the box size (e.g., 5-20 points)
- Plotting the first brick at the midpoint of the true range
- Having a clear understanding of how the chart is supposed to be used before making any trading decisions
- Backtesting different settings to see what works best for the individual trader.
Are Renko charts profitable?
There is no easy answer regarding whether or not Renko charts are profitable. As with any other trading tool or strategy, traders must backtest different settings to see what works best.
That being said, there are some potential benefits to using Renko charts. They can help traders filter out the noise and identify the underlying trend more easily. They can also generate buy and sell signals. However, as with any other technical analysis tool, there is no guarantee that these signals will be accurate.
Overall, traders need to research and test before deciding if Renko charts are viable.
Top indicators for Renko charts
Many indicators work with Renko charts, but their overall success rate can only be determined using backtesting. Ideally, our favorite software, TradingView, will enable you to test indicators quickly and plot stock chart patterns automatically.
That being said, some general tips for choosing indicators when using Renko charts can include:
- Choosing indicators that are based on price movement rather than volume
- Using indicators that are simple and easy to understand
- It tests different combinations of indicators to find the ones that work best for the trader’s trading style and strategy.
The next section will use moving averages and MACD with Renko charts.
Using Moving Averages with Renko Charts
Many traders use moving averages when trading with Renko charts. One reason for this is that moving averages can help to smooth out the price action, making it easier to identify the underlying trend. Additionally, they can be used to generate buy and sell signals.
There are several moving averages; traders should experiment with different ones to see which works best. Some popular moving averages to use with Renko charts include:
Using MACD with Renko charts
MACD is a popular technical indicator used to identify buy and sell signals. However, as with any other technical indicator, the signals generated by MACD are not guaranteed to be accurate.
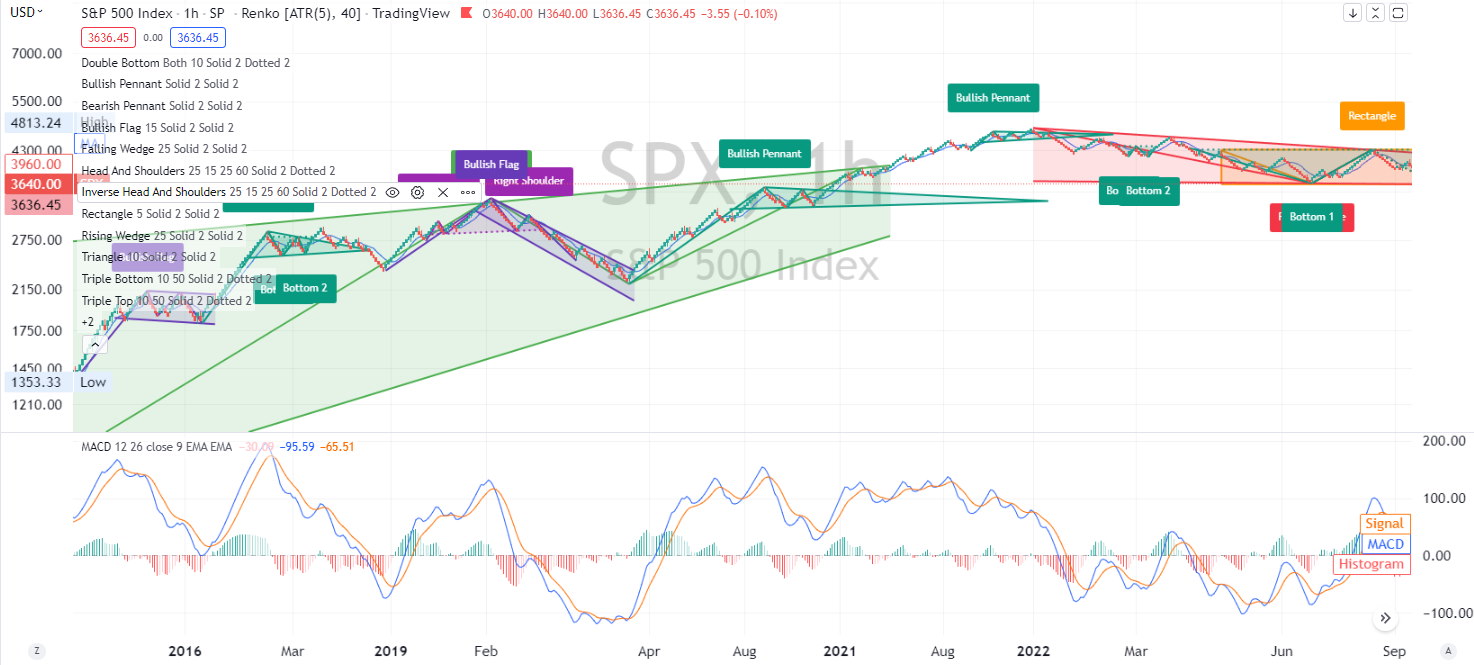
The above chart shows the correlation between MACD and the Renko chart from 2015 to the present.
By using MACD with Renko charts, traders can help reduce the chances of false signals being generated. This is because Renko charts filter out most of the noise in the price action, making it easier to identify the underlying trend. Additionally, MACD is a lagging indicator, meaning that its signals are less affected by news and rumors than other indicators.
By using MACD and Renko charts together, traders can get a more accurate picture of what is happening in the market and make better trading decisions.
What are the best platforms for Renko charts?
This article extensively uses TradingView to provide charts and analysis. TradingView has excellent Renko charts and enables automated stock chart pattern recognition for Renko, Heiken Ashi, and many other chart types. As you will learn, automated pattern recognition is the future of stock chart technical analysis. There are very few other stock trading platforms traders can use for Renko charts.
What are the Renko chart trading strategies?
Traders can use several different trading strategies with Renko charts. Some popular options include trend, breakout, and scalp trading.
Trend trading involves waiting for a clear trend to develop and then taking trades in the direction of the trend. Breakout trading involves looking for price breakouts of key levels and then taking trades in the direction of the breakout. Scalp trading involves taking quick profits by buying and selling at short-term price spikes.
Each strategy has risks and rewards, so traders should always test them on a practice account before using them with real money.
Renko vs. Heiken Ashi
The main difference between Renko charts and Heiken Ashi is that Renko charts always use the same brick size, while Heiken Ashi charts can be set up to use different candle sizes. This can make it easier for traders to identify trends using Heiken Ashi charts.
Renko and Heiken Ashi are two different types of candlestick charts. Renko charts are created by taking the median price of the past X number of candles and creating a new brick when the price changes by a certain amount. Heiken Ashi is created by taking the average price of the past N number of candles and creating a new candle when the average changes by a certain amount.
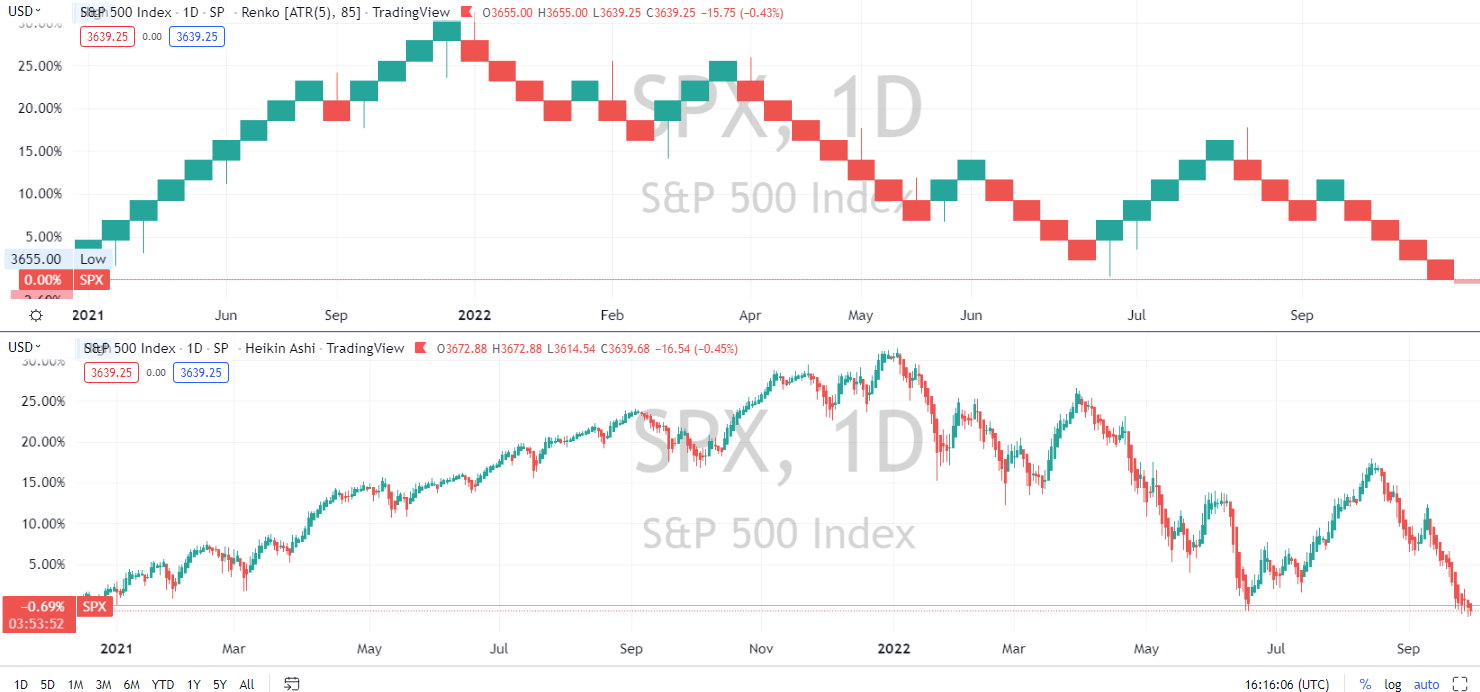
Each type of chart has pros and cons. Renko charts can filter out the noise and easily identify the underlying trend. They can also generate buy and sell signals. However, as with any other technical analysis tool, there is no guarantee that these signals will be accurate.
Renko vs. Point and Figure Charts
Renko charts and Point and Figure charts use different methods to calculate the price. Point and Figure charts are created by drawing boxes and then counting the number of boxes formed to determine the price. Renko charts are created by taking the median price of the past X number of candles and creating a new brick when the price changes by a certain amount.
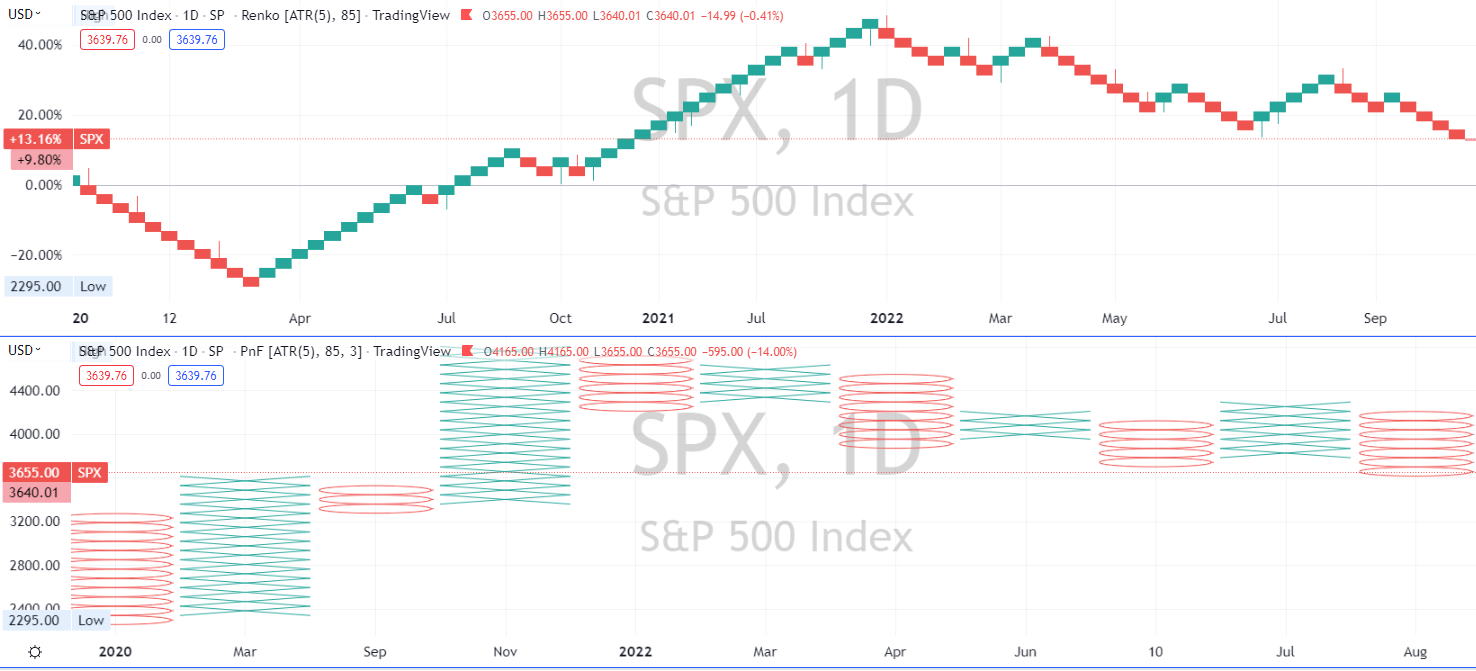
One advantage of Point and Figure charts is that they can identify simple patterns in the price data. This can be helpful for traders who are looking to trade based on patterns. Another advantage is that they are less sensitive to price manipulation and noise than Renko charts.
Another unique and innovative chart type to consider is Raindrop charts by TrendSpider.
FAQ
Are Renko charts good?
Yes, Renko charts are a good way to visualize stock price movements. Renko charts remove much of the noise found in candlestick or OHLC charts. Trends appear much clearer, and it is easier to draw trendlines and estimate pivot points on Renko charts.
How to read Renko charts?
You read a Renko chart from left to right along the x-axis; the Renko bricks/boxes show only price moves beyond a certain dollar amount that you define. You can also select upward boxes to be green and down red, which makes seeing the price trend easier.
What is ATR in Renko charts?
The ATR setting in Renko chart assigns a variable box size to the chart based on the average true range of the stock price movement. ATR in Renko charts means using a dynamic box size based on recent price action. The longer the brick, the biggest the price swings.
Where to get Renko charts?
You can get Renko charts for free using TradingView, an awarding winning stock charting platform. You can open a Renko chart in TradingView and select Charts > Renko. You can then experiment with Renko charts to see if they are right for you.
Can you trade stocks with Renko brick charts?
Yes, you can trade stocks with Renko charts. Renko charts were designed with trading in mind, as they simplify the analysis of stock price direction and identify pivot points much quicker than traditional stock chart types.
Do institutional traders use Renko charts?
Renko charts are widely used by professional institutional traders because they provide a clear view into the trends and price action of assets such as stocks, forex, and even cryptocurrencies.
How to determine a stop loss on Renko charts?
To determine stop losses on Renko charts, one can use a moving average indicator or the most recent plateau in stock price. Try plotting a moving average over the Renko price line; when the Renko price is in an uptrend, use the moving average as your stop loss.
How to gauge momentum on Renko charts?
You can gauge momentum on a Renko chart by using the average true range (ATR) setting. When the vertical length of the ATR box is longer, it indicates an increase in momentum.
How do I trade Renko charts with Fibonacci?
You can trade Renko charts using the Fibonacci indicator as you would with any other chart type. Plot the Fibonacci retracement box from the start of the new price uptrend to the highest trend peak, and you can see where the price touches the Fibonacci retracement lines.
What is the best setting for Renko charts?
There is no single best setting for Renko charts; using the average true range settings, you must tune the ATR length to the asset. If you use the traditional setting, I suggest a box size of 1 to 3 percent of the asset price.
Does TradingView have Renko charts?
Yes, TradingView has an excellent implementation of Renko charts using dynamic ATR or traditional settings. The Renko chart bricks, wicks, and projection bars can be fine tuned and color codes.
Final thoughts
Renko charts are a type of candlestick chart used to track a security’s price. They are created by taking the median price of the past X number of candles and creating a new brick when the price changes by a certain amount.
Renko charts are a popular choice for traders because they easily filter out the noise and identify the underlying trend. They can also generate buy and sell signals.
You want to be a successful stock investor but don't know where to start.
Learning stock market investing on your own can be overwhelming. There's so much information out there, and it's hard to know what's true and what's not.

Liberated Stock Trader Pro Investing Course
Our pro investing classes are the perfect way to learn stock investing. You will learn everything you need to know about financial analysis, charts, stock screening, and portfolio building so you can start building wealth today.
★ 16 Hours of Video Lessons + eBook ★
★ Complete Financial Analysis Lessons ★
★ 6 Proven Investing Strategies ★
★ Professional Grade Stock Chart Analysis Classes ★