Inverse Cup and Handle: 82% Reliability for Short-Sellers
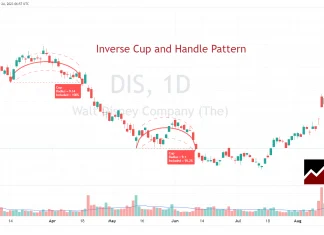
The inverse cup and handle chart pattern is a technical analysis trading strategy. Traders use it to identify a breakdown in asset prices, aiming to profit from short-selling a sharp price decline. The inverse cup and handle chart pattern is considered reliable based on 556+ trades, with an 82% success rate in bull markets.
Linear vs. Logarithmic Charts Explained for Traders
Linear chart scales plot data at regular intervals, making it simple to see changes in data that have small fluctuations. Logarithmic chart scales represent percentage moves.
How To Analyze Stocks with Fundamental & Technical Analysis
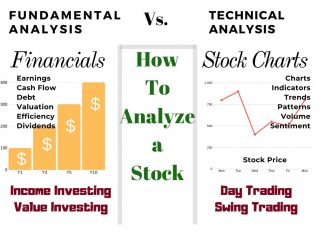
There are two ways to analyze stocks. Fundamental analysis, which evaluates criteria such as PE ratio, earnings, and cash flow. Technical analysis, which involves studying charts, stock prices, volume, and indicators.
Is the S&P 500 200-Day Moving Average Profitable? I Test It!
Our testing of the 200-day MA on the S&P500 over 16 years revealed that using this indicator is a losing proposition. A buy-and-hold strategy made a profit of 192% vs. the 200-day MA, which made only 152%.
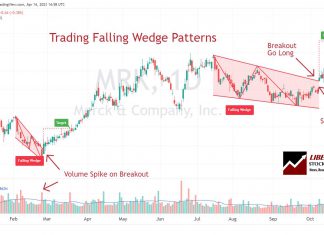
How to Trade a Falling Wedge’s 74% Chance of a 38%...
A falling wedge is a technical analysis pattern with a predictive accuracy of 74%. The pattern can break out up or down but is primarily considered bullish, rising 68% of the time.
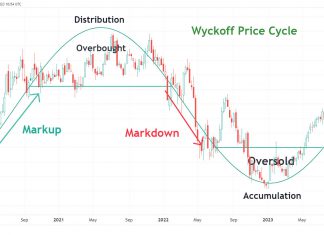
Wyckoff Method Explained: Accumulation & Distribution Trading
The Wyckoff Method is built upon three cardinal laws that govern the financial markets: the Law of Supply and Demand, the Law of Cause and Effect, and the Law of Effort versus Result.
What are Market Profile Charts & Best Software To Use?
A market profile chart is a day-trading tool that displays the price activity to identify a time price opportunity (TPO). It helps traders identify the most traded prices and develop strategies to exploit these areas.
KDJ Indicator Explained: Best Settings & Strategy Tested
The KDJ is a stochastic oscillating technical analysis indicator that helps traders predict price reversals. According to our research, the KDJ has a 63% success rate if configured correctly.
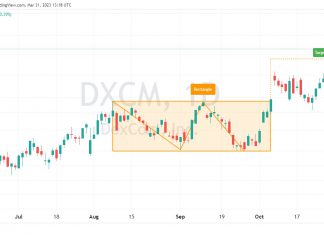
How to Trade a Rectangle Pattern’s 85% Success Rate
A rectangle is a well-established technical analysis pattern with a predictive accuracy of 85%. The pattern is flexible, can break out up or down, and is a continuation or reversal pattern.
Are Bullish Harami Candles Profitable? We Test It?
Our research shows Bullish Harami and Bullish Harami Cross are profitable patterns. Based on 1,112 years of data, the bullish Harami has an average profit per trade of 0.5% and the Harami Cross 0.58%.
How to Read Candlestick Charts Using 5 Reliable Patterns
You can read candlestick charts using pattern recognition software to identify five reliable patterns, the Inverted Hammer, Bearish Marubozu, Gravestone Doji, Bearish Engulfing, and Bullish Harami Cross.
3,735 Bullish Engulfing Candle Trades Test its Reliability
Our research shows the Bullish Engulfing candle is not as bullish as most traders believe. Based on 568 years of data, it has a 55% success rate and an average win of 3.5%.
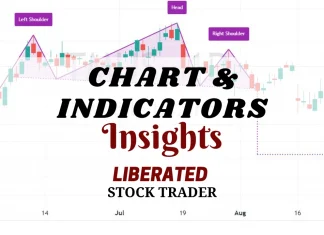
How to Trade the Inverse Head & Shoulders with 89% Accuracy
The inverse head and shoulders pattern is one of the most accurate technical analysis reversal patterns, with a reliability of 89%. It occurs when the price hits new lows on three separate occasions, with two lows forming the shoulders and the central trough forming the head.
Gravestone Doji Explained & Reliability Tested!
A Gravestone Doji candle indicates a battle between buyers and sellers and is considered bearish. Our 1,553 test trades prove it is the third most profitable candle pattern. But it does not work as most traders believe.
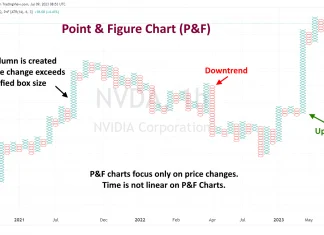
The Best Free Point & Figure Charts & How To Use...
Point and Figure (P&F) charts are a unique form of technical analysis that focuses solely on price action, disregarding time and volume. They utilize 'Xs and 'Os to depict price movements, with 'X' representing an increase and 'O' a decrease.
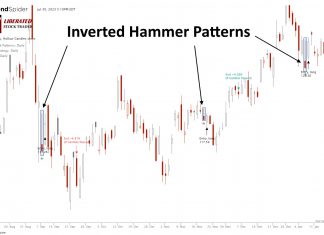
We Test the Inverted Hammer Candle Pattern! Is It Worth It?
Our research shows the Inverted Hammer is the most accurate and profitable candlestick pattern. Used as a bullish signal, it has a 60% success rate and an average win of 4.2%, based on 588 years of data.
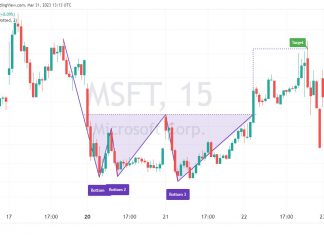
How to Trade a Triple Bottom Pattern’s 87% Success Rate
Decades of trading research show the triple-bottom pattern has an 87% success rate in bull markets and an average profit potential of +45%. The triple bottom chart pattern is popular because it is reliable and accurate and generates a good average profit for traders.
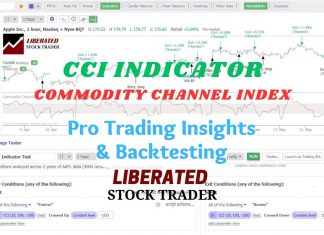
Best Commodity Channel Index (CCI) Settings Tested on 43,297 Trades
Our test data shows that using the CCI indicator with a 50 setting on the S&P 500 index stocks over 20 years was incredibly profitable, returning a 1,108% profit compared to the market, which returned 555%.
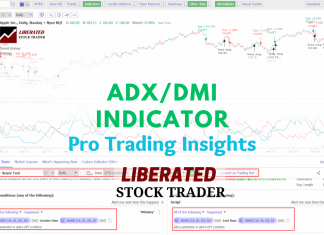
How to Trade the DMI Indicator Profitably: 9,764 Trades Tested
Our testing, based on 9,764 trades over 25 years, proves the DMI indicator is profitable and reliable, outperforming the S&P 500 index.
How to Draw Trendlines on Stock Charts Like a Boss
Drawing trendlines on stock charts is a powerful way to assess the direction of the market. Trendlines help you understand the trend direction and timeframe to set expectations for future market moves.
Our Best Training & Strategies
Liberated Stock Trader Pro: Learn Stock Market Investing
Learn stock market investing with the complete online stock trading course by Barry D. Moore, a certified financial analyst from the International Federation of Technical Analysts (IFTA).
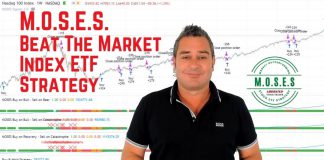
ETF Investing Strategy: MOSES Improves Performance & Lowers Risk
The MOSES ETF investing strategy is a powerful suite of indicators meticulously backtested over 100 years. Designed to empower you to outperform the market, it equips you with the tools to navigate major stock market crashes and unlock greater investing performance.
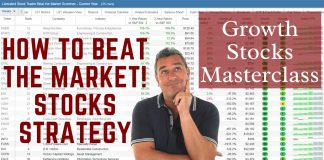
Our LST Strategy Beat the Stock Market’s S&P 500 By 102%...
Decades of research and testing unveiled the Liberated Stock Trader Beat the Market System. Our 9-year, backtested, and proven strategy targets 35 financially healthy high-growth stocks, producing a track record of beating the S&P 500 by 102%.

