Aroon Indicator Explained: Best Settings & Strategy Tested
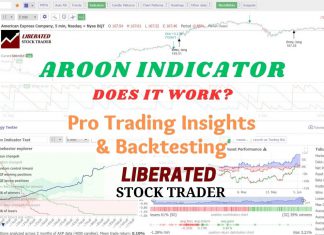
In technical analysis, the Aroon indicator identifies trend reversals and trend strength. This oscillating indicator has two parts: the "Aroon Up" line measures uptrend strength, and the "Aroon Down" line for downtrend strength.
Reading & Trading Volume Profile Indicators Like a Pro
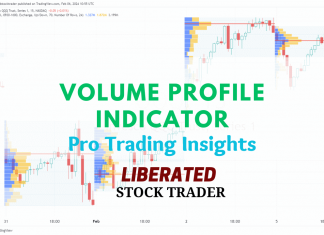
Volume profile technical analysis indicators provide a uniquely detailed overview of volume distribution across price levels, offering traders insights into market structure and supply and demand zones.
OBV Indicator: Best Settings & Trading Strategy Explained
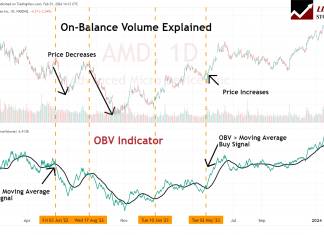
On-balance volume (OBV) is a cumulative indicator in technical analysis designed to show the volume flow relative to a security's price movements. The OBV reflects the collective buying and selling pressure crystallized through the volume trend.
How to Trade a Double Bottom Pattern’s 88% Success Rate
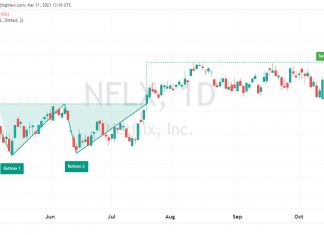
Decades of research reveal the double bottom pattern has an 88% success rate in bull markets and an average profit potential of +50%. The double-bottom chart pattern is one of the most reliable and accurate chart indicators in technical analysis.
RSI Indicator Explained: Best Settings & Strategy Tested
The Relative Strength Index (RSI) is an oscillating momentum indicator that measures the speed and change of stock price movements. RSI uses a scale from 0 to 100 to indicate overbought or oversold conditions.
7 Parabolic SAR Trading Strategies Tested by LiberatedStockTrader
The Parabolic Stop and Reverse (PSAR) technical indicator identifies asset price reversals. Relying on parabolic time/price systems it creates effective trailing stop-losses for trading signals.
Elliott Wave Theory: Usage, Rules & Reliability Tested
Elliott Wave Theory is a scientifically unproven technical analysis indicator used to attempt to predict price movements in financial markets. I highly recommend avoiding this indicator.
5 Moving Average Indicators Tested on 43,770 Trades
The best moving average settings are SMA or EMA 20 on a daily chart, which achieves a 23% win rate. At settings 50, 100, and 200, it is better to use the Hull moving average, which has win rates of 27%, 10%, and 17%, respectively.
How to Read Candlestick Charts Using 5 Reliable Patterns
You can read candlestick charts using pattern recognition software to identify five reliable patterns, the Inverted Hammer, Bearish Marubozu, Gravestone Doji, Bearish Engulfing, and Bullish Harami Cross.
12 Ways to Master Stock Chart Indicators by a Certified Analyst
Professional market analysts build trading strategies using chart indicator techniques like divergences, multi-time frame analysis, indicator combinations, and rigorous backtesting.
Bearish Engulfing Candles Explained & Reliability Tested
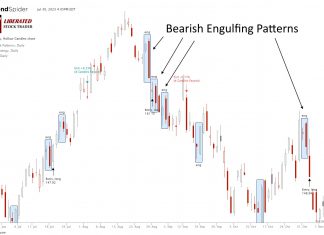
Our research shows the Bearish Engulfing candle is an accurate and profitable pattern. Our 568 years of data reveals a 57% success rate and an average win of 3.7%.
Tick Charts: Settings, Strategies & Examples Explained
Tick charts are uniquely constructed by plotting price movement after a certain number of transactions occur. Unlike traditional time-based OHLC or candlestick charts representing price action over a set period, tick charts update after a predefined trading volume is reached.
Our Best Training & Strategies
Liberated Stock Trader Pro: Learn Stock Market Investing
Learn stock market investing with the complete online stock trading course by Barry D. Moore, a certified financial analyst from the International Federation of Technical Analysts (IFTA).
ETF Investing Strategy: MOSES Improves Performance & Lowers Risk
The MOSES ETF investing strategy is a powerful suite of indicators meticulously backtested over 100 years. Designed to empower you to outperform the market, it equips you with the tools to navigate major stock market crashes and unlock greater investing performance.
Our LST Strategy Beat the Stock Market’s S&P 500 By 102%...
Decades of research and testing unveiled the Liberated Stock Trader Beat the Market System. Our 9-year, backtested, and proven strategy targets 35 financially healthy high-growth stocks, producing a track record of beating the S&P 500 by 102%.

