10 Bullish Chart Patterns Proven Effective & Profitable
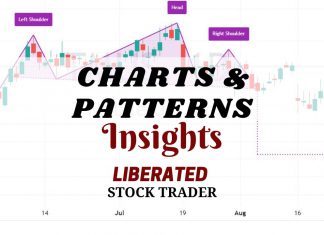
Research shows the most reliable and accurate bullish patterns are the Cup and Handle, with a 95% bullish success rate, Head & Shoulders (89%), Double Bottom (88%), and Triple Bottom (87%). The most profitable chart pattern is the Bullish Rectangle Top, with a 51% average profit.
We Test the Inverted Hammer Candle Pattern! Is It Worth It?
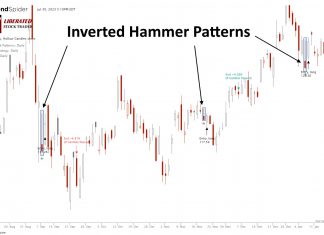
Our research shows the Inverted Hammer is the most accurate and profitable candlestick pattern. Used as a bullish signal, it has a 60% success rate and an average win of 4.2%, based on 588 years of data.
10 Best Free TradingView Indicators & How to Trade Them!
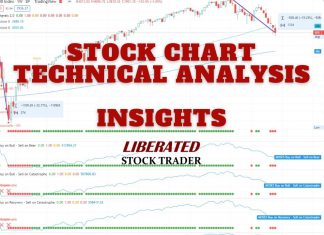
Our testing shows the best TradingView indicators for advanced analysis are Volume Profile HD, VWAP, Supertrend, ATR, Relative Volatility, and RSI. TradingView's candlestick and chart pattern recognition also improve trading outcomes.
Price Action Trading: Mastering Day & Swing Trading Strategy
Price action trading is a method of day trading that relies on technical analysis but ignores conventional fundamental indicators, focusing instead on the movement of prices.
How to Trade a Triple Bottom Pattern’s 87% Success Rate
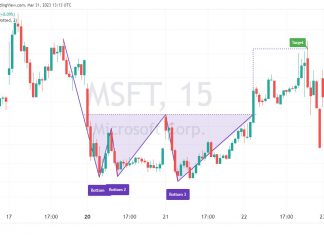
Decades of trading research show the triple-bottom pattern has an 87% success rate in bull markets and an average profit potential of +45%. The triple bottom chart pattern is popular because it is reliable and accurate and generates a good average profit for traders.
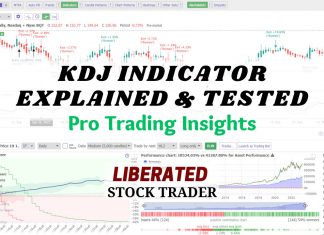
KDJ Indicator Explained: Best Settings & Strategy Tested
The KDJ is a stochastic oscillating technical analysis indicator that helps traders predict price reversals. According to our research, the KDJ has a 63% success rate if configured correctly.
Bear Flag Pattern: Reliability & Success Rate Based On Data
Be careful when trading bearish flags. According to published research, the bear flag pattern has a low success rate of 45%. This means you are flipping a coin when trading this pattern, as the odds are not in your favor. The high-tight bear flag is the only flag pattern you should trade.
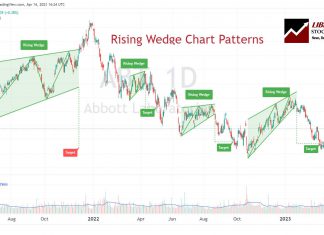
How to Trade the Rising Wedge Pattern’s 81% Success Rate
According to multi-year testing, the rising wedge pattern has a solid 81% success rate in bull markets with an average potential profit of +38%. The ascending wedge is a reliable, accurate pattern, and if used correctly, gives you an edge in trading.
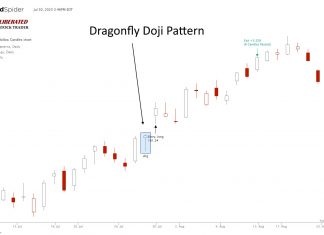
Dragonfly Doji Explained: Is it Reliable? I Test It!
The Dragonfly Doji is a candlestick chart pattern that indicates an equilibrium between buyers and sellers after a day of trading volatility. Our 1,703 test trades prove it can be profitable under the right circumstances, but the margins are thin.
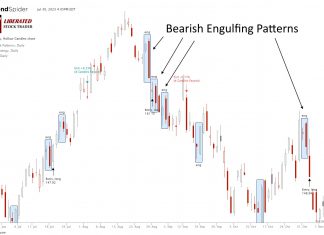
Bearish Engulfing Candles Explained & Reliability Tested
Our research shows the Bearish Engulfing candle is an accurate and profitable pattern. Our 568 years of data reveals a 57% success rate and an average win of 3.7%.
MACD Strategy & Reliability Tested by LiberatedStockTrader
MACD is a trend-following momentum indicator used to identify price trends. We conducted 606,422 test trades to find the best settings and trading strategies.
Reading & Trading Volume Profile Indicators Like a Pro
Volume profile technical analysis indicators provide a uniquely detailed overview of volume distribution across price levels, offering traders insights into market structure and supply and demand zones.
ADX Indicator Best Settings & Trading Strategy Tested
According to our in-depth testing, an ADX(DMI + 14) setting crossing above 20 is a profitable buy signal, and crossing below 20 is a reliable sell signal. These settings resulted in an ADX 28% outperformance versus the S&P 500 stocks.
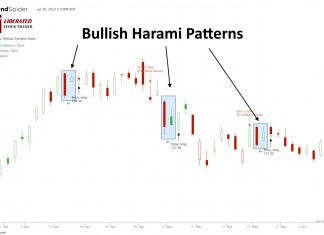
Are Bullish Harami Candles Profitable? We Test It?
Our research shows Bullish Harami and Bullish Harami Cross are profitable patterns. Based on 1,112 years of data, the bullish Harami has an average profit per trade of 0.5% and the Harami Cross 0.58%.
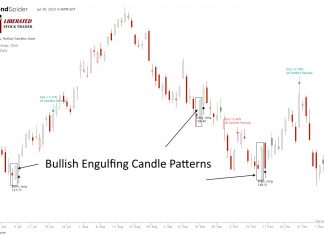
3,735 Bullish Engulfing Candle Trades Test its Reliability
Our research shows the Bullish Engulfing candle is not as bullish as most traders believe. Based on 568 years of data, it has a 55% success rate and an average win of 3.5%.
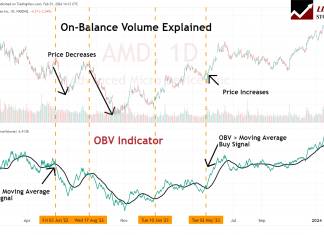
OBV Indicator: Best Settings & Trading Strategy Explained
On-balance volume (OBV) is a cumulative indicator in technical analysis designed to show the volume flow relative to a security's price movements. The OBV reflects the collective buying and selling pressure crystallized through the volume trend.
Advance/Decline (A/D) Line Explained by a Certified Analyst
The advance/decline (A/D) line indicator measures market breadth by identifying how many stocks participate in a market advance or decline. It is calculated by taking the number of advancing stocks minus the declining stocks.
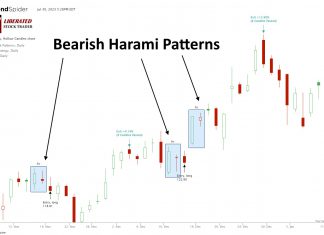
Bearish Harami Pattern: 5,624 Trades Tested for Reliability!
Our research shows Bearish Harami and Bearish Harami Cross are profitable patterns. Based on 1,136 years of data, the Bullish Harami has an average profit per trade of 0.48% and the Harami Cross 0.57%.
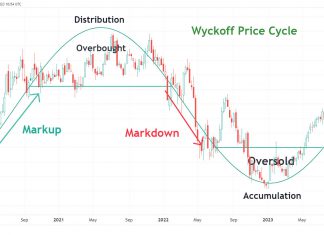
Wyckoff Method Explained: Accumulation & Distribution Trading
The Wyckoff Method is built upon three cardinal laws that govern the financial markets: the Law of Supply and Demand, the Law of Cause and Effect, and the Law of Effort versus Result.
Is the S&P 500 200-Day Moving Average Profitable? I Test It!
Our testing of the 200-day MA on the S&P500 over 16 years revealed that using this indicator is a losing proposition. A buy-and-hold strategy made a profit of 192% vs. the 200-day MA, which made only 152%.
Our Best Training & Strategies
Liberated Stock Trader Pro: Learn Stock Market Investing
Learn stock market investing with the complete online stock trading course by Barry D. Moore, a certified financial analyst from the International Federation of Technical Analysts (IFTA).
ETF Investing Strategy: MOSES Improves Performance & Lowers Risk
The MOSES ETF investing strategy is a powerful suite of indicators meticulously backtested over 100 years. Designed to empower you to outperform the market, it equips you with the tools to navigate major stock market crashes and unlock greater investing performance.
Our LST Strategy Beat the Stock Market’s S&P 500 By 102%...
Decades of research and testing unveiled the Liberated Stock Trader Beat the Market System. Our 9-year, backtested, and proven strategy targets 35 financially healthy high-growth stocks, producing a track record of beating the S&P 500 by 102%.

