You’re here to figure out what the stock market actually is and how it really works.
The stock market lets companies sell ownership shares, and investors like you buy and trade those shares to (hopefully) build wealth over time. It’s a meeting point: businesses want cash to grow, while you want your money to do more than just sit there.
You’ll see how stocks work as small pieces of real companies, why prices jump around (it’s not just random), and how all this connects to your financial goals.
You’ll also get practical tips to start investing safely, dodge classic mistakes, and use tools like Stock Rover to dig into companies before you risk your cash.
Key Takeaways
- Get a clear, no-jargon look at what the stock market is and how it ticks.
- Learn how to size up companies and invest with some actual confidence.
- Pick up steps and tools to start building your own investment plan.
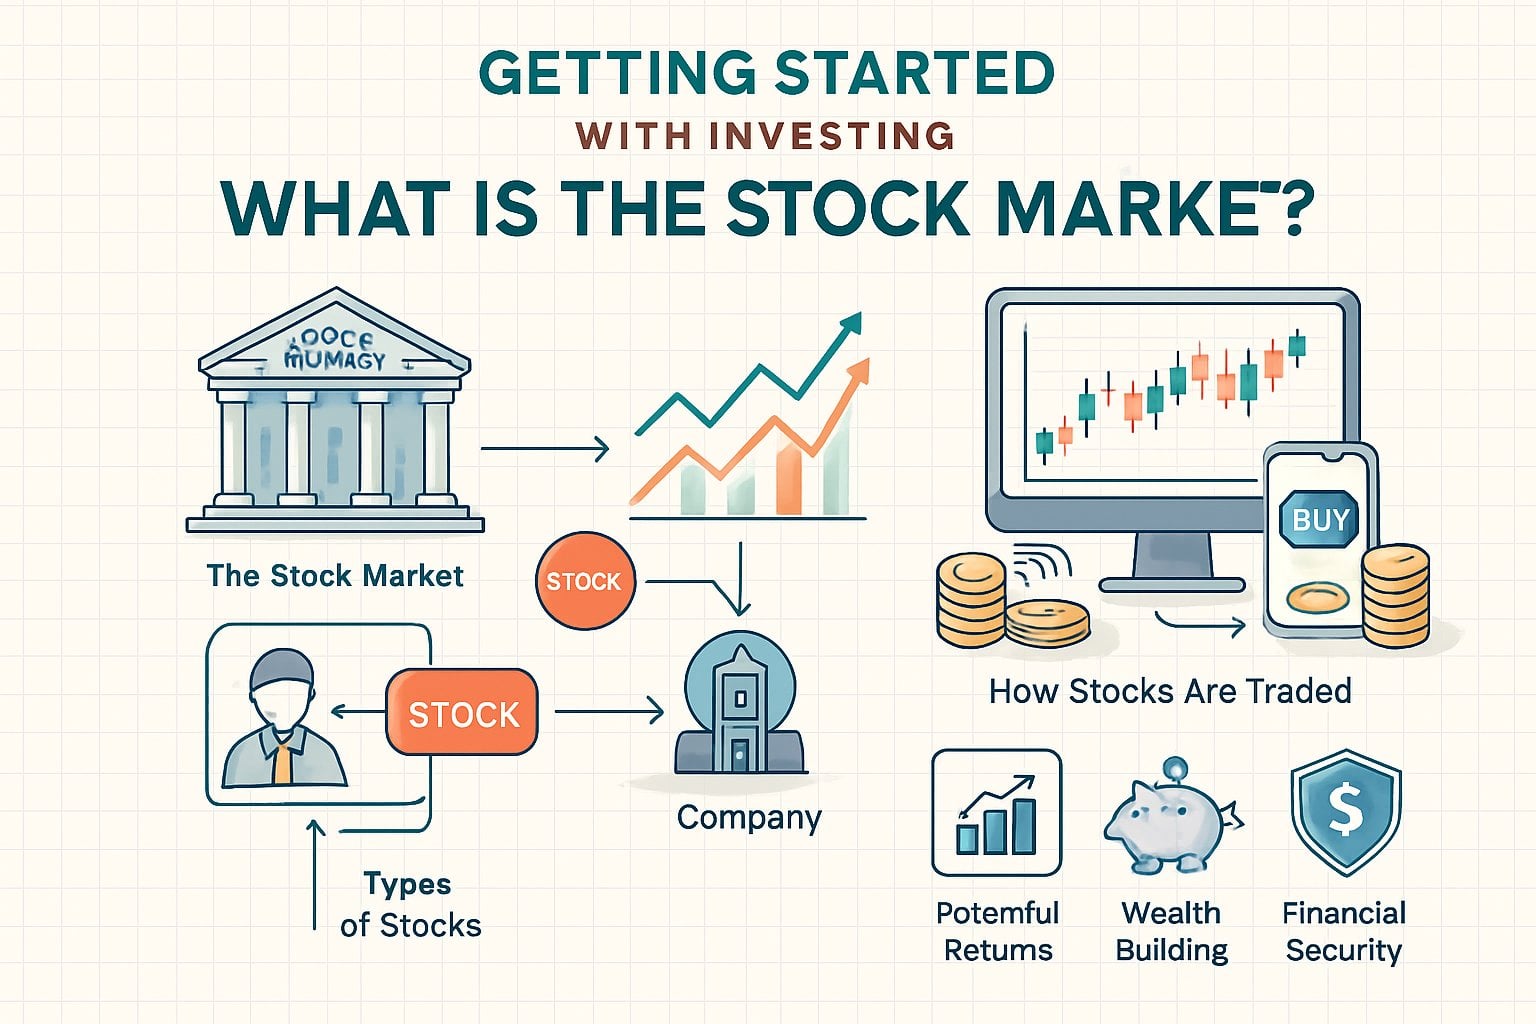
What Is the Stock Market?
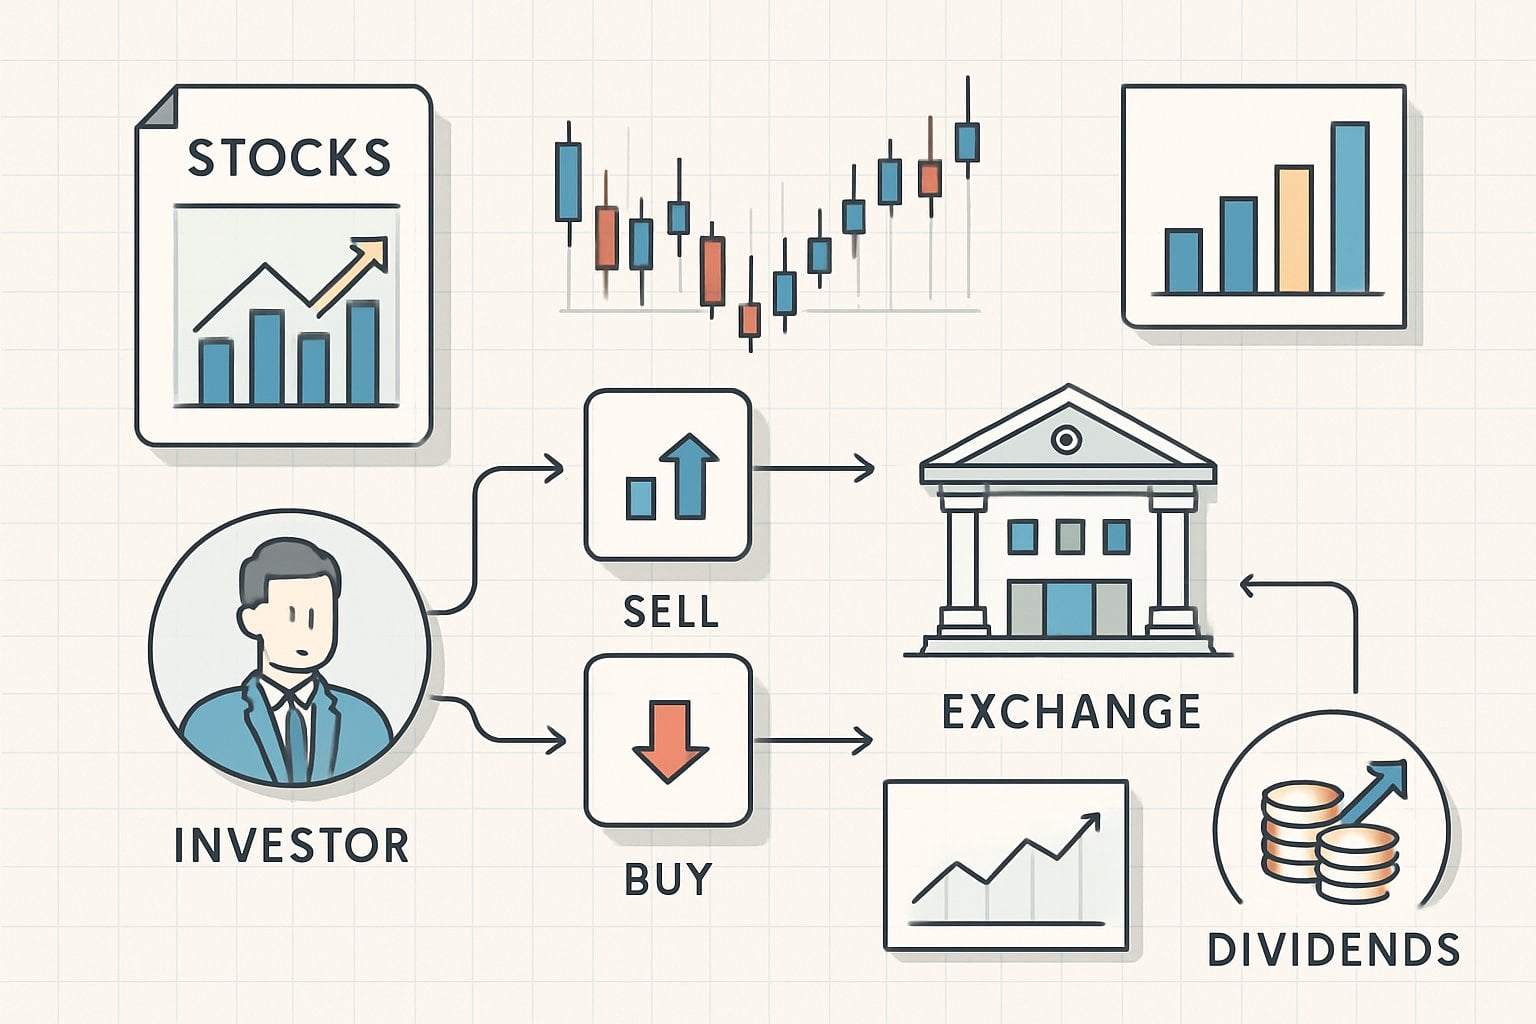
The stock market connects people who want to buy pieces of companies with those who want to sell. It’s a transparent system for trading, price-setting, and raising money for businesses, while giving regular folks access to potential gains through equity ownership.
How Stock Markets Work
A stock market acts as a regulated marketplace where buyers and sellers trade shares of public companies.
Trades happen through stock exchanges or digital platforms that match buy and sell orders instantly.
Prices shift because of supply and demand. If more people want a stock than are willing to sell, the price goes up. If sellers outnumber buyers, prices drop.
You’ll see market data like bid, ask, and last price—these help you track what’s happening and decide when to act.
Most markets use market makers or automated systems to keep things liquid, so you can buy or sell without wild price swings.
Order types—market, limit, stop—change how your trades get filled and at what price.
You can use platforms like TradingView to watch global prices, chart trends, and get real-time updates before you hit “buy” or “sell” in your brokerage account.
Types of Securities Traded
The stock market lists several types of securities, each with its own purpose. Here’s a quick breakdown:
| Security Type | Description | Typical Use |
|---|---|---|
| Stocks | Ownership shares in a company | Long-term growth or dividends |
| Bonds | Debt issued by governments or corporations | Income and capital preservation |
| ETFs | Funds tracking indexes or sectors | Diversification and liquidity |
| Mutual Funds | Professionally managed portfolios | Hands-off investing |
| Options | Contracts giving buy/sell rights | Hedging or speculation |
Stocks and ETFs trade all day, but mutual funds settle just once after the market closes.
You can research and screen these using Stock Rover—look at metrics like P/E ratio, revenue growth, or dividend yield to make comparisons.
Major Stock Exchanges
The biggest U.S. exchanges—New York Stock Exchange (NYSE) and Nasdaq—handle most equity trading. NYSE lists a lot of established names, while Nasdaq leans tech and growth.
Globally, you’ve got the London Stock Exchange (LSE), Tokyo Stock Exchange (TSE), and Hong Kong Stock Exchange (HKEX).
Each has its own rules and trading hours, but all aim for efficient, transparent trades.
Exchanges enforce strict disclosure and compliance rules to protect you as an investor.
They also stream out market data feeds—quotes, volumes, index moves. With tools like MetaStock or Benzinga Pro, you can track these live, spot trends, and react fast to breaking news.
Understanding Stocks and Shares
You get ownership in a company by buying stocks, might earn income through dividends, and figure out value by watching stock prices.
Understanding how these fit together helps you make smarter investment calls—and avoid rookie errors.
What Are Stocks and Shares?
A stock is just a slice of ownership in a company. When you buy a share, you own a chunk of that business’s equity.
How many shares you have decides your claim on profits and your voting power at annual meetings.
Companies issue stocks to raise cash for growth, research, or paying off debt.
Investors buy these shares on exchanges like the NYSE or NASDAQ.
Public listings make it easy to trade, but prices swing all the time based on demand, company news, and the wider market mood.
Stocks generally come in two flavors:
| Type | Description |
|---|---|
| Common stock | You get voting rights and maybe dividends. |
| Preferred stock | Pays fixed dividends, but usually no voting rights. |
You can compare companies by metrics like earnings per share (EPS) and return on equity (ROE) using tools like Stock Rover. That makes it easier to spot financially solid businesses before you buy.
Dividends Explained
A dividend is a slice of company profit sent out to shareholders.
Not every company pays them—some reinvest profits to grow instead.
Stable, mature firms (think utilities or consumer staples) often pay reliable dividends.
Dividends usually come quarterly and get quoted as a dividend yield, which you figure out like this:
Dividend Yield = (Annual Dividend per Share ÷ Share Price) × 100
Say a stock pays $2 per year and trades at $50. That’s a 4% yield.
Watch out: high yields can mean a bargain, but sometimes they’re a red flag for trouble if the payout isn’t sustainable.
You can check dividend histories and payout ratios with tools like Seeking Alpha, which pulls together company reports and analyst forecasts.
Reliable dividend payers give steady income, but sometimes reinvesting elsewhere boosts your long-term returns more.
Stock Prices and Valuation
A stock price is just what buyers and sellers agree on at any moment.
Prices jump around with earnings news, economic data, and market sentiment.
But price alone doesn’t tell you much. You need to stack it up against financial metrics.
Some common valuation ratios:
- Price-to-Earnings (P/E) = Share Price ÷ Earnings per Share
- Price-to-Book (P/B) = Share Price ÷ Book Value per Share
- Dividend Yield = Annual Dividend ÷ Share Price
Low ratios might mean a bargain—or a risk. High ratios usually mean investors expect big growth.
You can chart price trends and find entry points with TrendSpider—handy for technical analysis and automated charting.
Mix valuation data with price action to decide if a stock looks fairly priced or if it’s better to hold off.
Getting Started With Investing
You start investing by picking a trustworthy online broker, opening an investment account, and setting clear financial goals.
Each step helps you manage risk and make choices that actually fit your long-term plans.
Choosing an Online Broker
An online broker is your ticket into the stock market. They handle your trades and offer research, account tools, and customer support.
Look at fees, account types, trading tools, and regulation before you choose.
Some brokers are commission-free, others charge per trade, and a few work on spreads or subscriptions.
Always check for SIPC insurance in the U.S. (or your local equivalent).
Pick a broker that matches your style. Stock Rover is great for long-term investors who want deep data and screening.
If you’re more into day trading, you’ll want a platform with fast execution and real-time quotes.
Test drive the demo mode if you can. Make sure the broker supports all the markets and assets you want—stocks, ETFs, mutual funds, whatever your thing is.
Opening an Investment Account
After picking a broker, you’ll open an investment account (usually called a brokerage account).
This is where your cash and stocks live, and where you’ll place trades.
You can open a taxable account or a tax-advantaged account like an IRA, depending on your goals.
You’ll need to provide ID, income info, and pick your funding method.
Most brokers let you deposit by bank transfer or wire. Minimums vary—a lot start at $0, but some want a few hundred bucks.
Use your broker’s dashboard to track holdings, dividends, and trades.
Most have mobile apps for quick checks. If you’re into international stocks or crypto, tools like TradingView can help once your account is live.
Keep your login details safe and turn on two-factor authentication. Check your statements every month to verify trades and track performance.
Setting Investment Goals and Risk Tolerance
Figure out your investment goals before you buy anything.
Are you building long-term wealth, saving for retirement, or looking for short-term gains? Each goal needs a different asset mix and risk level.
Think about your risk tolerance—your age, income stability, and time horizon all matter.
Younger investors can usually handle more ups and downs, while those closer to retirement often want to play it safer.
Here’s a quick guide:
| Risk Level | Typical Allocation | Time Horizon |
|---|---|---|
| Conservative | 70% bonds / 30% stocks | 3–5 years |
| Moderate | 50% stocks / 50% bonds | 5–10 years |
| Aggressive | 80% stocks / 20% bonds | 10+ years |
Check your goals every year or after big life changes. Shift your allocations if your priorities change.
Tools like TrendSpider can help you spot technical trends and rebalance your portfolio with real data.
Core Investment Strategies
You grow wealth in the stock market by using structured strategies that balance growth with risk.
It’s all about how you spread your money, manage exposure, and stick to your plan through market ups and downs.
Long-Term Investing
Long-term investing means holding quality stocks for years, not flipping them every week.
You count on business fundamentals—earnings growth, cash flow, market position—to drive returns over time.
This approach helps you ignore short-term noise and cuts down on trading fees.
A typical long-term investor reinvests dividends and lets gains compound over time.
You can track your progress with tools like Stock Rover, which screens for companies with steady revenue and strong balance sheets.
Patience is key. Market drops might sting, but historically, diversified stock markets bounce back and grow over the long haul.
You set a time frame and only rebalance your portfolio if allocations drift way off target.
Diversification Basics
Diversification spreads your risk across asset classes, sectors, and regions. Instead of betting everything on one stock or industry, you hold a mix—maybe some tech, a bit of healthcare, a few consumer goods—to help smooth out your returns.
| Asset Type | Example Allocation | Purpose |
|---|---|---|
| Domestic Stocks | 50% | Core growth exposure |
| International Stocks | 20% | Currency and regional balance |
| Bonds | 20% | Income and stability |
| Cash or Alternatives | 10% | Liquidity and flexibility |
When you mix assets, one bad performer won’t tank your whole portfolio. You can also use exchange-traded funds (ETFs) or index funds for broad market exposure without having to pick every stock yourself.
Try tools like TradingView to compare how different markets are doing and tweak your mix if you see changes coming. Diversification doesn’t eliminate risk, but over the years, it usually helps you avoid wild swings.
Risk Management in Stock Investing
Risk management means protecting your money from big losses. You’ll want to figure out how much of a drawdown you can handle and set limits on how much you put into each stock.
A few common ways to manage risk:
- Stop-loss orders to cap how much you can lose on a trade.
- Position sizing so you don’t get stuck with too much in one company.
- Regular portfolio reviews to make sure you’re still on track with your goals.
You can use TrendSpider to automate chart analysis and spot entry and exit points without letting emotions get in the way.
Look at both market-wide risk (systematic) and company-specific risk (unsystematic). If you stick to clear rules and keep an eye on your positions, you’re more likely to avoid big setbacks and stay in the game for the long haul.
Analyzing Stocks: Fundamentals and Technicals
You’ve got two main ways to analyze stocks: dig into the business itself, or just watch how the price moves. Both approaches rely on real data—financial numbers or price charts—to help you figure out when to buy, hold, or sell.
Each method uses its own tools and looks at different timeframes and signals.
Fundamental Analysis Overview
Fundamental analysis tries to figure out a company’s intrinsic value by looking at financial data and its spot in the market. You’ll review reports like the income statement, balance sheet, and cash flow statement to see how profitable the business is, how much debt it carries, and whether it’s growing.
You’ll probably compare numbers like earnings per share (EPS), price-to-earnings (P/E) ratio, and return on equity (ROE). These ratios show you how well the company turns revenue into profit and how investors value that performance.
Industry trends, interest rates, and the overall economy can also impact what a business is worth. If you want to filter for revenue growth, profit margins, or valuation multiples, Stock Rover lets you screen and compare companies quickly.
With this data, you can spot stocks that look undervalued or overpriced. The goal here is to invest where the numbers suggest solid, long-term potential, not just a quick price jump.
Technical Analysis Tools
Technical analysis zeroes in on price action and trading volume instead of digging into company reports. You’ll read charts and try to spot patterns that might hint at where prices are headed.
You’ll see candlestick, bar, and line charts everywhere. Analysts use support and resistance levels to guess where buyers or sellers might step in.
Popular tools include trendlines, moving averages, and momentum oscillators. These help you figure out if a stock is trending or just moving sideways.
Platforms like TrendSpider can automate a lot of this, letting you backtest ideas and set alerts for certain setups. Technical analysis tends to work best for short-term traders who act on signals, not predictions.
Popular Indicators: RSI and Moving Averages
The Relative Strength Index (RSI) tracks momentum on a scale from 0 to 100. If RSI is above 70, the stock might be overbought; under 30, it could be oversold. RSI makes it easier to spot when momentum is fading and time your trades.
Moving averages (MA) smooth out price data to show you the trend. A simple moving average (SMA) gives equal weight to each time period, while an exponential moving average (EMA) reacts more quickly to recent prices.
Traders often watch for crossovers—like the 50-day moving above the 200-day—as possible trend changes. If you combine RSI and moving averages, you can filter out some false signals.
Charting platforms like TradingView let you plot these indicators and set up custom alerts with live market data.
Trading, Taxes, and Next Steps
When you trade, you’re putting real money at risk. Knowing how trades work, which products you can use, and how taxes affect your returns all matter if you want to keep more of what you make.
Basics of Financial Trading
Financial trading means buying and selling stocks, bonds, ETFs, or commodities through a broker or exchange. You make money from price changes or dividends, but every trade involves risk.
Start by opening a brokerage account that fits your needs—discount brokers if you want lower fees, or full-service ones if you want more research and help. You’ll need to pick your order type:
- Market orders fill right away at the best price.
- Limit orders only fill at your chosen price.
- Stop-loss orders help you cut losses if a trade goes south.
Before you trade, use a screener like Stock Rover to check company fundamentals, growth rates, and valuation ratios. Consistent, data-driven decisions usually beat chasing every market move.
Keep a record of each trade—date, price, and fees. It’ll make tracking your results (and tax time) a lot easier.
Day Trading and Derivatives
Day trading means you open and close positions within the same day, aiming to catch small price swings. It’s fast-paced, requires constant attention, and you really can’t skip risk controls.
In the U.S., you’ll need at least $25,000 in your margin account to qualify as a pattern day trader under FINRA rules. Tools like Trade Ideas or TrendSpider help with real-time scans, charting, and setting up automated alerts.
Derivatives—like options, futures, and contracts for difference (CFDs)—get their value from something else, such as a stock or commodity. They can boost gains or hedge risk, but losses can snowball just as quickly.
If you’re new to derivatives, learn the margin rules and expiration dates first. Try out a demo or paper trading account on TradingView before risking cash. Always check liquidity and volatility so you don’t get stuck with bad fills or surprise costs.
Understanding Investment Taxes
You’ll owe taxes on your trading profits. Capital gains tax applies when you sell an asset for more than you paid.
- Short-term gains (held less than a year) get taxed at your regular income rate.
- Long-term gains (over a year) usually get a lower tax rate.
Track the cost basis and holding period for every trade. Most brokers can generate Form 8949 or similar summaries to help you file taxes.
Dividends and interest count as taxable income, too. Some investments, like municipal bonds or certain retirement accounts, can offer tax breaks.
Set aside money for taxes and consider loss harvesting to offset gains. If you’re trading a lot or using complex products like options, it’s smart to talk to a tax pro.
Lesson Review Questions
How does the stock market work for beginners?
The stock market connects people who want to buy and sell shares of companies. When you buy a stock, you own a tiny piece of that business. Prices move because of supply, demand, and what’s happening at the company.
What are the essential steps to start investing in the stock market?
Open a brokerage account, fund it, and set specific financial goals. Decide how much you’re willing to invest on a regular basis and what risk level you’re comfortable with.
Which types of stocks are suitable for beginners with limited funds?
Exchange-traded funds (ETFs) and fractional shares let you start with small amounts. ETFs follow indexes like the S&P 500, so you get a slice of lots of companies at once.
If you prefer picking stocks, look for established companies with steady earnings and reliable dividends. Tools like Seeking Alpha help you check analyst opinions and dividend records.
What are key strategies for making money in the stock market as a beginner?
Start with a long-term plan—seriously, it’s tough to time the market if you’re just starting out. Try reinvesting dividends instead of pocketing them, since that can boost your returns over time.
Consider dollar-cost averaging. You buy shares on a regular schedule, which can help smooth out those wild price swings that make new investors nervous.
Get familiar with a few straightforward technical patterns and price trends. If you’re not a chart expert, tools like TrendSpider can automate a lot of the process and highlight possible entry and exit points for you.
Every few months, take a hard look at your portfolio. Adjust your holdings if you see something’s not working, or if your goals shift.
Didn’t know the ex div time frame good info
all important dividend information in easy to understand format