Stock markets do not move in a straight line. They surge higher in exciting booms and then, at times, fall sharply in painful crashes. If you want to invest with confidence, you need to understand this rhythm rather than fear every headline.
In this lesson, you will learn what a stock market boom and crash are, why they happen, how long crashes typically last, and what all of this means for your long-term investing plan. By the end, you should see market turbulence as normal, not as a reason to abandon your goals.
Why Every Investor Must Understand Booms & Crashes
Look at any long-term chart of a major stock index, and you will see the same story: over decades, markets trend higher, but the path is full of powerful rallies and deep drawdowns. Since 1929, there have been at least six major US stock market crashes with average peak losses of around 57% and an average recovery time close to 10 years. Over the last 20 years, the average recovery time has fallen to about 7 years, but crashes have remained severe, with average losses of over 60%.
If you only focus on the boom phase, you may invest too aggressively at the top. If you only focus on crashes, you may panic and sell at the bottom. Understanding the full cycle helps you set realistic expectations and build a plan you can stick to, even when markets feel extreme.
This lesson connects to your work in earlier sections on what type of investor you are and your investment goals. Booms and crashes are the environment in which your goals must survive.
Read our Stock Market Crash article for an in-depth understanding of booms and busts.
What Is a Stock Market Boom?
A stock market boom is a period when stock prices rise rapidly and broadly. It is more than a normal bull market; it is a phase where optimism is very strong, valuations stretch, and money flows into the market at speed.
Typical signs of a boom include:
- Indexes are hitting new highs again and again.
- Strong economic data and company earnings support higher prices.
- Valuations (like price-to-earnings ratios) are moving well above long-term averages.
- Growing “fear of missing out” (FOMO) among investors.
- Media headlines celebrate “hot” sectors and quick gains.
Boons can create real wealth. The long rally leading into the 2000 dot-com peak and the 2003-2007 bull market ahead of the financial crisis are examples of powerful booms that generated large gains before they ended. However, every boom plants the seeds for the next correction or crash as prices move too far ahead of underlying value.
Video: Stock Market Booms, Crashes & Crisis
What Is a Stock Market Crash?
A stock market crash is a sudden, sharp fall in stock prices across the market. It is usually faster and deeper than a normal correction and is often driven by fear and forced selling.
While there is no single strict definition, investors often call it a crash when:
- Major indexes fall 20–30% or more in a relatively short period.
- Volatility surges and daily moves of 5–10% up or down become common.
- News flow focuses on crisis, recession, or systemic risk.
- Investors rush to sell, often regardless of underlying company fundamentals.
Crashes are emotionally intense because they threaten savings and retirement plans. Yet historically, every major crash has eventually been followed by recovery and new highs. The key question is not “Will markets crash?” but “How will I behave when they do?”
For a deeper dive into how crashes form and how professionals analyze them, read the Liberated Stock Trader research article on stock market crashes and predictions.
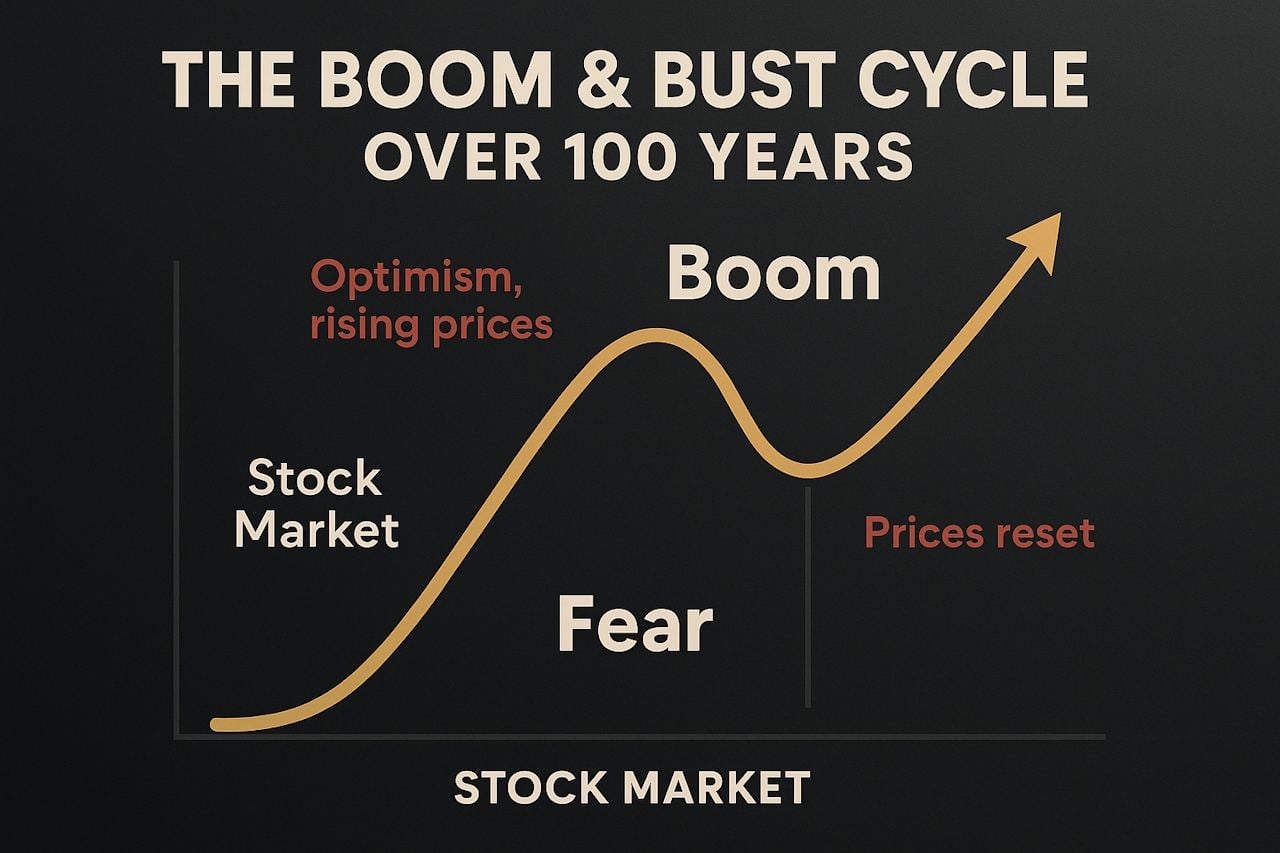
The Boom & Bust Cycle Over 100 Years
Markets move through repeated boom and bust cycles. The details differ each time, but the pattern is surprisingly consistent: optimism and easy money push prices higher, a trigger causes fear, and prices reset to more reasonable levels.

Historically, the US market has experienced several major booms and busts:
- 1929 – The Great Crash: Massive credit-fuelled boom followed by an 89% loss in the Dow and a 23-year recovery.
- 1973 – Oil Shock Crash: Geopolitical tensions and an oil embargo triggered a 46% decline and a 10-year recovery.
- 1987 – Black Monday: A rapid 35% drop in four weeks, but recovery in about 2 years.
- 2000 – Dot-Com Bust: Technology and internet stocks crashed, with the Nasdaq falling 83% and taking 16 years to recover fully.
- 2008 – Global Financial Crisis: A 54% fall in the Dow over 16 months, with recovery in roughly 5 years.
- 2020 – Covid Crash: A sudden 38% drop in about 5 weeks, followed by an unusually fast recovery in around 1 year due to aggressive central bank and government support.
These events look terrifying on short-term charts, but on a long-term chart, they appear as deep valleys in an otherwise upward trend. This is one reason why learning to read stock charts is so useful: you can see history rather than just feel the latest move.
How Long Do Stock Markets Take to Recover?
Based on Liberated Stock Trader’s research, the average of six major US crashes over the last 100 years shows a peak-to-trough loss of 57% and an average recovery time of 9.8 years. The three most recent crashes (2000, 2008, 2020) had deeper average losses of around 62% but a shorter average recovery time of about 7 years, partly due to more active central bank and government intervention.
| Stock Market Crash | Size of Crash (%) | Years to Recover |
|---|---|---|
| 1929 | -89% | 23 |
| 1973 | -46% | 10 |
| 1987 | -35% | 2 |
| 2000 | -83% | 16 |
| 2008 | -54% | 5 |
| 2020 | -38% | 1 |
| Average | -57% | 9.8 |
Two key lessons for long-term investors:
- Crashes are normal, not rare accidents. On average, a major crash has happened every 15–20 years or so.
- Time in the market matters more than timing the market. Investors who stayed invested through these crashes and continued to add money regularly were rewarded when markets recovered and moved to new highs.
10 Common Reasons Stock Markets Crash
Every crash has its own story, but many share the same underlying causes. The original list of 10 reasons can be grouped into three broad themes: investor behavior, economic and policy shocks, and company-specific problems.
1. Investor Behavior & Market Psychology
- Sudden large sell-offs: When many investors rush to sell at once, liquidity dries up and prices gap lower.
- Bubbles that burst: Long booms push prices far beyond reasonable valuations; when confidence breaks, the adjustment is violent.
- Self-fulfilling fear: Falling prices trigger more selling as investors try to “get out in time,” reinforcing the downtrend.
These factors are driven by human emotions: fear, greed, and herd behavior. Tools like the Liberated Stock Trader Fear & Greed Index can help you see when sentiment is stretched, even if timing remains uncertain.
2. Economic, Political & Policy Shocks
- Recessions and slow growth: Weak demand and falling profits cause investors to lower their expectations.
- Natural disasters, wars, or terrorist attacks: These events increase uncertainty and can disrupt trade, energy supplies, or production.
- Changes in interest rates: Sharp increases in rates to fight inflation can hurt both company profits and investor valuations.
- Inflation or deflation spirals: High inflation erodes purchasing power, while deflation can lead to falling profits and debt problems.
3. Company & Market Structure Problems
- Corporate scandals or mismanagement: Accounting frauds and governance failures can trigger loss of confidence in specific sectors.
- Weak regulation and excessive leverage: When financial institutions take on too much risk with too little oversight, the system becomes fragile.
Often, crashes happen when several of these factors align: stretched valuations, rising interest rates, poor risk controls, and a shock such as a pandemic or geopolitical conflict. Understanding the mix of risks helps you manage your exposure rather than guess exact turning points.
Case Study: The 2020 Covid Crash
In early 2020, the spread of COVID-19 caused one of the fastest crashes in history. Major US indexes fell about 38% in roughly five weeks as economies shut down, earnings forecasts collapsed, and uncertainty exploded.
However, this crash was also one of the fastest to recover. Massive central bank support, government stimulus, and a shift to remote-friendly business models helped markets rebound to new highs in about a year.
- Lesson 1: Speed cuts both ways. Modern markets can fall and recover faster than many investors expect.
- Lesson 2: Policy matters. Central banks and governments now act more aggressively to stabilize markets than they did in the 1930s.
- Lesson 3: Diversification helps. Portfolios with exposure to technology and quality companies often recovered faster than narrow, concentrated bets.
What Booms & Crashes Mean for Your Investing Plan
As a new investor, your main task is not to predict the next crash. Your main task is to build a plan that can survive several crashes over your lifetime.
- Accept volatility as normal. Large drawdowns will happen; they are part of earning long-term returns.
- Match your investments to your time horizon. Money needed in the next 3–5 years should not be heavily exposed to stocks.
- Diversify across asset classes. Mixing stocks, bonds, cash, and possibly other assets can soften the impact of crashes. The next lesson, Managing Financial Risk in Stock Investing, will go deeper into this.
- Use rules, not emotions. Having simple rules for rebalancing, position size, and maximum loss per position helps you act calmly during stress.
- Keep learning. Understanding charts, valuation, and sentiment through resources like the guide to stock charts strengthens your confidence.
If you combine clear goals (Lesson 101-02) with realistic expectations about booms and crashes (this lesson) and strong risk management (Lesson 101-04), you have the foundation of a robust investing strategy.
How This Lesson Fits into Course 101
Course 101 is designed to move you from basic awareness to practical investing skills. Understanding booms and crashes is your “big picture” context:
- Before this lesson: You identified your investor type and investment goals.
- In this lesson, you saw how markets actually behave over decades, including painful but normal crashes.
- Next lessons: You will learn how to manage risk, choose investments like stocks, ETFs, and mutual funds, and avoid common scams.
Keep this big picture in mind as you move forward. The more you understand the cycle, the less likely you are to abandon a sensible plan during the next crisis.
Lesson Review Questions
1. What is the key difference between a normal bull market and a stock market boom?
A normal bull market is a period of sustained rising prices supported by improving fundamentals. A stock market boom is more extreme: prices rise rapidly, valuations stretch far above long-term averages, and investor behavior becomes driven by hype and fear of missing out rather than careful analysis.
2. How would you define a stock market crash in practical terms?
Practically, a stock market crash is a rapid and broad fall in stock prices, often 20–30% or more, driven by fear and forced selling rather than gradual repricing. Daily volatility is high, headlines focus on crisis, and many investors rush to sell at the same time.
3. Name three common triggers that can contribute to a stock market crash.
Three common triggers are: (1) an asset bubble that bursts after a long boom, (2) economic or policy shocks such as recessions, oil shocks, or sharp interest rate hikes, and (3) loss of confidence caused by scandals, weak regulation, or excessive leverage in the financial system.
4. Why is the 1929 crash considered an outlier when looking at recovery times?
The 1929 crash is an outlier because the Dow fell about 89% and took roughly 23 years to recover, far longer than other major crashes. Modern crashes have still been severe but typically recovered in 2–10 years, helped by more active central bank and government intervention.
5. As a long-term investor, what should you focus on during a crash instead of trying to call the exact bottom?
During a crash, a long-term investor should focus on sticking to their plan: maintaining diversification, rebalancing if necessary, avoiding panic selling, and continuing regular contributions if their time horizon is long. The goal is to survive the downturn and benefit from the eventual recovery, not to perfectly time the bottom.
6. How does understanding boom and bust cycles support better risk management decisions?
Understanding boom and bust cycles helps you accept volatility as normal and plan for it in advance. Instead of reacting emotionally, you can set position sizes, asset allocation, and cash buffers that reflect the fact that 30–50% drawdowns are possible. This makes it easier to stay invested and apply the risk management ideas from the next course lesson.
This was great
I’m starting to understand how the markets work.