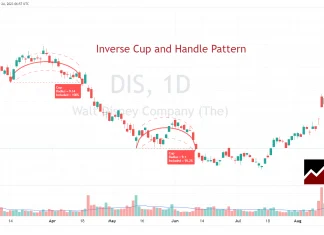
How to Short-Sell an Inverse Cup and Handle’s 82% Reliability
Two decades of trading research indicate that the inverse cup and handle pattern has an 82% success rate and average price drops of 17%. It is an ideal pattern for short-selling.
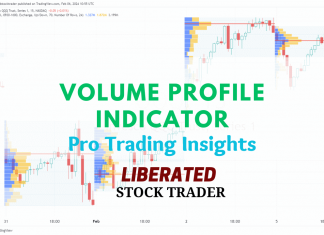
Reading & Trading Volume Profile Indicators Like a Pro
Volume profile technical analysis indicators provide a uniquely detailed overview of volume distribution across price levels, offering traders insights into market structure and supply and demand zones.
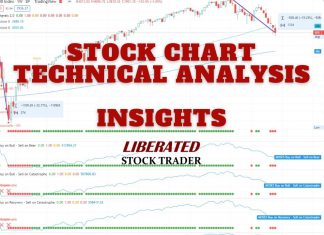
LiberatedStockTrader’s 14-Video Guide to Technical Analysis Mastery
Our ultimate guide to technical analysis will fast-track your knowledge with our 14 videos covering charts, trends, indicators, patterns, and tools.
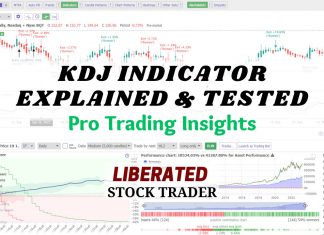
KDJ Indicator Explained: Best Settings & Strategy Tested
The KDJ is a stochastic oscillating technical analysis indicator that helps traders predict price reversals. According to our research, the KDJ has a 63% success rate if configured correctly.
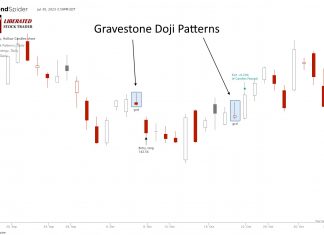
Gravestone Doji Explained & Reliability Tested!
A Gravestone Doji candle indicates a battle between buyers and sellers and is considered bearish. Our 1,553 test trades prove it is the third most profitable candle pattern. But it does not work as most traders believe.
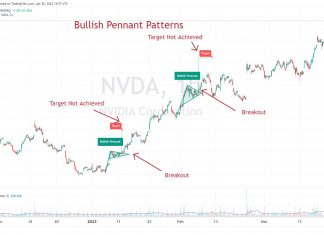
Why Traders Should Avoid Using Bull Pennant Chart Patterns
Traders must be cautious when using bull pennant chart patterns. Published research reveals a low success rate of 54% and a meager price increase of 7%.
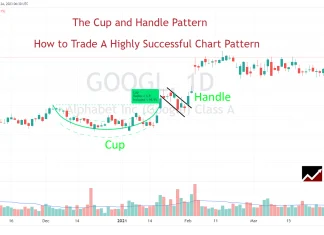
How to Trade a Cup and Handle’s 95% Reliability & 54%...
Twenty years of trading research show that the cup and handle pattern has a 95% success rate in bull markets and returns an average profit of +54%.
How to Trade Market Profile Charts & Best Software To Use
A market profile chart is a day-trading tool that displays the price activity to identify a time price opportunity (TPO). It helps traders identify the most traded prices and develop strategies to exploit these areas.
Weighted Moving Average (WMA) Explained & Reliability Tested
Our research reveals the WMA underperforms other moving averages with only a 7% win rate on a standard OHLC chart. However, using it on Heikin Ashi charts produces excellent results.
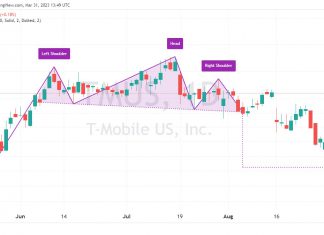
Head & Shoulders Pattern: Trade an 81% Success Rate
The head and shoulders pattern is one of the most accurate technical analysis reversal patterns, with a reliability of 81%. A head and shoulders top occurs when the price peaks on three separate occasions, with two peaks forming the "shoulders" and the central peak forming the head.
Dragonfly Doji Explained: Is it Reliable? I Test It!
The Dragonfly Doji is a candlestick chart pattern that indicates an equilibrium between buyers and sellers after a day of trading volatility. Our 1,703 test trades prove it can be profitable under the right circumstances, but the margins are thin.
10 Best Day Trading Indicators Proven with Data!
Our research on 10,400 years of exchange data shows the best day trading indicators are the Price Rate of Change, VWAP, Weighted Moving Average, Hull Moving Average, Simple Moving Average, and RSI.
Elliott Wave Theory: Usage, Rules & Reliability Tested
Elliott Wave Theory is a scientifically unproven technical analysis indicator used to attempt to predict price movements in financial markets. I highly recommend avoiding this indicator.
1,680 Trades Test the Shooting Star Candle’s Reliability
Based on 568 years of data, our research shows the Shooting Star candle is bullish, not bearish, as most traders believe. It has a 57.1% upside success rate and an average winning trade of 3.6%. Each trade made using a shooting star nets an average of 0.56% profit.
How to Read Candlestick Charts Using 5 Reliable Patterns
You can read candlestick charts using pattern recognition software to identify five reliable patterns, the Inverted Hammer, Bearish Marubozu, Gravestone Doji, Bearish Engulfing, and Bullish Harami Cross.
Top 10 Reliable Candle Patterns: 56,680 Trades Tested
Our 56,680 test trades show the most reliable candlestick formations are the Inverted Hammer (60% success rate), Bearish Marubozu (56.1%), Gravestone Doji (57%), and Bearish Engulfing (57%).
How to Trade a Rectangle Pattern’s 85% Success Rate
Decades of trading research show the rectangle pattern has an 85% success rate in bull markets and an average profit potential of +50%.
What is EMA? Best Exponential Moving Average Settings Tested
An exponential moving average (EMA) technical indicator reduces the lag associated with simple moving averages (SMA) by applying a multiplier to the most recent data. EMAs provide improved sensitivity, enhancing the accuracy of trend analysis.
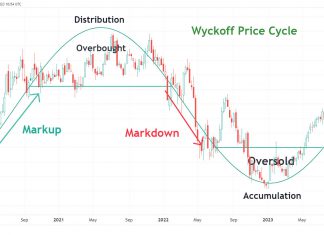
Wyckoff Method Explained: Accumulation & Distribution Trading
The Wyckoff Method is built upon three cardinal laws that govern the financial markets: the Law of Supply and Demand, the Law of Cause and Effect, and the Law of Effort versus Result.
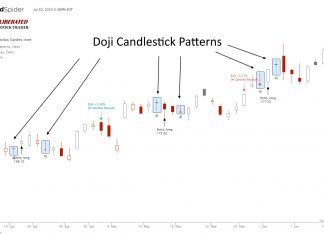
Trading a Doji Candle Explained: I Backtest It For Reliability!
A Doji candlestick chart pattern indicates a battle between buyers and sellers, ending in equilibrium. The Doji marks a potential trend reversal. Is the Doji pattern profitable or accurate? Our evidence suggests its profitability is marginal.
Our Best Training & Strategies
Liberated Stock Trader Pro: Learn Stock Market Investing
Learn stock market investing with the complete online stock trading course by Barry D. Moore, a certified financial analyst from the International Federation of Technical Analysts (IFTA).
ETF Investing Strategy: MOSES Improves Performance & Lowers Risk
The MOSES ETF investing strategy is a powerful suite of indicators meticulously backtested over 100 years. Designed to empower you to outperform the market, it equips you with the tools to navigate major stock market crashes and unlock greater investing performance.
LiberatedStockTrader’s Strategy Beat the Market By 102%
Decades of research and testing unveiled the Liberated Stock Trader Beat the Market System. Our 9-year, backtested, and proven strategy targets 35 financially healthy high-growth stocks, producing a track record of beating the S&P 500 by 102%.

