There are two types of continuation patterns: bullish and bearish. Bullish continuation patterns occur when the market is trending upwards, while bearish continuation patterns happen when the market is trending downwards.
When it comes to analyzing stock charts, continuation patterns are an important tool that traders use to try to predict future price movements. These patterns occur when the current trend in the market is expected to continue.
What is a Continuation Pattern?
A continuation pattern is a price formation on a chart that suggests the market is likely to continue in the direction of the previous trend. There are both bullish (meaning the market is likely to move higher) and bearish (meaning the market is likely to move lower) continuation patterns, and they each have specific characteristics.
Continuation patterns occur during a price move and are visual representations of consolidation or periods of rest before the price continues its trend, upwards or downwards.
What types of patterns are continuation patterns?
Continuation patterns can be identified by looking for certain chart formations, such as flags, pennants, and triangles. These formations indicate that the current trend is likely to continue.
Once a continuation pattern has been identified, traders will watch for certain price movements to confirm that the pattern is valid. If the price movement confirms the pattern, traders will enter into a position in the market accordingly.
How do continuation patterns work?
Continuation patterns work by indicating that the current trend is likely to continue. When a continuation pattern is identified, traders will watch for certain price movements to confirm that the pattern is valid. If the price movement confirms the pattern, traders will enter into a position in the market accordingly.
Bullish continuation patterns
Bullish continuation patterns occur when the market is trending upward, indicating that the current trend will continue. The most common bullish continuation patterns include flags, pennants, and triangles.
When traders see a bullish continuation pattern form on a stock chart, they usually look for the price to break above the resistance level to confirm the pattern. Once the breakout occurs, traders can enter a long position in anticipation of further price increases.
Bearish continuation patterns
Bearish continuation patterns occur when the market is trending downward, indicating that the current trend will continue. The most common bearish continuation patterns include flags, pennants, and triangles.
When traders see a bearish continuation pattern form on a stock chart, they usually look for the price to break below the support level to confirm the pattern. Once the breakout occurs, traders can enter into a short position in anticipation of further price decreases.
6 important continuation patterns
The six types of continuation patterns are the flag, pennant, ascending triangle, symmetrical triangle, descending triangle, and wedges.
All of these triangles are essentially continuation patterns. They should give you some confidence that the trend will continue. Always be aware that you should be prepared to act if the price breaks out in the wrong direction due to a shock (e.g., bad earnings or a negative news event).
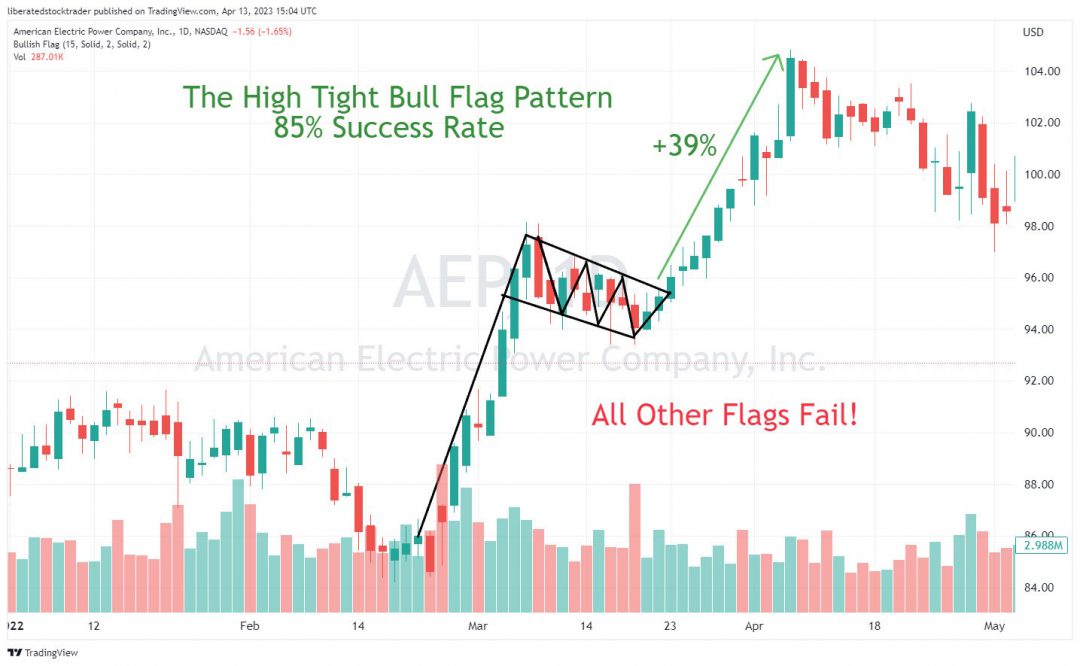
1. Flag continuation pattern
The Flag stock chart pattern starts with an uptrend in price and is met by buyers’ resistance to this new price high.
As the stock price moves down, the buyers buy at new lows, displaying confidence that the stock price will increase. When the price breaks through the upper parts of the flag pattern, that is the time to buy.
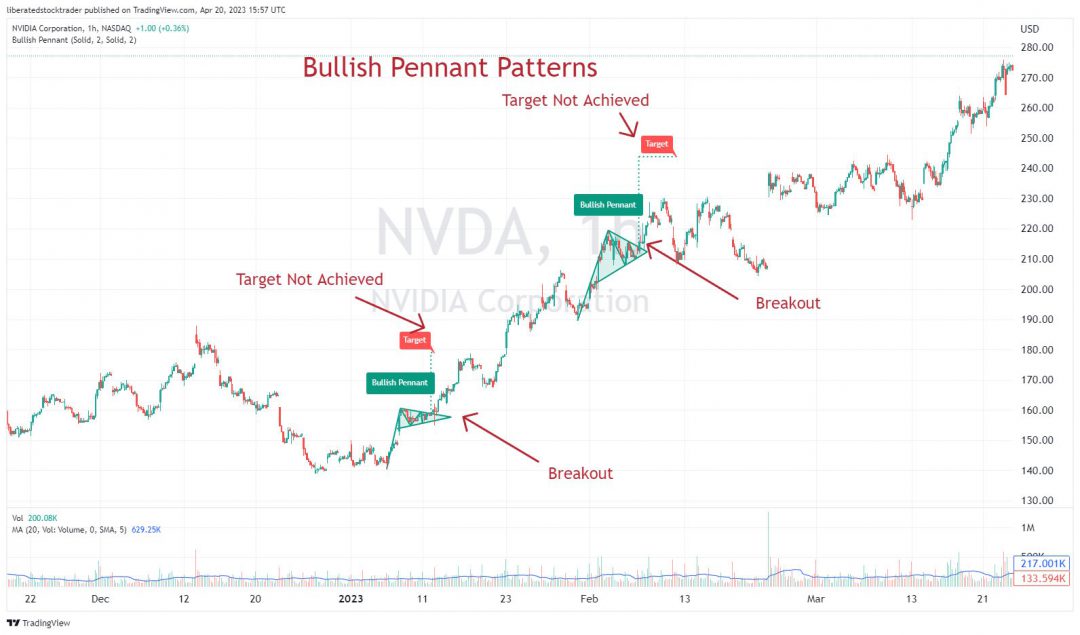
2. Pennant continuation pattern
The Pennant stock chart pattern shows that the stock price meets resistance during an uptrend, and the uptrend temporarily halts. Here, you see lower highs but also a horizontal support line.
This indicates that the sellers are unwilling to sell for less than this price, which builds momentum for a breakout through the support line onto new highs for the stock price.
3. Ascending triangle continuation pattern
The Ascending Triangle looks the opposite of a Pennant, but the outcome is the same.
An ascending triangle continuation pattern is a type of stock chart continuation pattern that signals a continuation of the current trend. It is typically identified by two converging trendlines, with the upper trendline as resistance and the lower as support.
This time, the buyers are happy to buy at the upper horizontal resistance line price, but the sellers are unwilling to sell at new lows.

This drives supply and demand through the upper resistance line and on to new stock price highs.
4. Descending triangle continuation pattern
A Descending triangle continuation pattern is a type of stock chart pattern that signals a trend continuation. It is typically identified by two converging trendlines, with the lower horizontal trendline as resistance and the upper descending trendline as support.
The Descending Triangle shows a very different picture. As the price moves down, the sellers believe the price is undervalued and refuse to sell at this new low price.
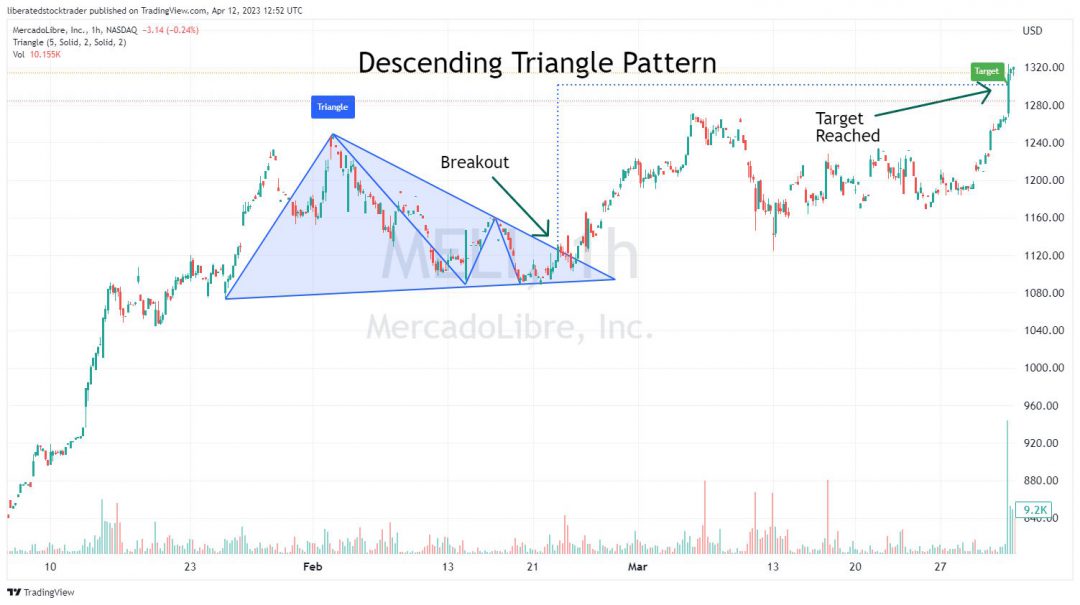
However, the number and willingness of buyers are also drying up, meaning that ultimately, the stock price will continue falling without demand from buyers.
5. Rectangle continuation pattern
A widespread continuation pattern is the Rectangle, more commonly known as a “channel” or “trading range.” The price should normally break out in the same direction as the previous trend.
The Rectangle means a period in which the buyers and sellers, or supply and demand, are at equilibrium; this means sideways consolidation.
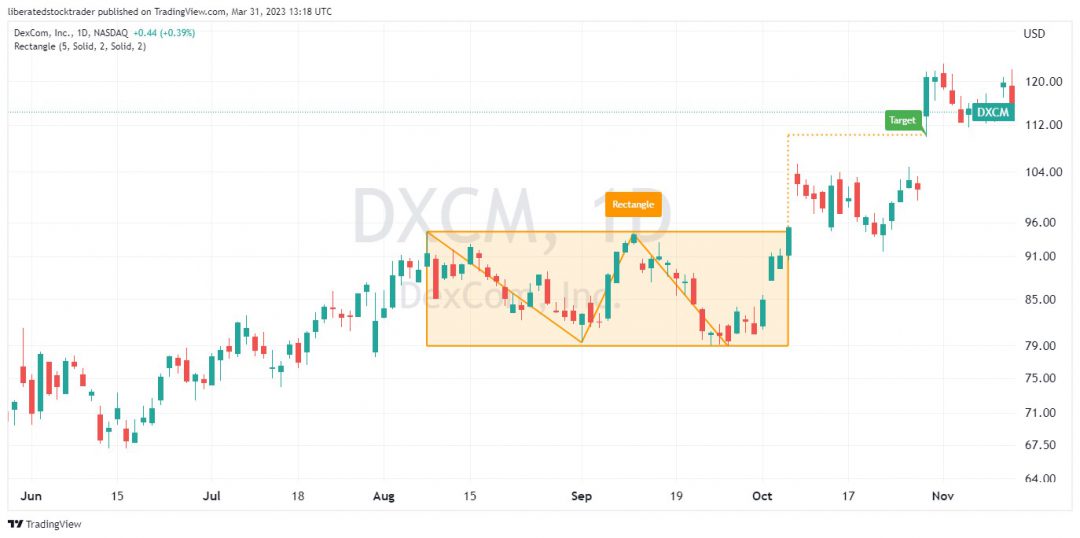
It is often considered a resting or cooling-down period, and most technical analysts expect a breakthrough of the resistance or support line to mean a continuation of the uptrend.
6. Wedge continuation patterns
A wedge chart pattern can be both a continuation and a reversal pattern, depending on which direction the wedge is pointing. A falling wedge means the price will increase; a rising wedge means the price will decrease.
In the image below, we can see that the falling wedges signify an upward breakout.
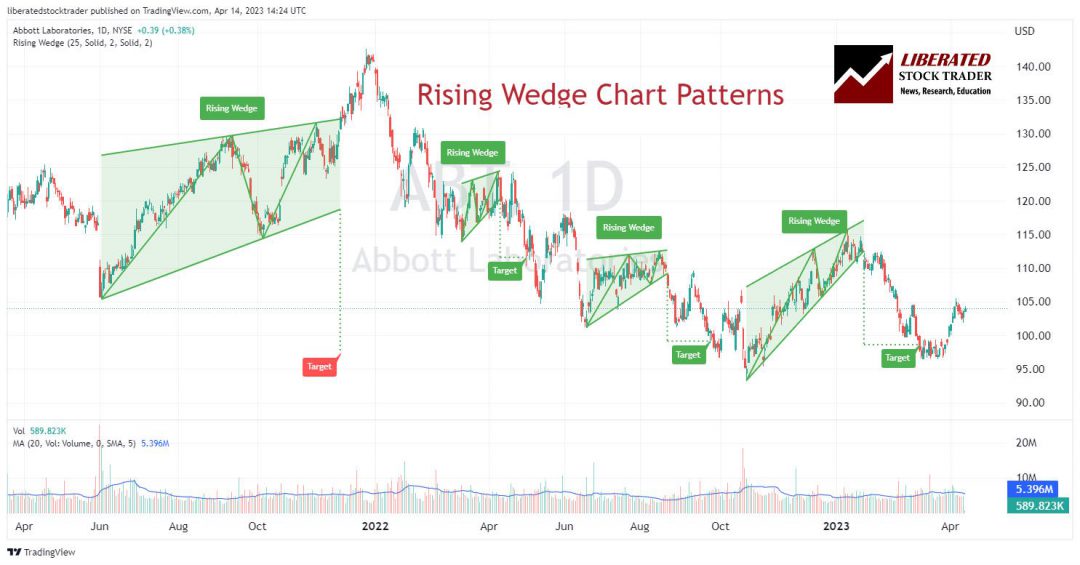
But beware, if the break of the consolidation pattern is in the opposite direction, this means a reversal pattern.
Further Reading: Liberated Stock Trader PRO – 16 Hours of In-depth Video Lessons + Book
Continuation pattern summary
When it comes to analyzing stock charts, continuation patterns are an important tool that traders use to try to predict future price movements. By understanding how these patterns work, traders can better position themselves to profit from the market.