The stochastics indicator uses stock price highs and lows combined with a moving average to provide insights into future stock price direction. But is the stochastics indicator worth it?
Created by George C. Lane in the late 1950s, stochastics gained appeal through its ability to show if a stock is overbought or oversold. Stochastics can be useful but also provide many false signals for traders.
Updated In-Depth Stochastic Oscillator Article
Stochastic Oscillator Explained: Best Strategy & Settings Tested
This lesson will discuss the stochastic indicator, how best to use it, and when not to use it.
What is the stochastic indicator?
The stochastic indicator is a momentum indicator that measures the strength of recent price movements to identify possible overbought or oversold conditions in the market. The indicator is based on the premise that prices tend to close near the highs in an up-trending market and near the lows in a down-trending market.
How does the stochastic indicator work?
The stochastic indicator compares the current asset price to the recent high and low prices. A reading above 80% indicates that the market is overbought, while a reading below 20% indicates that the market is oversold.
The stochastic indicator consists of two lines, %K and %D, oscillating between 0 and 100. %K is the main line, and it is derived from recent prices; %D is a signal line that is a moving average of %K.
Buy signals are generated when %K crosses above %D; conversely, sell signals are generated when %K crosses below %D. These crossover signals can be used to identify possible turning points in the market.
Stochastic Indicator Example Chart

What is the formula for the stochastic indicator?
The formula for the stochastic indicator is:
%K = (Current Price – Lowest Price)/(Highest Price – Lowest Price) * 100
How to read stochastic indicators?
The stochastic indicator can be displayed in several ways on a chart, but the most common way is to have two lines, %K and %D, with crossovers indicating buy or sell signals. The indicator can also be displayed as a histogram, a single line (fast stochastic), or two lines (slow stochastic).
How do you use a stochastic oscillator indicator for trading?
The stochastic indicator can be used in many ways, but the most common way is to look for buy signals when %K crosses above %D and sell signals when %K crosses below %D. These crossover signals can be used to identify possible turning points in the market.
Is stochastic a leading indicator?
The stochastic indicator is a momentum indicator that measures the strength of recent price movements to identify possible overbought or oversold conditions in the market. As such, it is classified as a leading indicator.
The difference between fast and slow stochastics
Fast Stochastics use shorter time settings for periods and averages; this creates a more reactive indicator and more false alarms. Slow stochastics use longer periods, creating a smoother flow and clearer trends, but the drawback is the indicator lags price and is less responsive.
How to use a slow stochastic indicator?
The slow stochastic indicator is a version of the regular one that uses a moving average of %K to smooth out the fluctuations and provide a clearer picture of the underlying trend.
The fast stochastic indicator is a version of the regular one that uses a shorter period to generate buy and sell signals. This makes it more sensitive to recent price changes and more prone to false signals.
What are the pros of the stochastic indicator?
The main advantage of the stochastic indicator is that it can help traders identify overbought or oversold conditions in the market. Additionally, the stochastic indicator can confirm signals from other indicators. Finally, because the stochastic indicator is a leading indicator, it can often signal reversals before they occur.
What are the cons of the stochastic indicator?
The main downside of the stochastic indicator is that it can generate many false signals, particularly when used with the fast stochastic indicator. Additionally, the stochastic indicator is useless when the market trend is sideways. All indicators that rely on moving averages, such as stochastic, have high error rates during consolidating markets. As such, it is best used with other indicators to confirm signals.
What are stochastic divergences?
Stochastic divergences are when the price and stochastic indicators move in opposite directions, indicating a possible reversal in the market. There are two types of stochastic divergences: regular and hidden.
How do you trade with stochastic divergences?
There are a few different ways to trade with stochastic divergences. One way is to look for regular divergences and enter a trade when the price confirms the signal by moving in the same direction as the indicator. Another way is to look for hidden divergences and enter a trade when the price breaks out in the direction of the indicator.
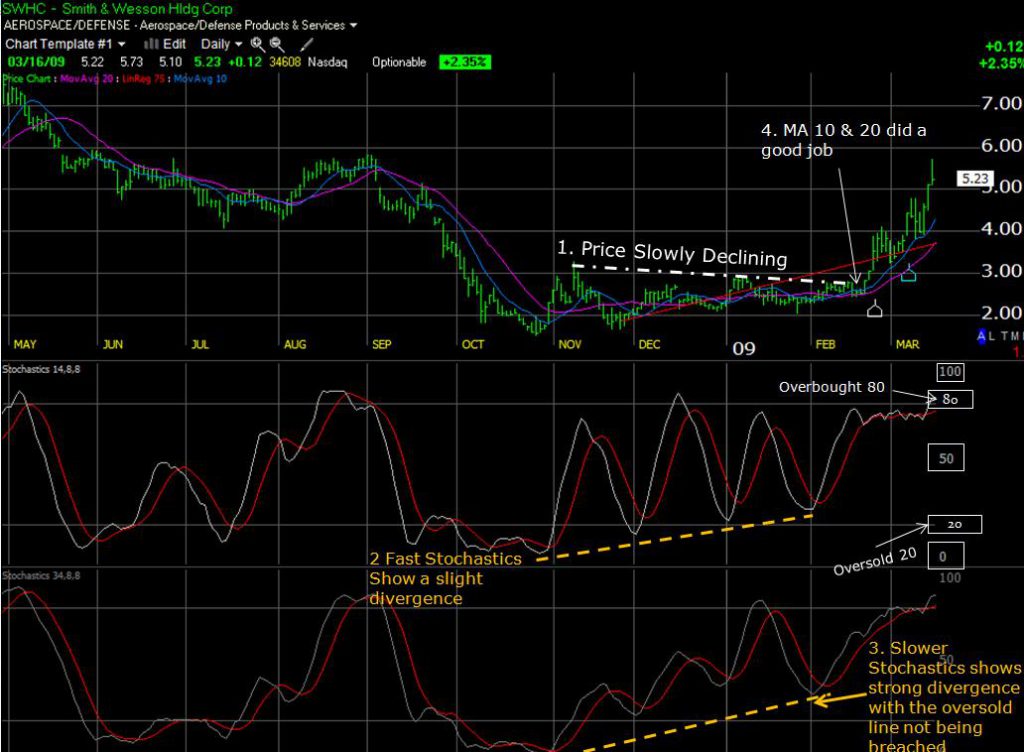
4 Point Analysis Using Stochastics
- From November to February, the stock’s highest highs are slowly declining.
- Fast Stochastics Settings (14,8,8 ) show a slight divergence and many false alerts.
- Slow stochastics (34, 8, and 8 ) show much smoother lines and more substantial divergence where the stock for this period does not reach an oversold state.
- Moving Averages (10 & 20) did an excellent job indicating the ideal time to buy. Thus, using stochastics with other indicators is essential.
If you like to use stochastics, use them with care. Follow the guidelines above and use them with other indicators.
Divergences are your friends with practically all indicators. Remember, when a symbol starts to diverge with the price trend, this is an early warning signal that the underlying factors behind a stock price change may not be visible in the price pattern.
The five stochastic trading strategies
The five most common stochastic trading strategies include the following:
1. Crossover trading
The crossover trading strategy involves taking a long or short position when the stochastic indicator crosses above or below certain threshold values.
2. Divergence trading
Divergence trading involves taking a long or short position when the price and stochastic indicator diverge.
3. Momentum trading
Momentum trading means taking a long or short position when the stochastic indicator shows increasing or decreasing momentum.
4. Range trading
Range trading means taking advantage of stock price moves by taking a long or short position when the stochastic indicator is in overbought or oversold territory.
5. Trend following
The stochastic trend-following strategy involves taking a long or short position when the stochastic indicator is in line with the overall trend.
What is the stochastic RSI indicator?
The stochastic RSI is a momentum indicator that measures the strength of recent price movements using both price and RSI (relative strength index) data.
What is the RSI indicator?
The RSI (relative strength index) indicator is a momentum indicator that measures the speed and magnitude of price movements to identify overbought or oversold conditions in the market.
How to read stochastic rsi indicator?
The stochastic RSI is displayed as a line oscillating between 0 and 100. Buy and sell signals are generated when the line crosses above or below certain threshold values, typically 20 for overbought conditions and 80 for oversold conditions.
Final thoughts on stochastics
The stochastic indicator is a technical analysis tool used to identify overbought or oversold conditions in the market. The indicator is based on the premise that prices tend to close near the highs in an up-trending market and near the lows in a down-trending market.
The stochastic indicator can be used to confirm signals from other technical indicators and can also be used to generate buy and sell signals.
While the indicator does have some drawbacks, such as generating false signals and being a lagging indicator, it can be a helpful tool for traders in making trading decisions.
Lesson summary
The stochastic indicator is a momentum indicator that measures the strength of recent price movements to identify possible overbought or oversold conditions in the market. The indicator can be used in several ways, but the most common way is to look for buy signals when %K crosses above %D and sell signals when %K crosses below %D. These crossover signals can be used to identify possible turning points in the market.
The stochastic RSI is displayed as a line oscillating between 0 and 100. Buy and sell signals are generated when the line crosses above or below certain threshold values, typically 20 for overbought conditions and 80 for oversold conditions.
Always use stochastics with other indicators, not alone. Stochastics use the price Open, High, Low, and Close for the period, so they can be used well in conjunction with RSI, which uses only Close Price as the input.
Backtest a stochastic setting to see if it fits the past. Adjust the Values to fit the stock.
If it does not tell you anything, do not use it.