Chart patterns in technical analysis can be reliable and accurate, but they never work 100% of the time. Undoubtedly, stock chart patterns are a popular technical analysis tool, but do they actually work?
Many traders swear by the accuracy and reliability of stock chart patterns, while others say they are nothing more than random noise. So, what is the truth? Do stock chart patterns work?
In this lesson, we will look at the evidence to see if there is any truth to the claim that chart patterns are accurate and reliable. Stay tuned!

Do stock chart patterns work?
Yes, stock chart patterns work, but not as often as you think. Stock chart pattern accuracy and reliability are essentially down to probabilities. For example, a head and shoulders pattern has an 89% chance of being accurate under certain market conditions.
TradingView 4.8/5⭐ : The Best Trading Platform I’ve Tested in 20+ Years
With lightning-fast charts, powerful pattern recognition, smart screening, backtesting, and a global community of 20+ million traders — it’s a powerful edge in today’s markets.

If you want one platform that gives you an edge, this is it.
Factors affecting chart pattern reliability
Many factors can affect the accuracy and reliability of stock chart patterns. Let’s take a look at some of these factors:
Chart timeframe
The chart’s time frame is one of the most important factors to consider when using chart patterns. Different time frames will produce different results. For example, a pattern that works on a daily chart may not work on a weekly chart.
The type of pattern
There are many different types of chart patterns, and not all are equally reliable. Some patterns, such as the head and shoulders, have a high success rate. Others, such as the double top/bottom pattern, are not as reliable.
The market conditions
Chart patterns can be affected by the overall market conditions. For example, they may work well in a bull market but not so well in a bear market. Additionally, while the stock market tries to price in future political or economic events, changes in market conditions can make chart patterns irrelevant.
News events and announcements
A stock price may be moving in the direction a chart pattern suggests. But if a major news or earnings announcement is released, that can cause an immediate change to the price pattern. This event can easily null and void the previous hypothesis on stock price direction and require new analysis.
Chart Pattern Accuracy & Reliability Diagram
Price patterns and trendlines share the same characteristics. The longer they are, the more important they are. The more a price pattern touches a trend line and reverses, the more important that line is. In this diagram, we see that the accuracy of a Triple Top is more than that of a Single Top. Why? Because the price touches the resistance level more times.
The following diagram shows us the most common reversal patterns and their relative probability of accuracy.

Commonly cited examples of reliable chart patterns include bullish and bearish pennants, ascending and descending triangles, and head and shoulders formations.
Does chart pattern trading work?
The effectiveness of chart pattern trading will depend on various factors, including the market you are trading and the specific chart pattern you use. However, there is evidence that chart patterns can be effective, and many traders find that using them can improve their trading results.
Proof that chart pattern trading works
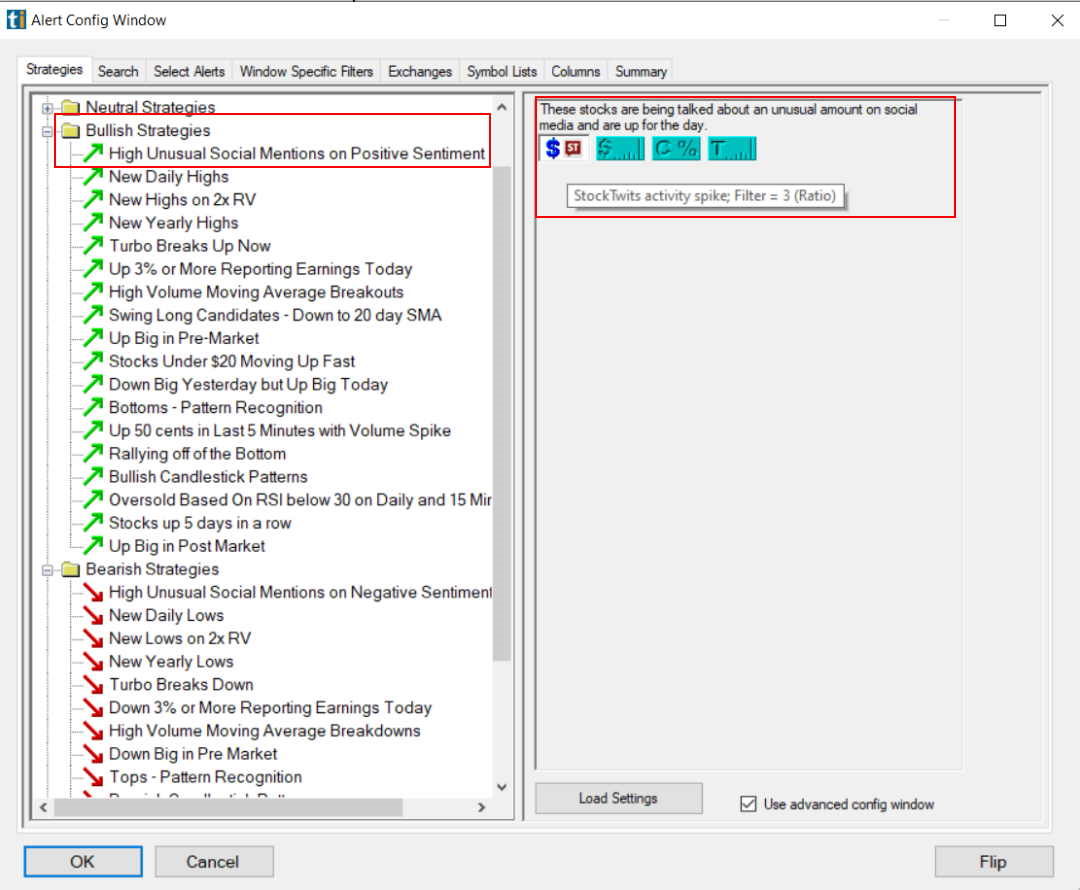
The best proof that Trade Ideas provide chart pattern trading works. Trade Ideas uses powerful AI algorithms to analyze millions of stock chart data points daily to recommend high-probability stock trades for their clients.
Trade Ideas uses AI to scan for a breakout, new highs, gaps, and candlestick patterns to generate high-probability trades. Here is a screenshot of the patterns analyzed.
The Trade Ideas AI engine Holly beats the market using trends and chart patterns. Here are the results.
Holly Grail AI has outperformed the S&P 500 since 2019 by 10%, and Holly 2.0 beat the market by 31%.
| Holly AI Performance | Starting Capital Jan 2019 | Ending Capital Oct 2020 | Total Return | % Per Year |
| Holly Grail (AI) | $50,000.00 | $71,186.00 | 42% | 23% |
| Holly 2.0 | $50,000.00 | $80,510.00 | 61% | 33% |
| Holly Neo | $50,000.00 | $71,186.00 | 42% | 23% |
| S&P 500 | $50,000.00 | $66,000.00 | 32% | 17% |
Why do chart patterns work?
There are several reasons why chart patterns may be effective, including the following:
- Many traders find that chart patterns can help them to identify potential trading opportunities.
- Chart patterns can provide a visual representation of past price movements, which can help traders to anticipate future price movements.
- Chart patterns can be used to identify potential support and resistance levels.
- Chart patterns can also measure the strength and momentum of a trend.
While chart patterns can be helpful, it’s important to remember that they are not perfect. Chart patterns are not always accurate and can sometimes produce false signals. As with any trading strategy, it’s important to test chart pattern trading before using it in live trading.
Do chart patterns work in all markets?
Theoretically, yes, chart patterns work in all markets where there is a free exchange of assets for market-driven prices. Where markets are influenced heavily by external parties such as dictatorial governments or large-scale monopolies, chart patterns will not be effective as the market direction will be dictated centrally.
Are chart patterns reliable and accurate?
The longer the timeframe and the larger the market increases, the reliability and accuracy of chart patterns. For example, on a 1-minute chart, chart patterns can be very unreliable because a single large trade can disrupt a pattern. Viewing a major stock market index like the S&P 500 on a daily or weekly chart can mean chart patterns are very reliable.
What are the most reliable chart patterns?
The most reliable chart patterns form a trend over a longer duration with more data points. For example, an inverse cup and handle pattern typically forms over a longer period, and when the price breakout finally comes, it is usually reliable.
Do chart patterns work in Forex?
Yes, chart patterns also work in foreign exchange currency trading (FOREX). In fact, chart patterns are the primary technical analysis tool used in trading these markets.
Chart Pattern Accuracy Summary
As you can see, many factors must be considered when determining whether stock chart patterns work. In our opinion, the answer is yes if you take the time to understand all of the factors involved. However, they are not always accurate or reliable. If you use chart patterns, be sure to do your homework and understand all the risks involved.
The Ultimate in Stock Chart Pattern Accuracy
You want to be a successful stock investor but don't know where to start.
Learning stock market investing on your own can be overwhelming. There's so much information out there, and it's hard to know what's true and what's not.

Liberated Stock Trader Pro Investing Course
Our pro investing classes are the perfect way to learn stock investing. You will learn everything you need to know about financial analysis, charts, stock screening, and portfolio building so you can start building wealth today.
★ 16 Hours of Video Lessons + eBook ★
★ Complete Financial Analysis Lessons ★
★ 6 Proven Investing Strategies ★
★ Professional Grade Stock Chart Analysis Classes ★