Ichimoku clouds are a technical analysis tool in stock trading and other investment fields. The clouds are composed of five lines that can be used to identify current trends, support and resistance levels, and price targets.
The cloud formation uniquely represents the market’s trend, momentum, and volatility. Traders use Ichimoku clouds to make buy and sell decisions, set stop-losses, and target prices.

The 5 Elements of Ichimoku Clouds
The five lines that make up the Ichimoku cloud are:
The Tenkan-sen line is the fastest-moving average line used as a short-term trend indicator.
The Kijun-sen line is a slower-moving average line used as a long-term trend indicator.
The Senkou Span A line is the midpoint between the Tenkan-sen and Kijun-sen lines and is a leading indicator of future price action.
The Senkou Span B line is the slowest-moving average line, forming one edge of the Ichimoku cloud. This line is also used as a leading indicator of future price action.
The Chikou Span line is the current price action plotted 26 periods behind. This line is used as a lagging indicator to confirm trends.
The Ichimoku cloud can use other technical indicators to form a complete trading strategy. For example, many traders will use the clouds to identify entry and exit points and set stop-losses and target prices.
When using the Ichimoku cloud, it is important to remember that price action tends to respect the cloud formations. This means that when prices are above the cloud, it is generally indicative of an uptrend. Likewise, when prices are below the cloud, it is generally indicative of a downtrend.
The Ichimoku cloud is a powerful technical analysis tool that can be used to make informed trading decisions. When used correctly, the clouds can help you identify trends, set stop-losses, target prices, and maximize profits.
Ichimoku Cloud Example
Look at the next example and read the notes below to understand the cloud.
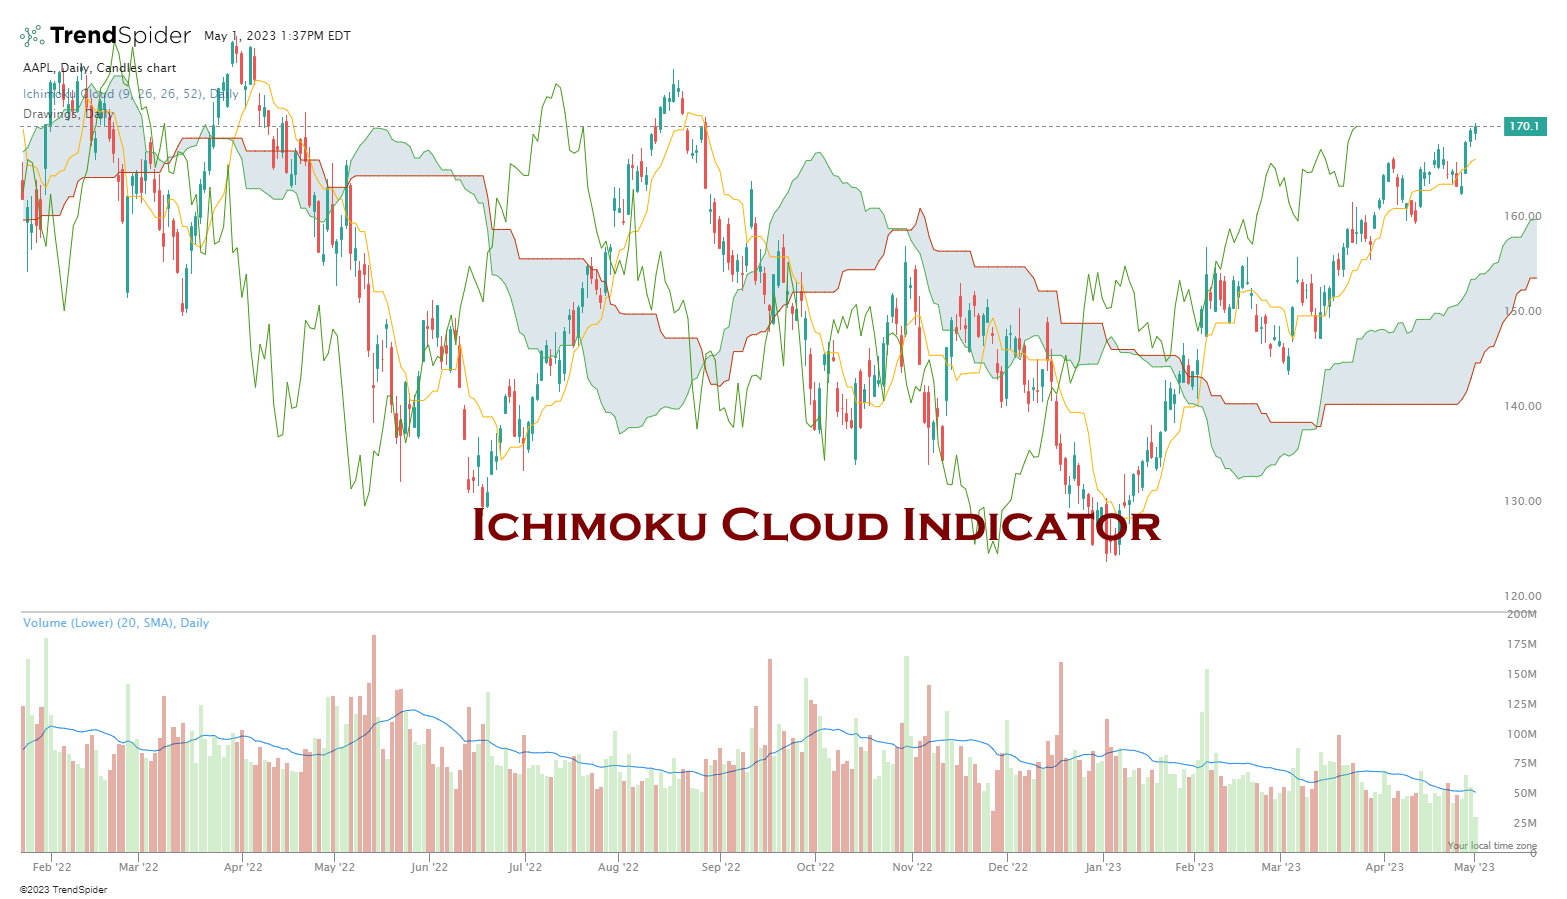
Ichimoku Cloud Chart Notes:
- This is a bearish sign when a price pattern enters and breaks through the cloud downwards from above.
- When a price pattern enters the cloud from below and breaks out up through the cloud, this is a bullish sign.
- The cloud can also indicate a good area of support for the price.
This is a weekly chart of the S&P 500 mapped against the Ichimoku Cloud.
The chart is mapped back to 2000, so we can visually compare the Dotcom crash ending in 2003 with the 2008 recession. How does the price compare with the Ichimoku cloud on both occasions?
The findings are extremely interesting!
- In September 2000, the price broke down through the cloud support, signaling a declining market.
- The market entered into a three-year bear market, finding support at 800 points 3 times in late 2002 and 2003.
- In August 2003, the S&P500 broke through and out of the cloud and moved vigorously into a new bull market.
- Moving forward to November 2007, the market enters the cloud from above, and the ensuing bear market takes hold.
- On August 3rd, 2009, the S&P entered the cloud from below. This potentially bullish sign can only be confirmed when the index breaks upwards through the cloud and moves higher on stronger volume.
- On the volume pane (middle pane), we see that on both occasions, the bottom of the market took place on reducing volume.
- We also see the MACD Histogram (weekly), which has remained bullish since entering the cloud in 2009, as in 2003.
The Ichimoku cloud is an excellent way to visualize what stage the market is in.
The expectation is that once a stock or index enters the cloud from below, it will continue through the cloud and exit above the cloud, this signal a strong uptrend or bull market. Also, the opposite is true. If the stock or index enters the cloud from above, it is expected to break out through the bottom, meaning a potential bear market.
Section Summary
In this section, we covered market trends and how to assess them. The important aspects to remember are the use of Dow Theory and the indexes, which must be confirmed. The types of training are important trends, down and sideways. Do not forget that a trend also has a short-term, medium-term, and long-term timeframe.
Other very useful concepts are the Elliott waves and the Ichimoku cloud.
Formulate your opinion on market direction, and you will know if it is a good time to trade.