Volume is the number of securities traded within a certain time frame. It is usually represented by the size of the bars on a stock chart and can be used to measure the intensity of buying or selling pressure. Generally, a high volume indicates strong buying or selling pressure, while a low volume indicates weak buying or selling pressure.

The use of volume in technical analysis is essential as volume allows us an insight into the supply and demand situation. The following charts incorporate volume into the price window to provide additional information.
Price at Volume Chart
The price at volume chart is an exciting new development, as instead of showing volume for a certain period, it shows us the volume of trades at a specific price level.
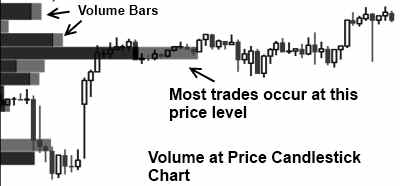
This enables us to see at what price level most market participants believe the stock is reasonably priced.
Pros
Price at Volume Charts help traders see the supply and demand imbalances in the market. As volume increases, the chart will show more price activity, which can be used to find entries and exits.
Innovative and intuitive, this charting method, combined with standard volume bars, can enable you to see market psychology both in time and price. It is also easy to see volume increasing as price rises; this is a very bullish sign.
Cons
The cons of the price at volume charts are that they can be difficult to read and analyze. The lines on the chart can be confusing, and it can be tough to determine which line corresponds to which price point. Additionally, volume data is not always available so these charts may be incomplete. Additionally, very few stock charting packages offer this type of indicator.
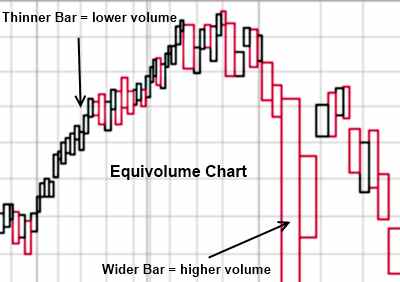
EquiVolume Stock Charts
EquiVolume attempts to provide the solution of Volume at Price differently.
Instead of plotting volume in separate bars, it is incorporated into the price bars. The wider the price bar, the more shares were traded during that period.
The Pros of EquiVolume Stock Charts
EquiVolume stock charts are created by dividing each trade’s volume by dividing it by the stock’s share volume. This creates a “volume-weighted” chart that gives more weight to larger trades and smooths the chart. This can help spot institutional buying and selling patterns.
The Cons of EquiVolume Stock Charts
This type of chart can distort the timeline running across the bottom of the chart. This makes drawing accurate trend lines more challenging. Only a few stock charting service providers offer EquiVolume.
For example, the beginner should stick to the more mainstream chart format, OHLC.
For a more advanced version of the lesson, please read Stock Volume: How to Use Volume in Charts Like a Pro.