RSI, or Relative Strength Index, is a momentum oscillator that measures the speed and change of asset price movements. RSI can dramatically improve your stock trading results with its 53% win rate and 61% average winning trades.
This lesson will guide you through using RSI to help your stock trading and decision-making.
What is RSI?
The relative strength index (RSI) is a technical indicator used in trading to measure the speed and magnitude of price changes. J. Welles Wilder, Jr. developed it first introduced it in his book New Concepts in Technical Trading Systems. The indicator is also known as “Wilder’s RSI,” “relative strength,” or “momentum.”
Lesson Upgrade: Ultimate Guide to Trading RSI
How does RSI work?
The RSI indicator measures the strength of any stock by dividing its average net up closing day prices by its average net down closing process for the period set.
RSI fluctuates between O and 100, 0 is oversold, and 100 is overbought. It is a leading indicator and can be used to predict future trend changes using positive or negative divergences compared to price.
The RSI oscillates between 0 and 100. Extremes above 70 or below 30 are considered overbought or oversold, respectively. When the RSI moves out of an overbought/oversold area, it is supposed to indicate a change in the trend.
How is RSI calculated?
The RSI is calculated using the following formula:
RSI = 100 – (100 / (1 + RS))
where RS = Average Gain / Average Loss
The average gain and loss are usually calculated over 14 periods but can be modified.
Understanding the RSI indicator
Wilder designed the Relative Strength Index to measure both trends and cycles simultaneously. The indicator does this by comparing the magnitude of recent gains to recent losses and turning that information into a number that moves between 0 and 100.
When prices move higher, the indicator will increase; when prices move lower, the indicator will decrease.
The speed at which the indicator changes is also important. If RSI increases quickly, this may indicate a new uptrend; if it declines quickly, it may indicate a new downtrend.
How to use RSI for trading
The key to using RSI for trading is to compare the stock price trend versus the RSI trend to identify divergences. The chart below shows four key points on how to use RSI for trading.
- Price highs are trending lower, while overall prices are slowly consolidating and moving downward.
- The stock price lows slowly increase, forming a wedge stock chart pattern.
- At the point where the stock price trendlines meet, there is a decision: will the stock price trend move higher or lower?
- With a 7.7 setting, RSI acts as a leading indicator and tells us that the price will move higher at the end of the current trend.
- RSI, configured with a slower 14.7 setting, also confirms the future price move higher.
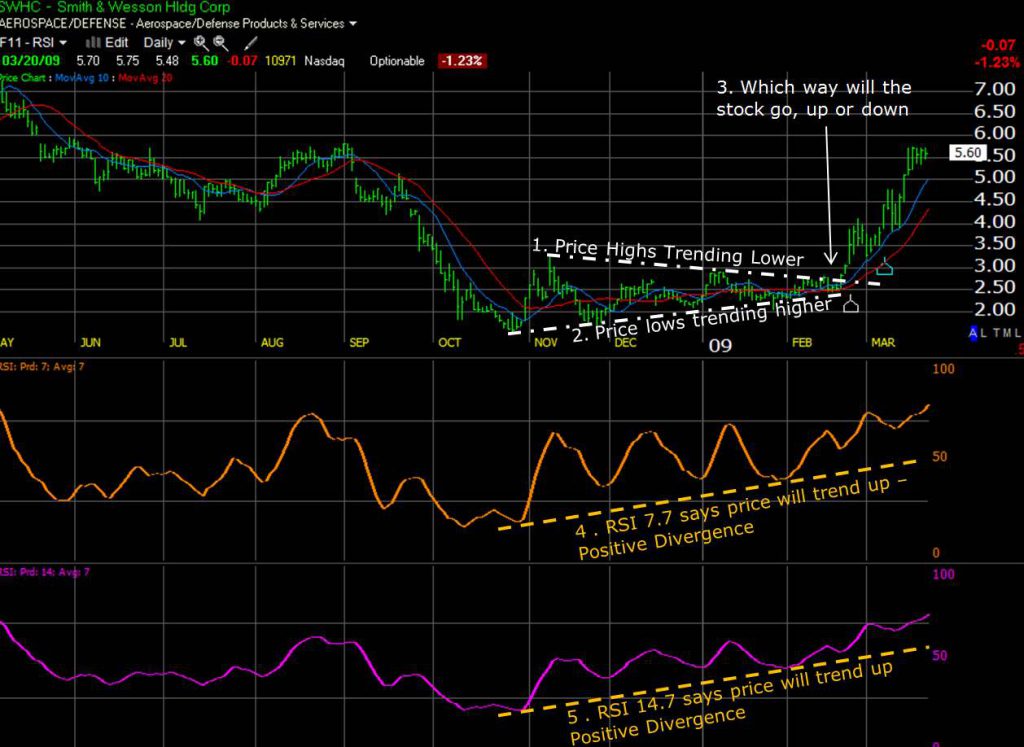
We are using the RSI to identify divergences. What a great result and proof that RSI has real meaning and application. This example clearly shows how the RSI indicator can be used as a leading indicator to help predict future price moves.
What is overbought and oversold in RSI?
The RSI indicator can be used to identify overbought and oversold conditions. Wilder defined these as follows:
Overbought: If the RSI is above 70, this is considered an overbought condition, and there may be a pullback in prices.
Oversold: If the RSI is below 30, this is considered an oversold condition, and prices may rebound.
Is RSI a good indicator?
Yes, RSI is a good indicator. It helps to identify trends and potential reversals. However, it is not the only indicator that should be used when trading. A combination of indicators is often more effective than any single indicator.
Does the RSI indicator work?
Yes, the RSI indicator works and is a useful technical signal. However, its effectiveness will vary depending on the individual trader and the market conditions at the time. However, the RSI indicator is useful for identifying trends and potential reversals.
Is RSI a leading or lagging indicator?
Divergences are one of the most powerful ways to use most indicators. RSI is a leading indicator, as opposed to moving averages, which are lagging and can thus indicate future directional changes.
RSI is a lagging indicator, but by using divergences skillfully, it can be used as a leading indicator.
The RSI indicator can be either leading or lagging, depending on the individual trader and the market conditions. It can generally be useful for identifying trends and potential reversals, but it is not the only indicator that should be used when trading.
Using RSI divergences
If the price increases and the RSI decreases over time, this is called an RSI bearish divergence. If the stock price decreases and the RSI decreases, this is a trend confirmation.
The RSI can also identify overbought and oversold levels, which helps you identify potential entry/exit points in the market. By looking for divergences between the stock price and the RSI indicator, traders can gain an edge on their decisions. This information and other technical indicators may help you find profitable trades.
RSI indicator divergence example chart

Using RSI as a leading indicator with price divergence and price confirmation. In the chart above, you can see the following 4 points:
- The stock price is increasing
- a bearish RSI divergence emerges. Stock prices then crash
- Stock price recovers the starts decreasing
- RSI confirms the market crash by also decreasing
Does RSI work all the time?
No, RSI does not always work. Our 26 years of testing show that it works 53% of the time and beats a buy-and-hold strategy on the S&P 500 stocks.
While the RSI is a useful tool, no stock chart indicator works 100% of the time. Like all stock chart indicators, RSI is prone to giving false signals in choppy markets. As with any technical indicator, it’s important to use the RSI in conjunction with other forms of analysis.
When combined with price action and other technical indicators, the Relative Strength Index can be a powerful tool for any trader.
Using RSI indicators for buy and sell signals
Certain buy and sell signals can be used as a guide when trading with the RSI. A buy signal is typically indicated when the RSI moves above 70, while a sell signal is typically indicated when the RSI moves below 30. Of course, these are just general guidelines and should not be considered gospel. Using other indicators in conjunction with the RSI is always important to confirm any generated signals.
Where to get the RSI indicator?
The best website and charting service for the RSI indicator is TrendSpider, which allows you to backtest the best RSI settings for the stock you are trading easily. The RSI indicator is popular and available with all stock chart analysis software services.
We recommend TradingView for the best overall stock charting service and trading community for all global markets.
Best RSI Stock Market Software
- TrendSpider: Best Fully Automated AI Technical Chart Analysis.
- TradingView: Best Free RSI Stock Screener & Charting Platform.
RSI indicator summary
RSI is an excellent predictive leading indicator that, when used to spot divergences, is a powerful tool for the stock trader. Please ensure you practice using RSI to improve your trading outcomes.
Pro Stock Charting Training
Try the Liberated Stock Trader Pro Training for expert, video-driven guidance on professional stock charting and indicators.
You want to be a successful stock investor but don't know where to start.
Learning stock market investing on your own can be overwhelming. There's so much information out there, and it's hard to know what's true and what's not.

Liberated Stock Trader Pro Investing Course
Our pro investing classes are the perfect way to learn stock investing. You will learn everything you need to know about financial analysis, charts, stock screening, and portfolio building so you can start building wealth today.
★ 16 Hours of Video Lessons + eBook ★
★ Complete Financial Analysis Lessons ★
★ 6 Proven Investing Strategies ★
★ Professional Grade Stock Chart Analysis Classes ★