Home Investing in Stocks

Investing in Stocks

Important lessons covering how to invest in stocks, and what other investment options you have, including Funds, ETFs Cash, Forex, and Bonds.

P/E Ratio: Use the Price to Earnings Ratio Like a Pro...

The Price to Earnings Ratio is a commonly misunderstood calculation for determining a company's relative value. The PE Ratio is only useful for comparing companies in the same industry with similar business models. It should not be used to compare radically different businesses.

Day & Swing Trading vs. Growth & Value Investing Explained.

Day and swing trading uses technical chart analysis to trade short-term price moves, whereas growth and value investing use long-term fundamental financial analysis. The tools and strategies used for these types of trading are completely different.

Earnings Per Share: EPS Growth & Acceleration In Investing

EPS or earnings per share is a measure of profitability. It tells investors how much profit a company makes for each share of its stock. The higher the EPS, the more profitable the company is.

How Much Money Can You Make in Stocks & Investments?

Our research using 30 years of data reveals the realistic earning potential across multiple assets. Investing in gold, bonds, growth stocks, real estate, or index funds can yield annual returns ranging between 5% and 20%.

Keynes vs. Hayek: World Changing Economists

The Keynes versus Hayek debate is an electrifying clash among economists, one that continues to exert a profound influence on our world, even long after their departure.

5 Proven Ways To Find The Best Cheap Stocks to Buy...

The best way to find cheap stocks is by using future earnings, asset valuation, discounted cash flow, fair value, and the margin of safety. Do not look at stock price alone to assess if a stock is undervalued; stock price is only useful in combination with other criteria.

What is CANSLIM Investing & Does It Work? I Test It!

CANSLIM is an active investment strategy that utilizes specific screening criteria such as earnings, market leadership, product innovation, institutional ownership, and stock price trends. These key criteria play a vital role in the process of stock selection.

What is a Stock Split and How to Trade It?

In a stock split, a company divides its existing shares into multiple shares to increase liquidity. A reverse stock split combines several shares into one to reduce outstanding shares.

A Smart Investors Guide to Reading Balance Sheets

To read a balance sheet effectively, start by focusing on three main sections: assets, liabilities, and equity. Assets represent what the company owns, liabilities show what the company owes, and equity reflects its net worth.

How to Read the Income Statement Like a Pro Investor

Investors use the income statement to understand a company's key metrics, revenue, expenses, profit, and operating costs. It is one of the most important documents investors use to understand a company's financial performance.

How to Calculate Dividend Yield & Triple Your Profits

To calculate dividend yield, divide the stock's annual dividend per share by the stock's current market price. The dividend yield increases as share prices drop, so to triple your yields, buy stock price panic crashes.

Finviz Stock Screener Review 2024: Free vs. Elite Tested

Our Finviz review testing reveals an effective free stock screener, fast market heatmaps, and stock chart pattern recognition. Finviz Elite includes real-time data, interactive charts, and backtesting for a competitive price.

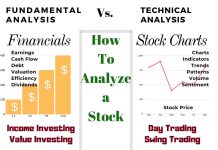
How To Analyze Stocks with Fundamental & Technical Analysis

There are two ways to analyze stocks. Fundamental analysis, which evaluates criteria such as PE ratio, earnings, and cash flow. Technical analysis, which involves studying charts, stock prices, volume, and indicators.

Cash on Hand Explained: Cash is King for Businesses

Cash on Hand is a financial metric indicating the amount of liquid capital available to an individual or business. For businesses, it includes physical currency, funds in bank accounts, and liquid assets readily convertible to cash.

How to Calculate Intrinsic/Fair Value of Stocks + Excel Calculator

To calculate the intrinsic value of a stock, estimate a company's future cash flow, discount it by the compounded inflation rate, and divide the result by the number of shares outstanding. The result is a stock's fair value. 

Debt-to-Capital Ratio: Understanding Financial Leverage

The debt-to-capital ratio measures a company's financial stability and leverage by comparing its total debt to its capital base, including debt and equity. It provides insight into what proportion of a company's operations is financed by debt versus shareholders' equity.

Creating the Best Dividend Stock Screener: 4 Strategies & Criteria

Our research shows you how to create the best dividend stock screener; you must decide on a high-yield, safe, or dividend growth strategy. Next, choose our tested criteria for your screener, like payout ratio, yield, and coverage.

How Financial Leverage Works! Using Debt to Amplify Returns

Financial leverage refers to using borrowed funds to increase the potential return on investment. It magnifies potential gains and losses, vital to a company's capital structure.

How to Read Financial Statements for New Investors

The three main types of financial statements are the balance sheet, income statement, and cash flow statement. Each one provides a different perspective on a company's finances.

Payout Ratio: Understanding Dividend Income Sustainability

The payout ratio, also known as the dividend payout ratio, is a critical financial metric that investors use to evaluate the sustainability of a company's dividend payments.

Our Best Training & Strategies

Liberated Stock Trader Pro: Learn Stock Market Investing

Learn stock market investing with the complete online stock trading course by Barry D. Moore, a certified financial analyst from the International Federation of Technical Analysts (IFTA).

ETF Investing Strategy: MOSES Improves Performance & Lowers Risk

The MOSES ETF investing strategy is a powerful suite of indicators meticulously backtested over 100 years. Designed to empower you to outperform the market, it equips you with the tools to navigate major stock market crashes and unlock greater investing performance.

Our LST Strategy Beat the Stock Market’s S&P 500 By 102%...

Decades of research and testing unveiled the Liberated Stock Trader Beat the Market System. Our 9-year, backtested, and proven strategy targets 35 financially healthy high-growth stocks, producing a track record of beating the S&P 500 by 102%.