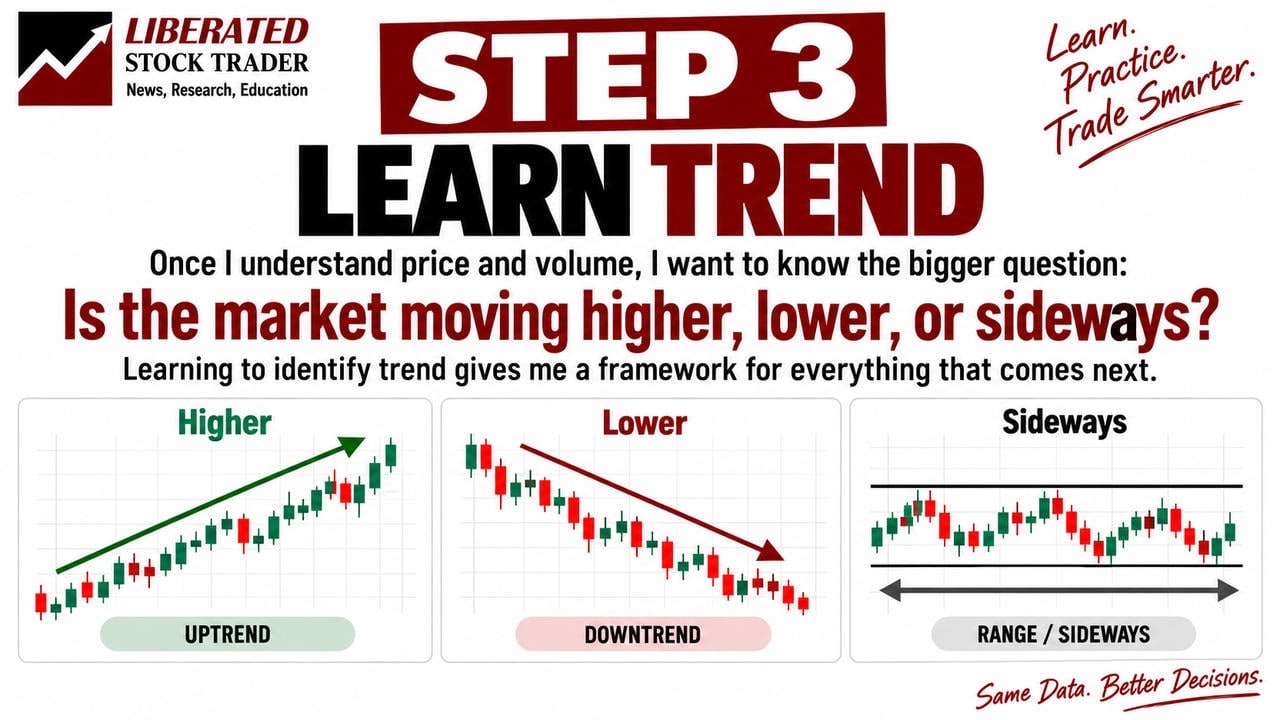
If I had to learn to trade from scratch again, the third thing I would focus on is identifying stock market trends.
Not predicting where a stock will go tomorrow. Not searching for the perfect indicator.
Just learning to recognize whether price is generally moving higher, lower, or sideways.
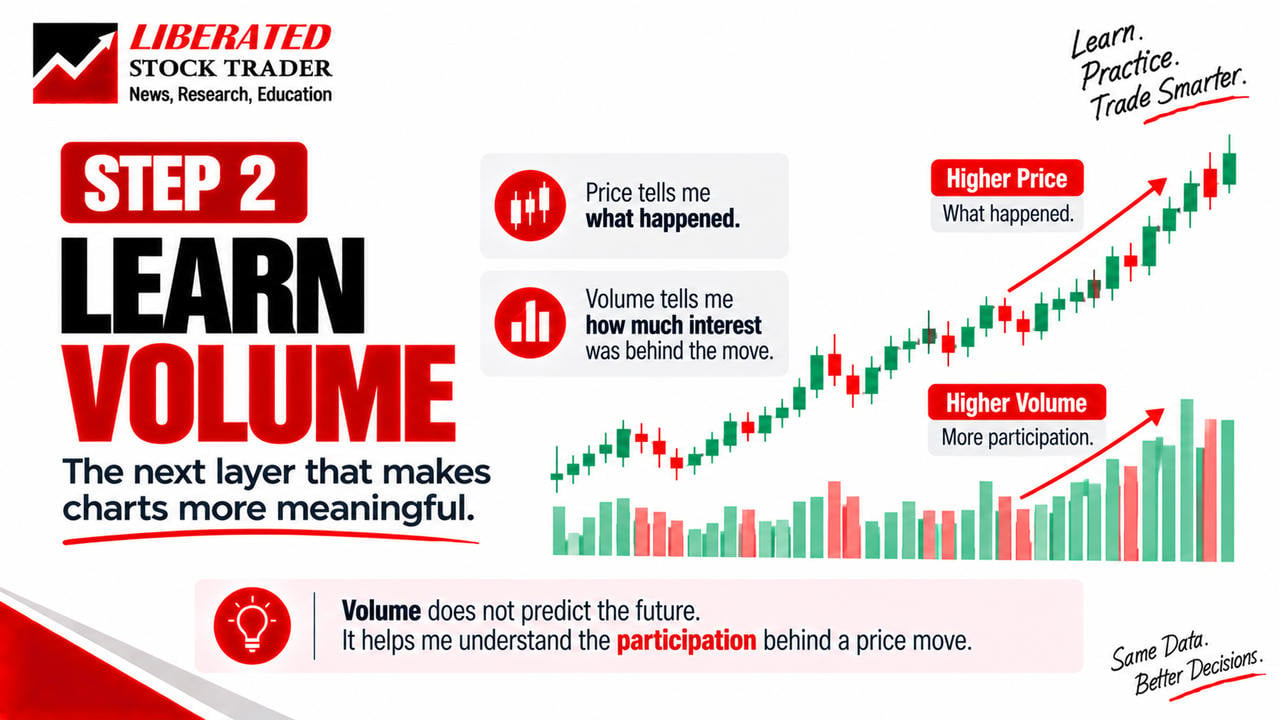
This is step 3 in my 8-step guide to learning stock trading from scratch. In Step 1, we learn to read price action. In Step 2, I added volume to understand trading activity.
Now I want to understand the market’s direction.
If I cannot recognize the trend on a clean stock chart, adding five indicators probably will not help me.
So I would begin with the price structure itself.
Step 3: Price Trend Video Guide
What Is a Trend in Stock Trading?
A trend describes the general direction of a stock’s price over a particular period.
Instead of looking at whether the last candle was green or red, I examine how prices have moved over a series of trading sessions.
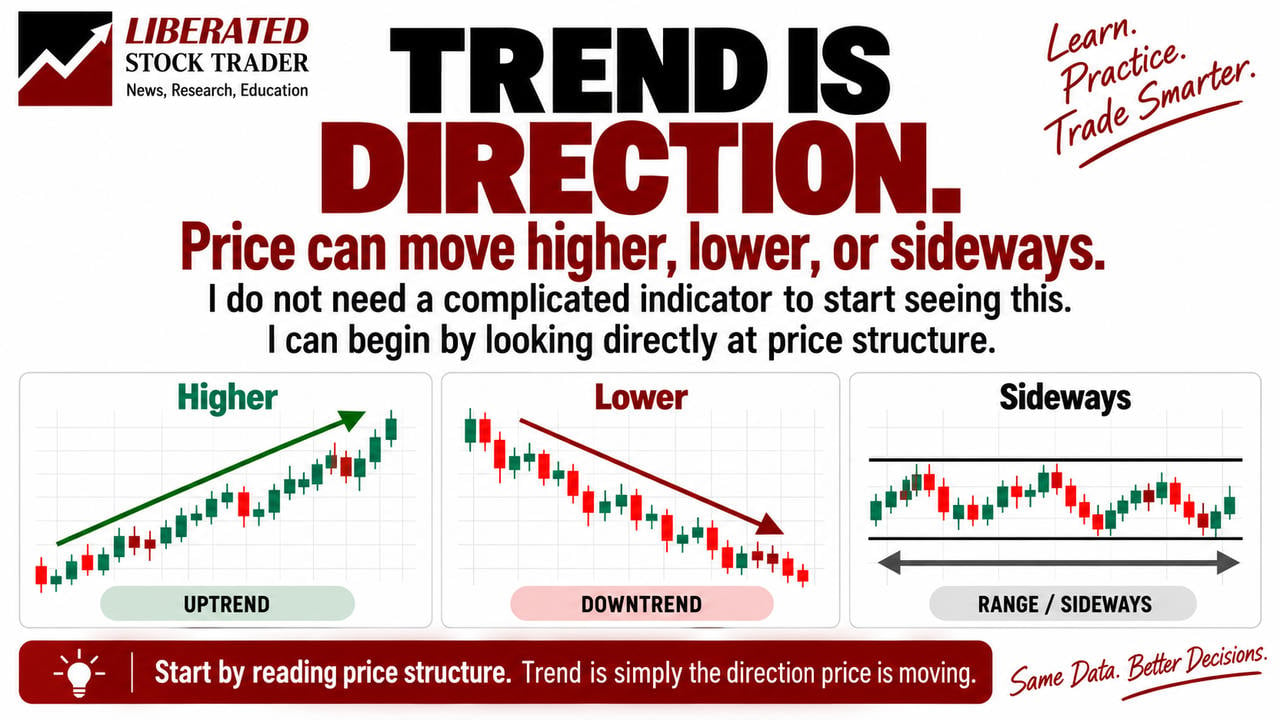
There are three main market conditions:
| Market condition | Price behavior | What I look for |
|---|---|---|
| Uptrend | Price generally moves higher | Higher highs and higher lows |
| Downtrend | Price generally moves lower | Lower highs and lower lows |
| Sideways market | Price moves within a range | Similar highs and lows without consistent direction |
These distinctions are fundamental to technical analysis.
Why do they matter?
Because different trading strategies behave differently depending on the market environment.
A trend-following strategy might work during sustained price advances but struggle when prices move sideways.
A breakout strategy might repeatedly generate false signals inside a choppy trading range.
Before I think about a strategy, I want to understand the conditions under which it would operate.
How to Identify an Uptrend Using Higher Highs and Higher Lows
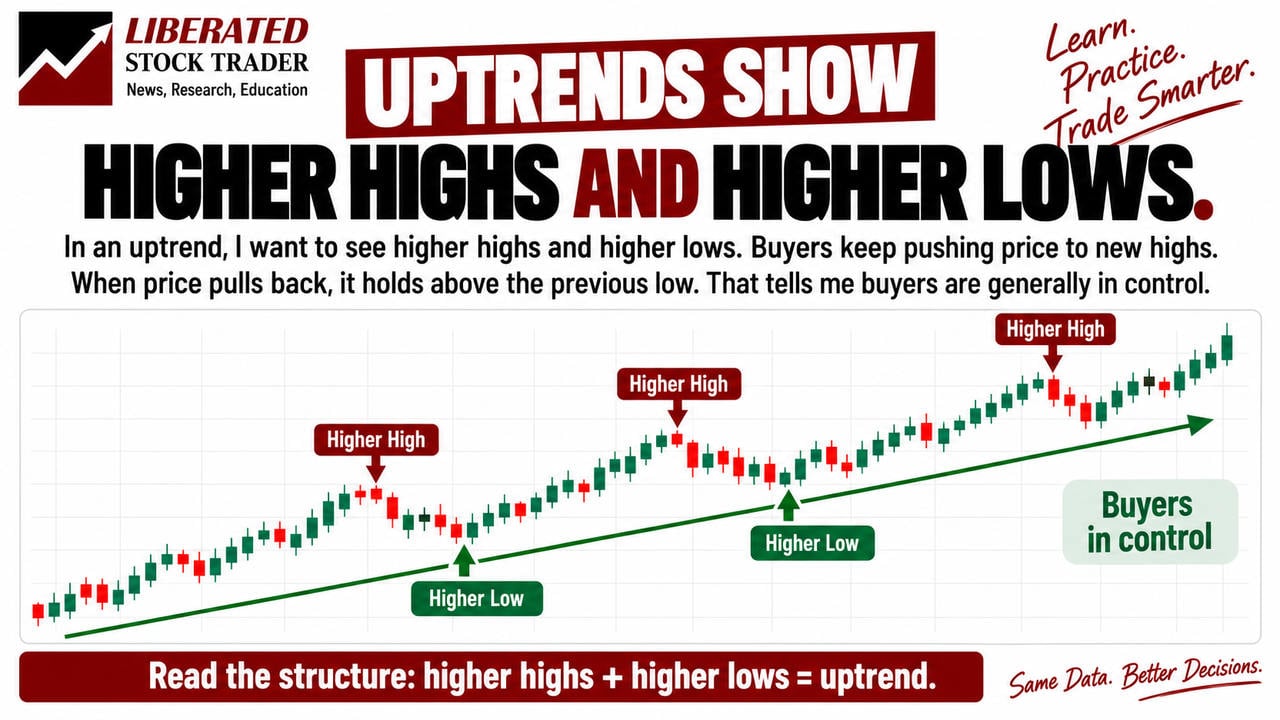
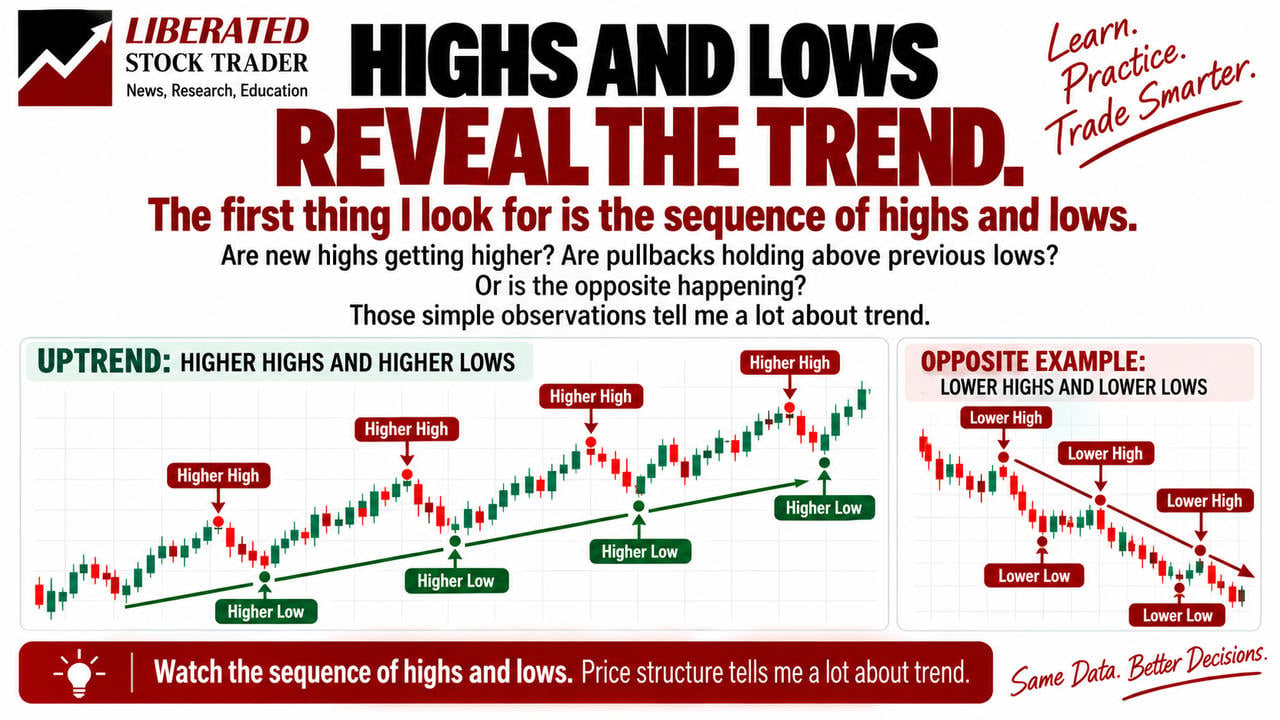
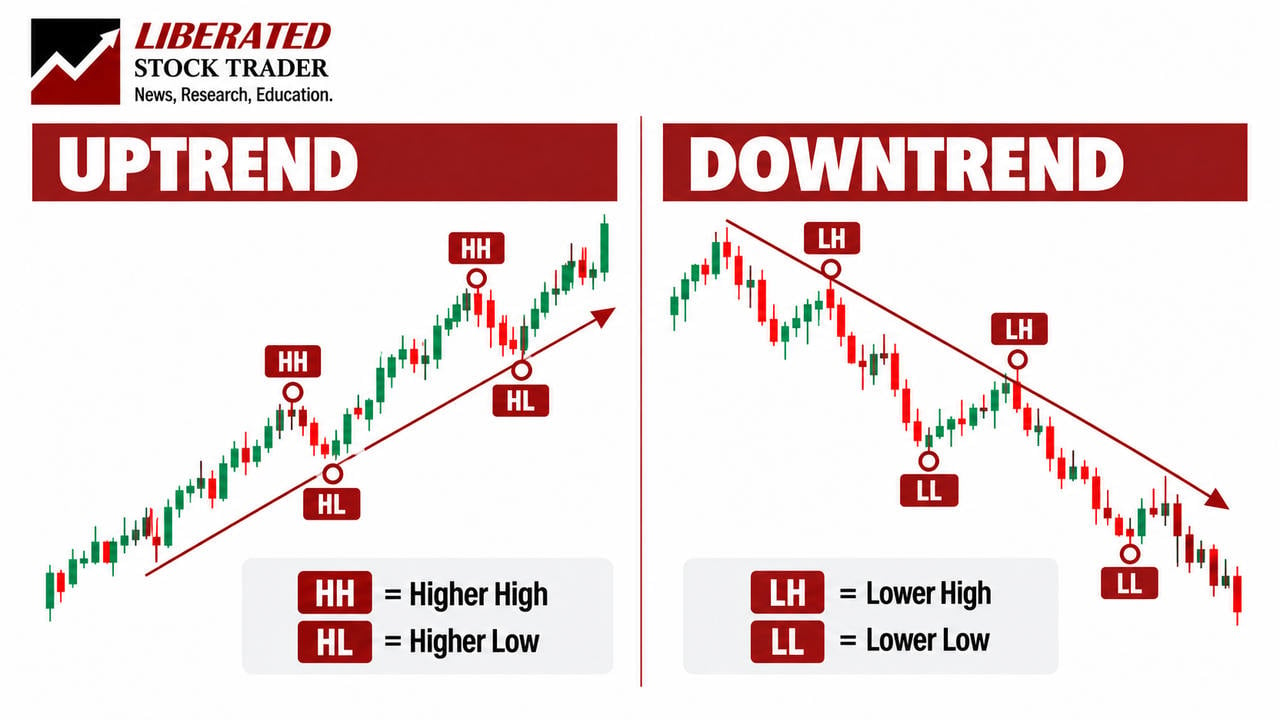
An uptrend is characterized by a sequence of higher highs and higher lows.
That sounds technical, but the concept is straightforward.
Imagine a stock rises from $50 to $60.
It then pulls back to $55 before climbing to $65.
After another pullback to $60, it advances to $70.
Notice what happened.
Each rally reached a higher price than the previous rally. Each pullback also stopped at a higher level than the previous pullback.
That creates the familiar stair-step appearance of an uptrend.
What Are Higher Highs?
A higher high occurs when the latest meaningful price peak is above the previous peak.
In my example, the stock moved from a peak of $60 to $65, then to $70.
What Are Higher Lows?
A higher low occurs when a pullback stops above the previous meaningful low.
Instead of falling back to $50, the stock found support around $55, then $60.
Together, these patterns show that buyers have been willing to trade at progressively higher prices.
I would not assume the trend will continue forever.
But I can objectively describe the existing price structure.
How to Recognize a Downtrend Using Lower Highs and Lower Lows
A downtrend is the opposite.
Instead of making higher highs and higher lows, price generally forms lower highs and lower lows.
Imagine a stock falls from $100 to $90.
It rebounds to $95 but cannot recover to its previous $100 high.
Then it falls to $85 and rebounds only to $90.
The structure is deteriorating.
Each significant rally is stopping below the previous rally, while each decline reaches a new low.
That creates a descending staircase.
I would use the same two observations:
- Lower highs: Each meaningful rally peaks below the previous peak.
- Lower lows: Each meaningful decline falls below the previous trough.
This is particularly useful because a stock can have several green candles while remaining firmly in a downtrend.
One strong day does not automatically mean the trend has reversed.
I need to examine the wider sequence of price movements.
How to Identify a Sideways Market or Trading Range
Not every stock is trending.
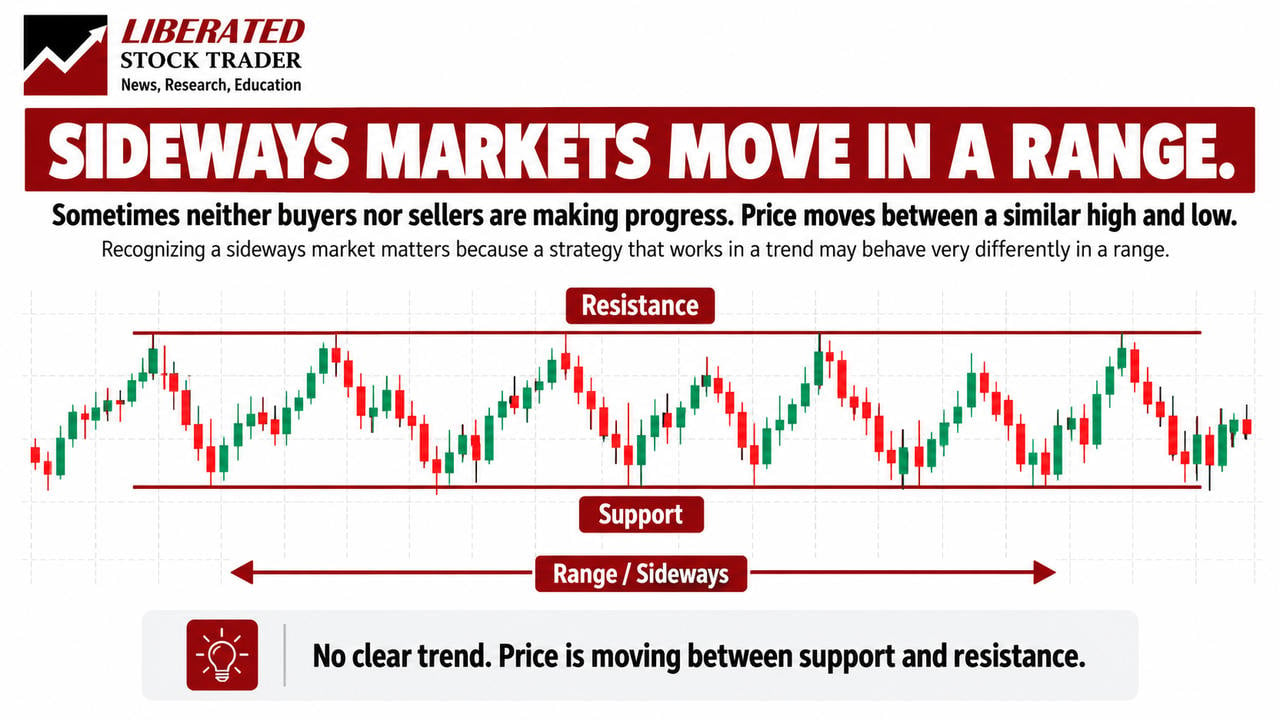
Sometimes prices move sideways, repeatedly rising and falling within a relatively narrow range.
I call this a sideways market, or trading range.
For example, a stock might spend several weeks moving between $90 and $100.
It rises toward $100, falls toward $90, and repeats the process without establishing a consistent series of higher highs or lower lows.
There is no sustained directional movement.
This matters because a trading strategy designed for strong trends may perform poorly in a sideways market.
I might see frequent false breakouts, reversals, and price movements that quickly lose momentum.
One of the most useful things I can learn as a beginner is recognizing when there is no clear trend.
I do not need to force every chart into an uptrend or downtrend.
Sometimes the correct description is simply that the market is consolidating.
Why Pullbacks Are Normal in an Uptrend
Here is something I would remind myself repeatedly:
An uptrend does not mean price rises every day.
Even strong trends contain temporary declines.
Those declines are called pullbacks.
Suppose a stock climbs from $50 to $70, then falls to $64 before moving higher again.
That decline does not necessarily mean the uptrend has ended.
I would compare the latest pullback with the previous meaningful swing low.
If price remains above the earlier low, the larger uptrend structure may still be intact.
This is why I prefer reading a series of highs and lows rather than reacting to individual red candles.
Of course, a pullback can become the beginning of a much larger decline.
I cannot know that in advance.
What I can do is identify the price structure and watch whether it remains intact.
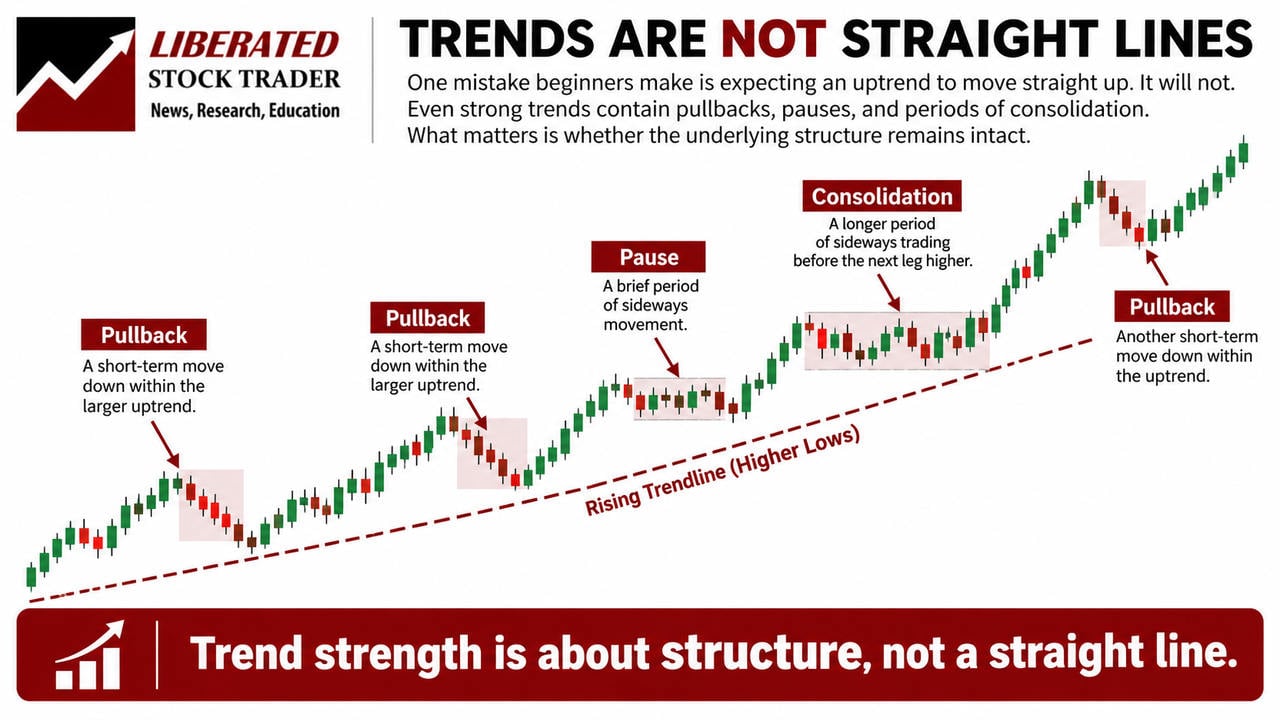
Healthy uptrend with a temporary pullback, showing price remaining above the previous higher low.
Can a Downtrend Have Strong Rallies?
Absolutely.
Just as uptrends contain pullbacks, downtrends can contain powerful upward rallies.
Imagine a stock falls from $100 to $70, then rebounds to $82.
That is a significant recovery.
But if the stock previously peaked at $90, the rebound to $82 is still a lower high.
The downtrend may remain intact.
I would be especially careful not to confuse the size of a rally with a confirmed trend reversal.
A strong upward move can occur within a broader decline.
The market structure helps me keep that movement in perspective.
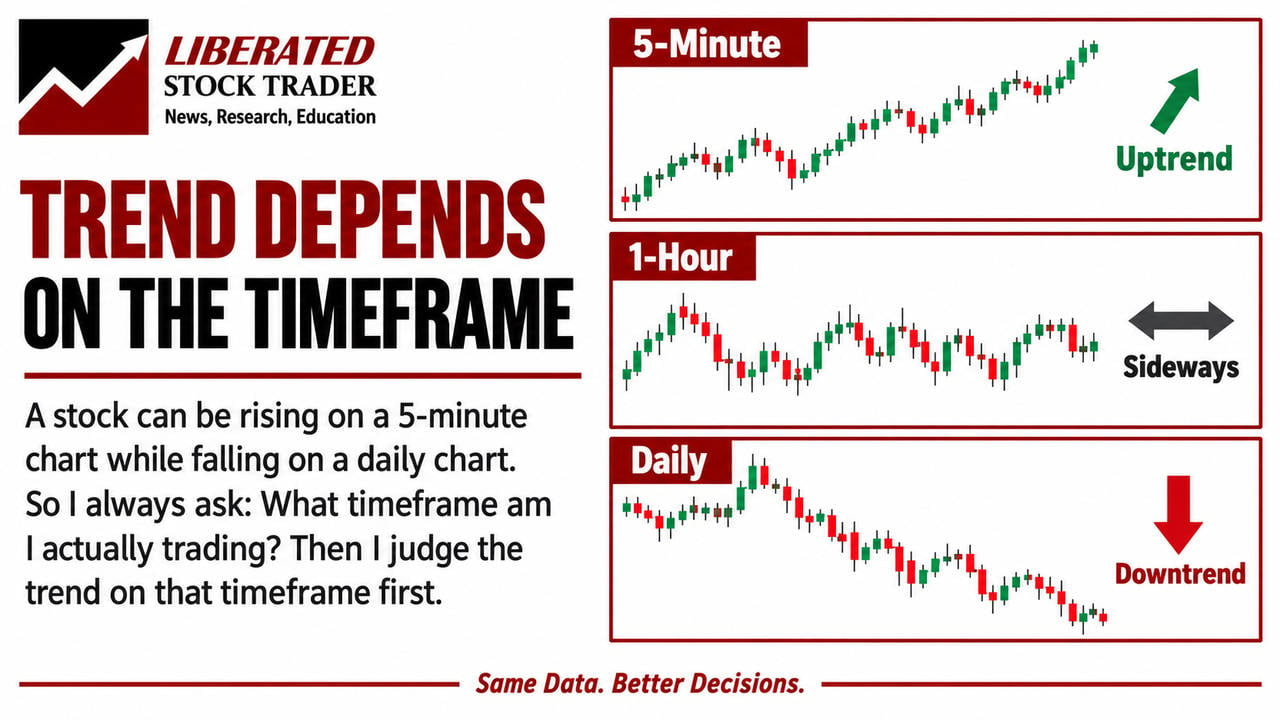
Why Stock Trends Change Across Different Timeframes
One of the more confusing aspects of trend analysis is that the same stock can appear to be rising and falling simultaneously.
How is that possible?
Because the trend depends on the timeframe I am examining.
For example, a stock might be in a long-term uptrend on its weekly chart.
But over the past few days, it may have entered a short-term decline.
Both observations can be correct.
The weekly chart shows the broader price structure, while the daily or hourly chart shows smaller movements within it.
Which Timeframe Would I Use?
That depends on how I intend to trade.
If I were a long-term investor, I would probably pay more attention to weekly and monthly charts.
If I were swing trading, daily and weekly charts could help me understand the broader environment.
For short-term trading, I might examine hourly or intraday charts.
But I would avoid switching between timeframes simply to find the trend I wanted to see.
I would choose a timeframe appropriate for my trading process and use it consistently.
For more chart-reading examples, see my complete guide to reading stock charts.
How to Use a Moving Average to Identify the Trend
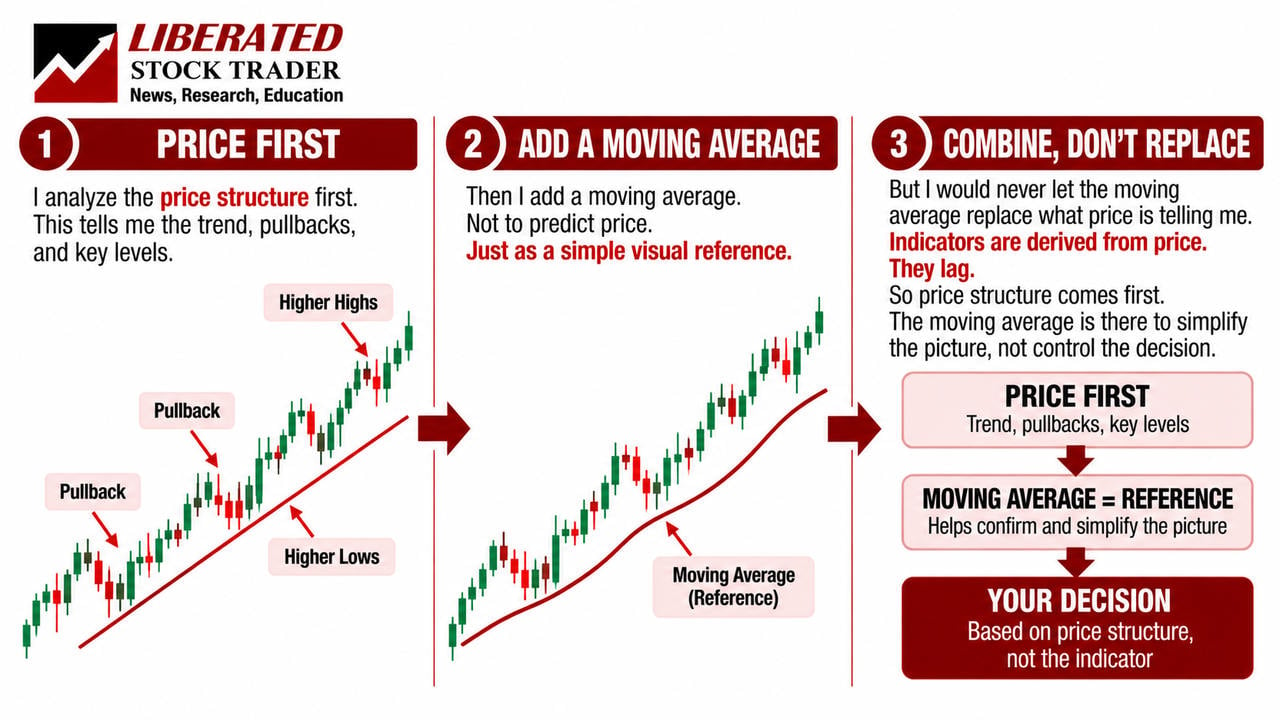
Only after I can recognize trends directly from price would I consider adding a moving average.
A moving average calculates the average price over a selected number of periods.
It smooths short-term fluctuations and can make the broader direction easier to visualize.
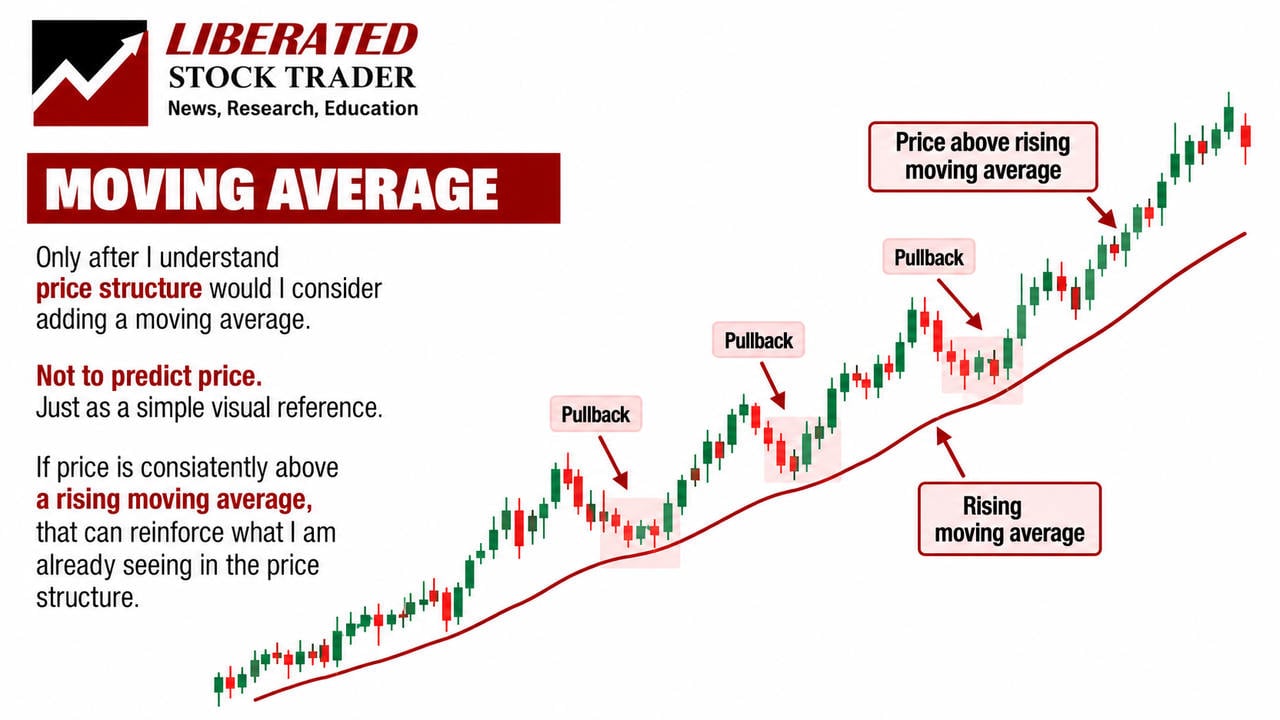
For example, a 50-day simple moving average uses the prices from the previous 50 trading days.
If the moving average is rising and the stock is generally trading above it, that can provide a visual reference for an upward trend.
If it is falling and the price is generally below it, that may reinforce the interpretation of a downward trend.
But I would not let the moving average make my decisions for me.
It is calculated from historical prices, so it can lag behind market changes.
And moving-average crossover strategies can generate repeated losing signals when the market moves sideways.
My independent moving-average backtesting research demonstrates why moving-average signals should not be treated as profitable trading strategies by default.
Would I Use Multiple Moving Averages?
Not initially.
I would start with one moving average, perhaps a 50-period SMA, purely as a visual reference.
My objective would be to compare the moving average with the higher highs, higher lows, and other price structures I can already identify.
For a more detailed explanation, see my simple moving average testing and strategy guide.
[IMAGE 9 — Clean price chart with a single 50-period moving average used to visualize the broader trend.]
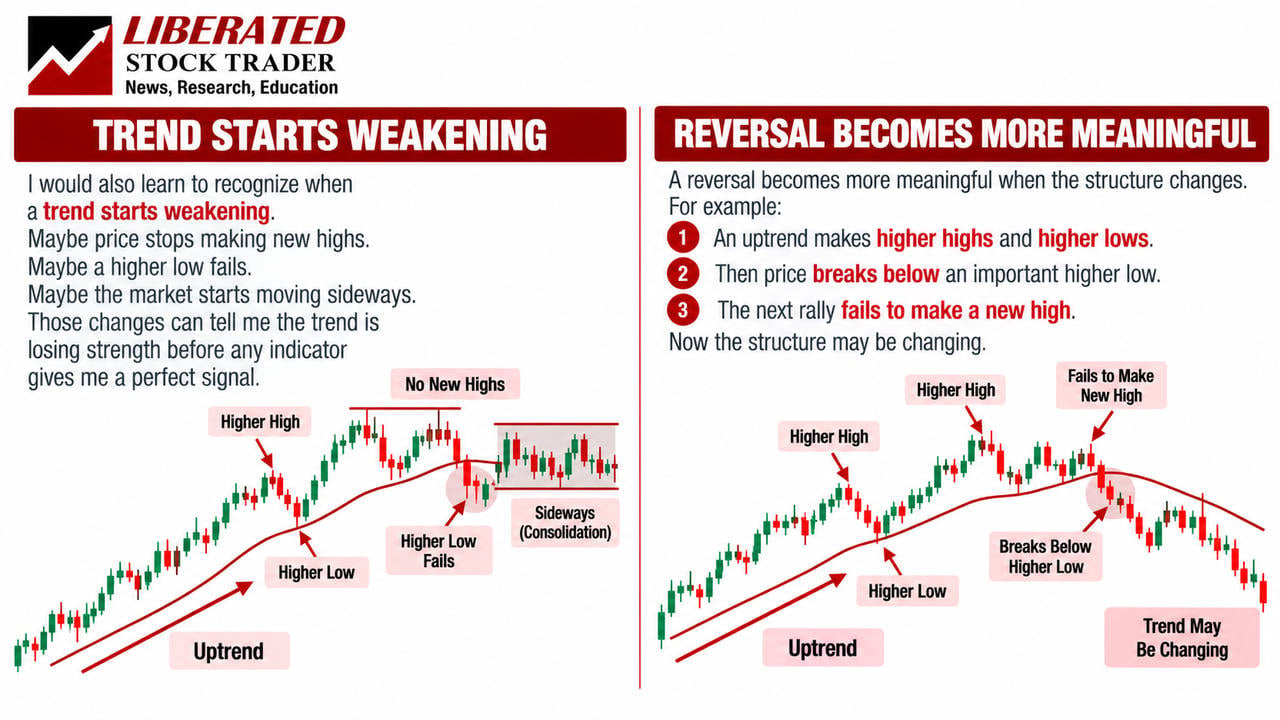
How to Tell When an Uptrend Is Weakening
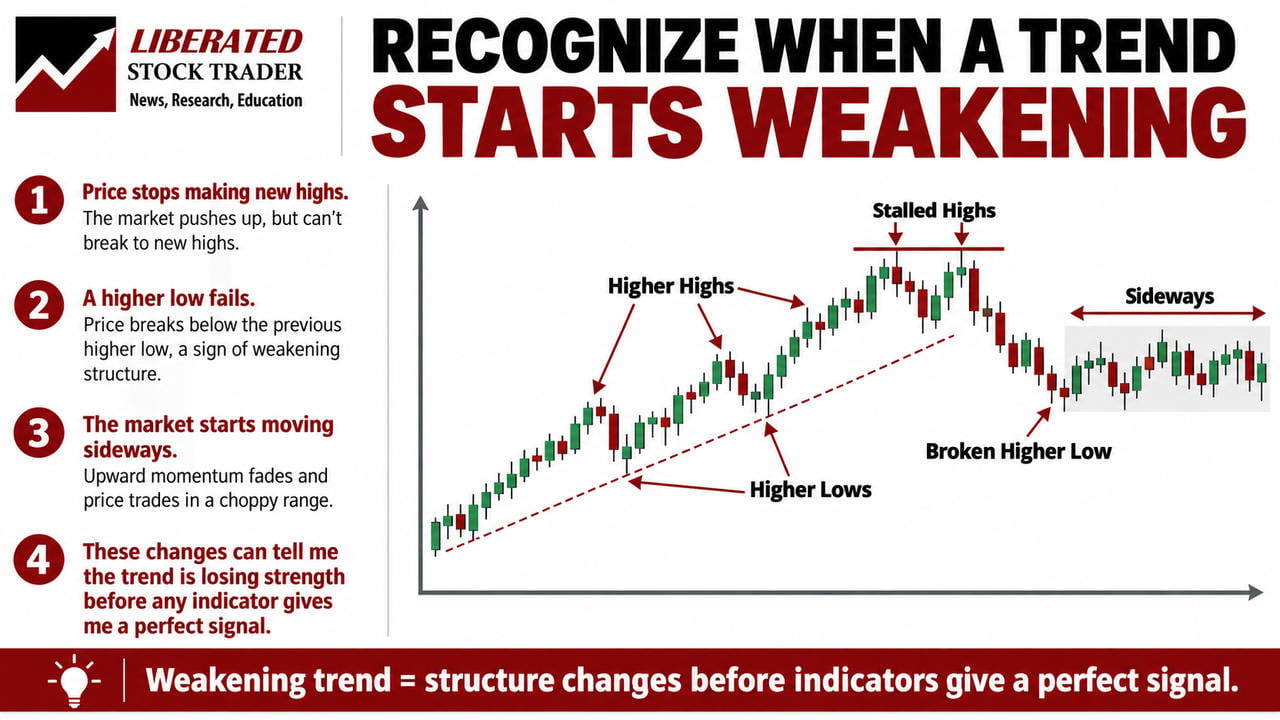
Once I can recognize an uptrend, the next thing I want to identify is when its structure begins changing.
Imagine a stock has been making consistent higher highs and higher lows.
Then something different happens.
The latest rally fails to exceed the previous high.
Instead of another higher high, price produces a lower high.
That does not prove the trend has ended, but it tells me upward progress has weakened.
Now suppose the stock also falls below its previous meaningful higher low.
The earlier pattern of rising highs and lows has been interrupted.
I would take that change seriously.
Not because it guarantees a decline, but because the conditions I used to identify the uptrend are no longer behaving as expected.
This is where reading price structure becomes more useful than simply saying a stock looks bullish.
I can identify exactly what changed.
[IMAGE 10 — Weakening uptrend showing a failed higher high, followed by price breaking below the previous higher low.]
What Does a Stock Trend Reversal Look Like?
A trend reversal occurs when the previous directional movement gives way to a new directional structure.
For example, a stock in a downtrend might stop making new lower lows.
It may then establish a higher low and move above a previous swing high.
Those developments suggest the earlier downtrend may be changing.
But a reversal is rarely as obvious in real time as it appears on a completed historical chart.
A stock might briefly move above a previous high and then fall again.
Or it might trade sideways for several weeks before establishing a new direction.
This is why I would avoid treating a single broken trendline or a single large candlestick as definitive proof of a reversal.
I would look for a sustained change in the pattern of highs and lows.
And I would remember that the confirmation often comes after part of the new move has already occurred.
For traders who want to study drawing diagonal trendlines, I have a separate guide explaining how to draw and interpret trendlines on stock charts.
Does Identifying a Trend Mean I Have a Trading Strategy?
No, and that distinction matters.
Being able to identify an uptrend does not tell me exactly when to buy.
It does not define my stop-loss, profit target, position size, or maximum acceptable risk.
It also does not prove that following the trend will be profitable.
For example, buying a stock simply because it is above its moving average can yield very different outcomes depending on the market, indicator settings, and exit rules.
Trend analysis gives me information about the market environment.
A trading strategy requires a specific set of rules, and those rules need to be tested.
That is why the order of this learning series is important.
I learn to recognize market conditions first.
I learn risk management and strategy development later.
And I backtest the strategy before trusting it with real money.
A Simple Exercise to Practice Identifying Stock Trends
If I were starting from scratch, I would practice trend identification on clean charts before adding advanced indicators.
I would open a daily stock chart and remove everything except the candlesticks.
Then I would ask five questions:
- Is price generally moving higher, lower, or sideways?
- Where are the most obvious swing highs and swing lows?
- Is the stock making higher highs and higher lows, or lower highs and lower lows?
- Are recent pullbacks maintaining the existing trend structure?
- Has anything happened that suggests the trend may be weakening?
I would repeat the exercise on at least 20 historical charts.
Some should show clear uptrends. Others should show downtrends, trading ranges, or changing market conditions.
I would mark the significant highs and lows and write a short description of each chart.
For example:
“The daily chart is in an uptrend. Price has made three higher highs and two higher lows. The latest pullback remains above the previous swing low.”
That description is far more useful to me than saying the chart looks good.
Where possible, I would hide the future candles and reveal them gradually.
That way, I am practicing with the information that would have been available at the time rather than judging the chart with hindsight.
After enough practice, I should be able to recognize the main trend without relying on a complicated indicator setup.
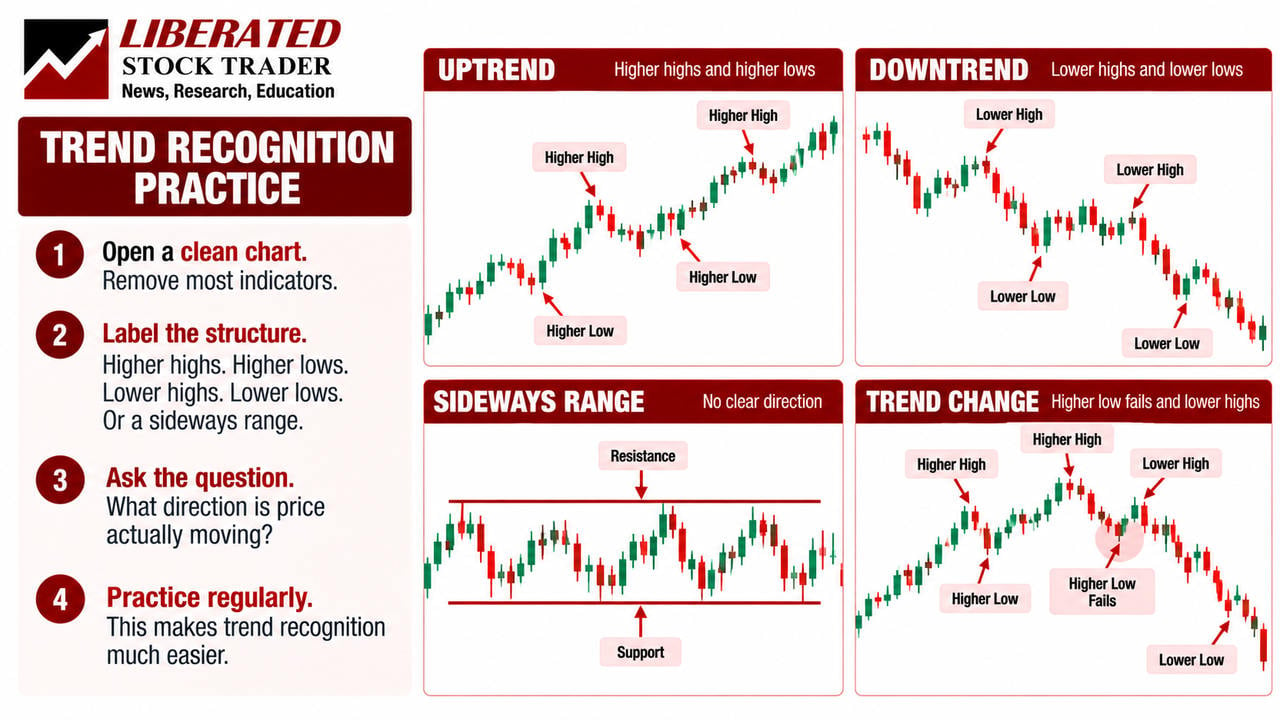
Beginner trend identification exercise with a clean stock chart, marked swing highs and lows, and a four-question checklist.
Step 3 Summary: Learn the Trend Before Adding Indicators
If I were learning trading again, Step 3 would be understanding trends.
Price gave me the foundation.
Volume added information about market activity.
And trend analysis gives me a way to describe the direction of that price movement.
The essential concepts I would want to recognize are straightforward:
- An uptrend produces higher highs and higher lows.
- A downtrend produces lower highs and lower lows.
- A sideways market moves without a consistent directional structure.
- Pullbacks are normal and do not automatically end an established trend.
- Timeframes matter because short-term and long-term trends can differ.
- Moving averages can help visualize a trend, but they do not replace price analysis.
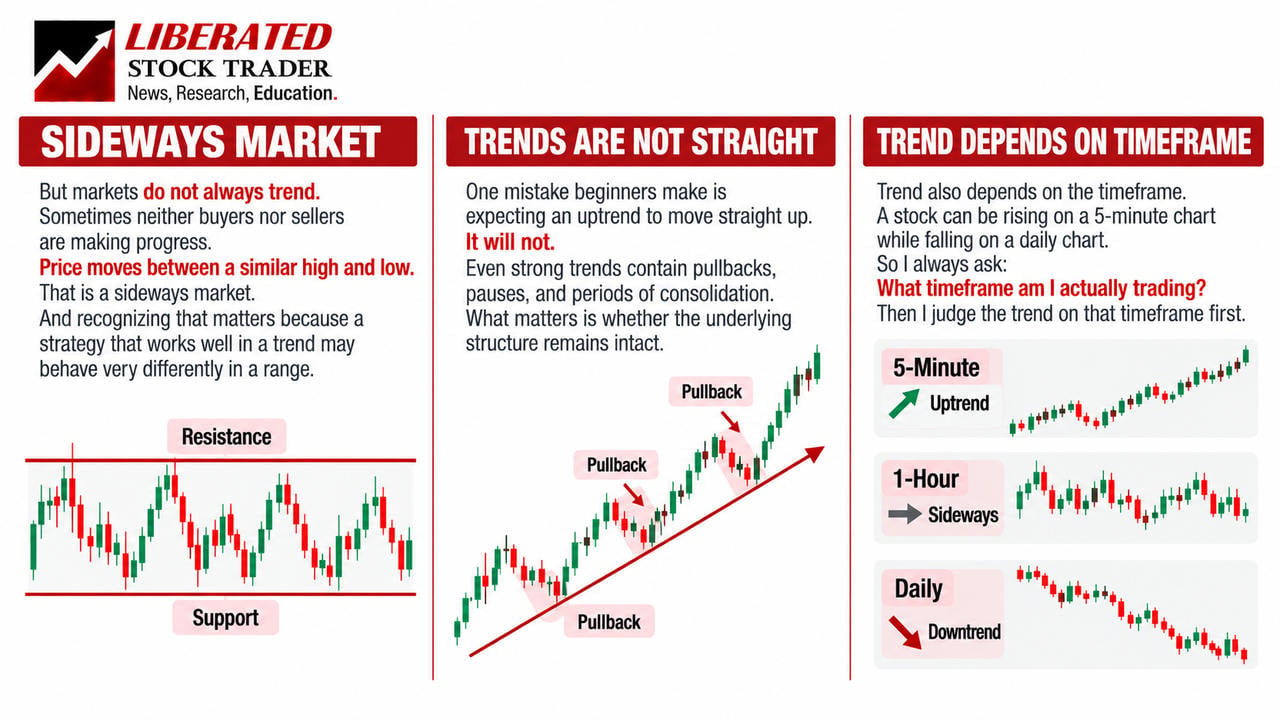
Most importantly, a trend describes the market’s behavior over a particular period. It does not guarantee what will happen next.
My goal is not to predict every price movement.
It is to understand the market environment before deciding how to trade it.
What Comes Next? Step 4: Support and Resistance
Now that I understand price, volume, and trend, the next question I want to answer is:
Where might the market react?
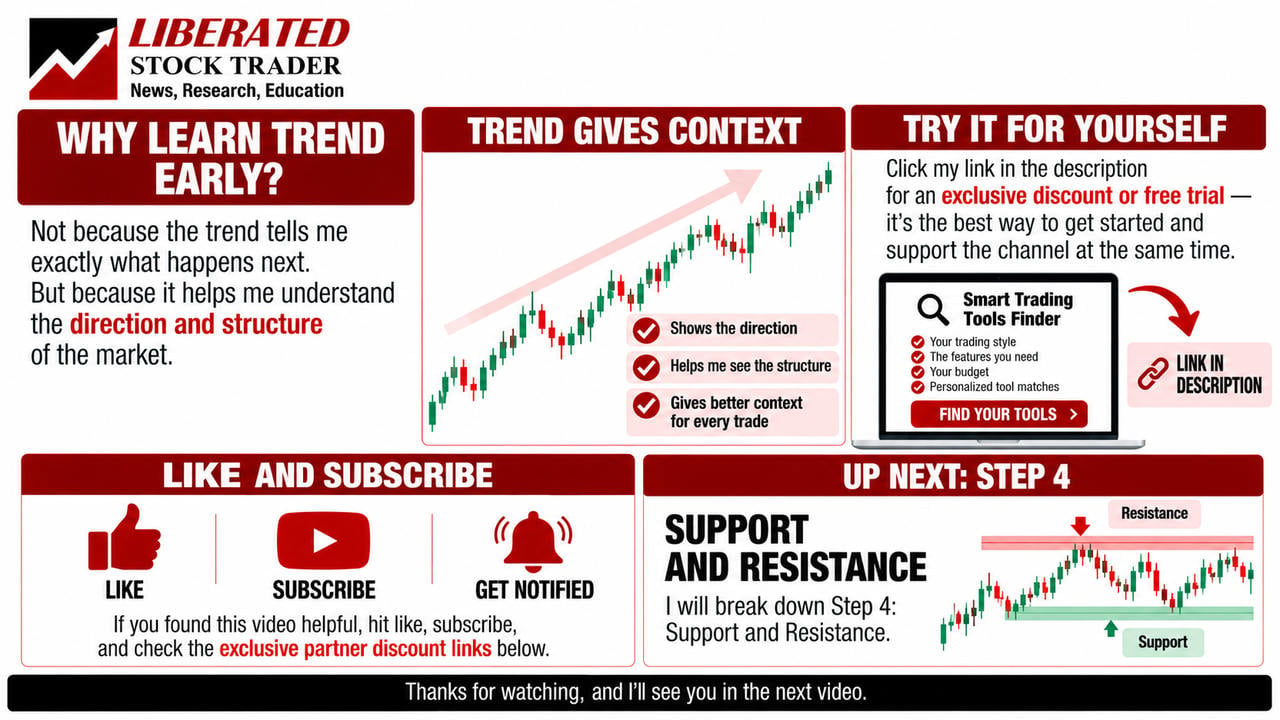
That brings me to support and resistance.
I would learn how previous swing highs and lows create areas where buyers and sellers have reacted.
I would also learn why these areas are better treated as zones rather than guaranteed turning points.
That is Step 4 in my Learning Trading From Scratch series.
If you are looking for charting software to practice these techniques, try my Smart Trading Tools Finder.
It helps you compare independently tested platforms according to your trading style, markets, budget, and required features. You can also explore available partner discounts and free trials.
My takeaway: Before I look for a trading signal, I want to understand whether the market is rising, falling, or moving sideways. Learning to recognize that structure gives me a foundation for everything that follows.
Coming Soon: Step 4 — Learn Support and Resistance Using Price Zones.