
If I had to learn trading from scratch again, the second thing I would study is trading volume.
In Step 1, I covered how to read price action: candlesticks, price acceleration, consolidation, and breakouts.
But price only tells me part of the story.
Two stocks can produce almost identical price breakouts, yet the trading activity behind those moves can be very different.
One might break out with a substantial increase in volume. The other might move through resistance with relatively little participation.
Would I treat those breakouts the same way? No.
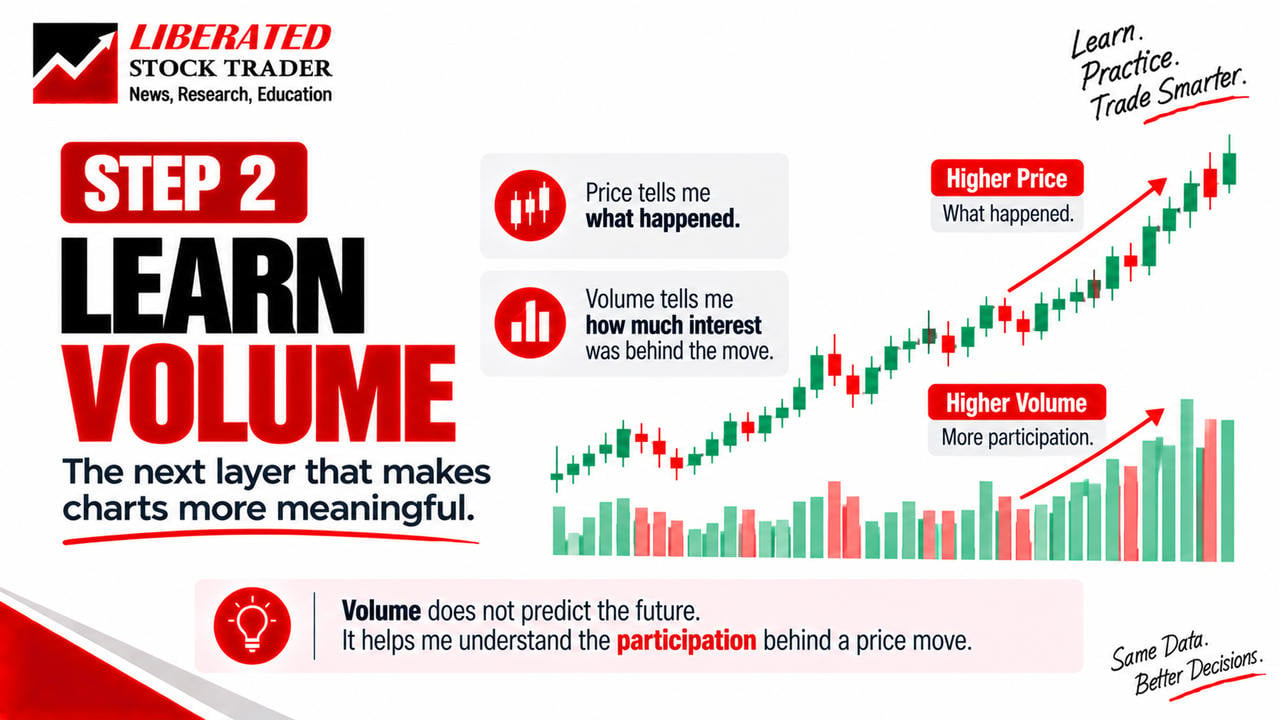
I want to understand not just where price is moving, but how much trading activity accompanies that movement.
That’s why I would learn volume before adding more indicators or building a trading strategy.
What Is Trading Volume in the Stock Market?
Trading volume measures the amount of a security traded during a particular period.
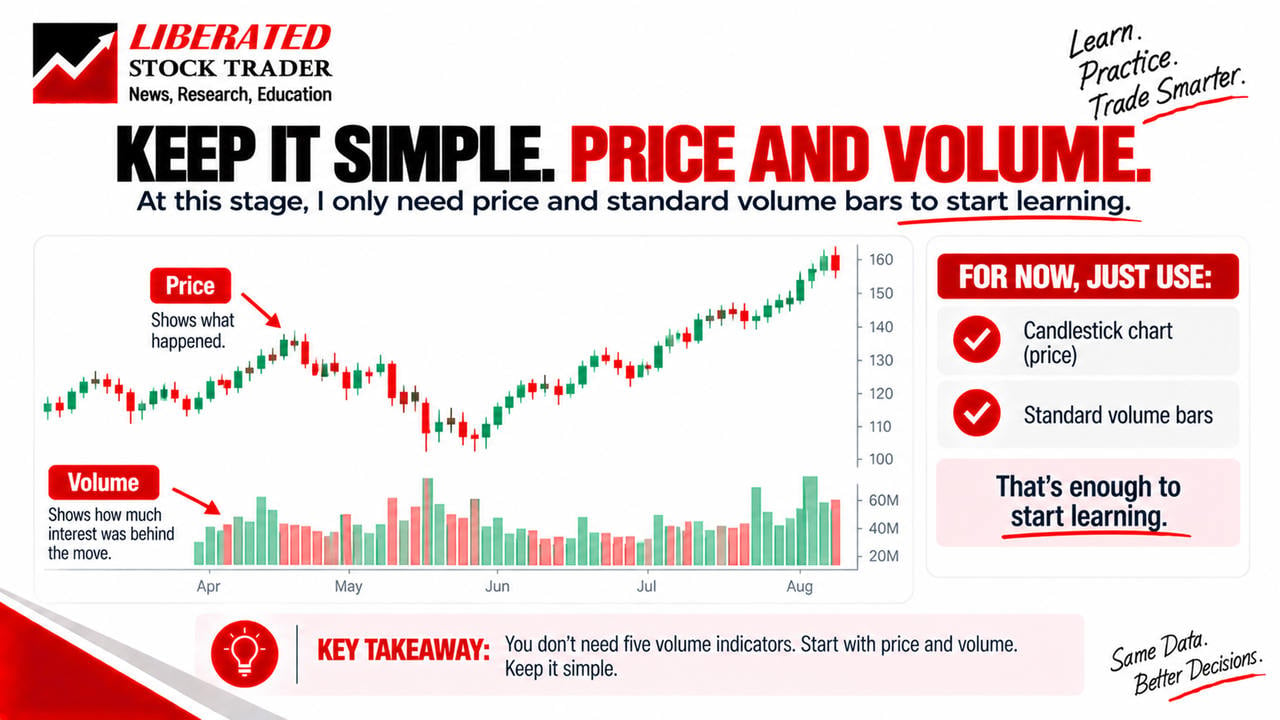
For stocks, volume generally represents the number of shares exchanged between buyers and sellers.
If a company has a trading volume of 5 million shares today, that means 5 million shares changed hands during the session.
It does not mean 5 million people bought shares.
One investor might trade thousands of shares, while another buys just ten.
Volume measures the quantity traded, not the number of individual market participants.
And every completed stock trade has both a buyer and a seller.
That last point is important because high volume does not mean buyers outnumber sellers.
High volume means a lot of trading activity occurred.
To understand its possible significance, I need to examine what price was doing at the same time.
Step 2 Trading Volume Guide
How to Read Volume Bars on a Stock Chart
Most stock charting platforms show trading volume as vertical bars beneath the price chart.
- On a daily chart, each volume bar represents one trading day.
- On a five-minute chart, each bar represents five minutes.
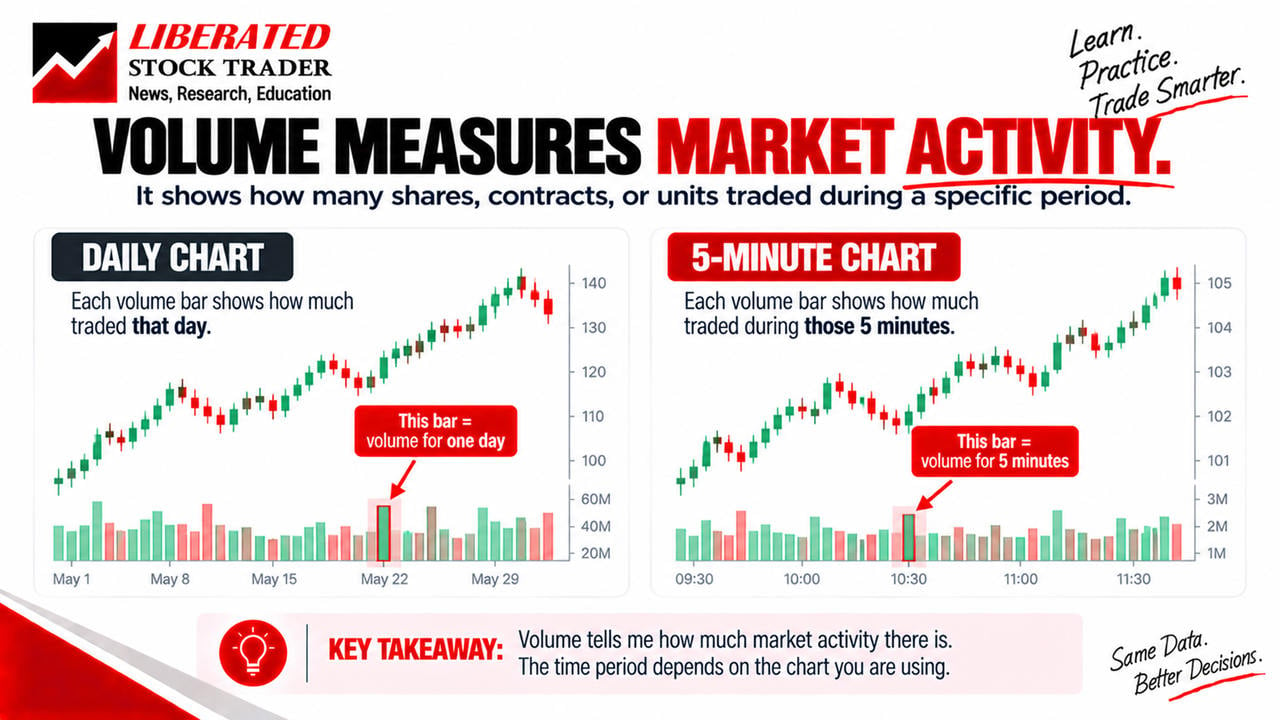
The taller the volume bar, the greater the trading activity during that period.
The shorter the bar, the less activity occurred.
Volume bars are often colored green or red, but the meaning of those colors depends on the platform’s settings.
Some charting systems color volume based on whether the candle closed above or below its open price. Others compare the close with the previous period.
I would always check that setting before interpreting the colors.
Initially, I would concentrate on the height of the bars.
My first question would be simple:
Is this more or less volume than the stock normally trades?
That is much more useful than memorizing arbitrary volume numbers.
Why High and Low Trading Volume Matter
A stock trading 10 million shares might sound extremely active.
But if it normally trades 20 million shares per day, today’s activity is actually relatively low.
Meanwhile, a smaller company trading 800,000 shares might be experiencing unusually high volume if it normally trades only 100,000.
This is why I compare volume with the stock’s own history.
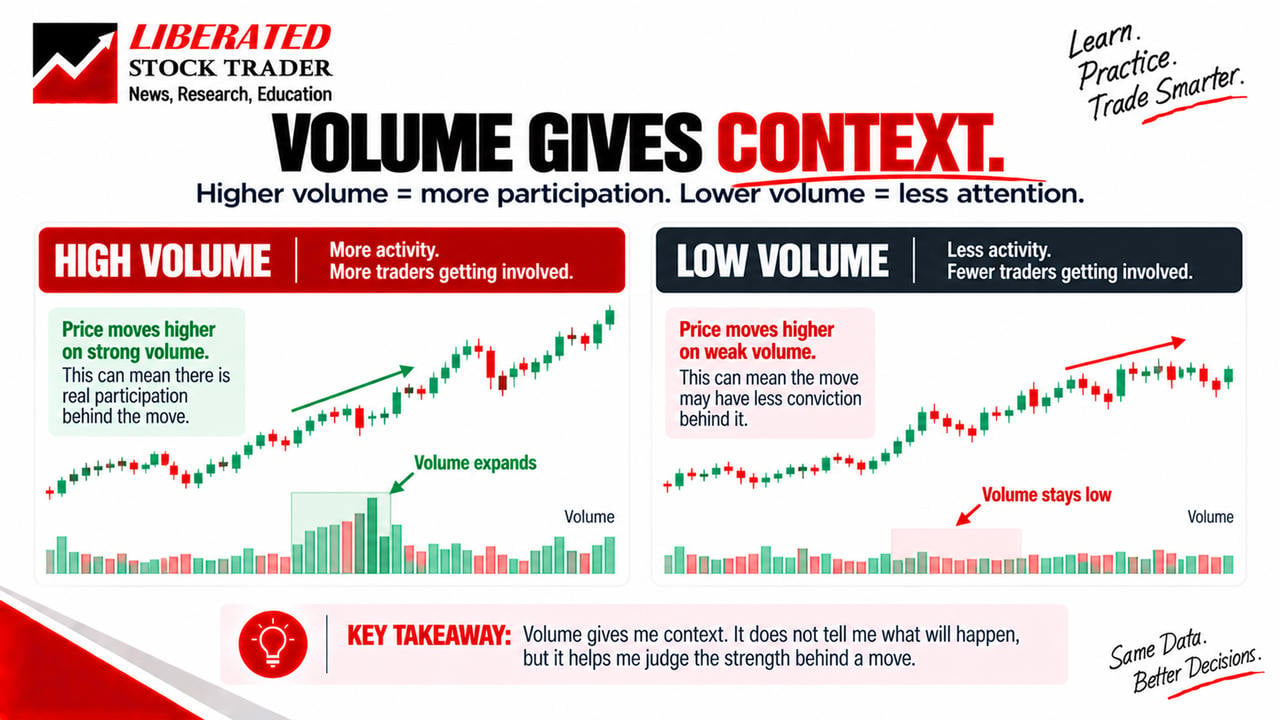
High Trading Volume
High volume means trading activity is elevated relative to the period being compared.
It might occur because of earnings announcements, major news, institutional trading, a technical breakout, or unusually strong investor interest.
But high volume alone does not tell me whether the stock is attractive.
Low Trading Volume
Low volume indicates relatively limited trading activity.
It can occur during quiet markets, consolidation periods, holidays, or sessions when traders are waiting for important information.
Low volume is not automatically bearish.
The useful question is how volume relates to price behavior.
For a broader technical explanation, see my complete guide to stock trading volume indicators.
How Price and Volume Work Together
This is where volume analysis becomes interesting.
I would not study volume in isolation.
Instead, I would ask what happened to the stock price when trading activity increased or decreased.
Here are four common combinations:
| Price movement | Volume behavior | Possible interpretation |
|---|---|---|
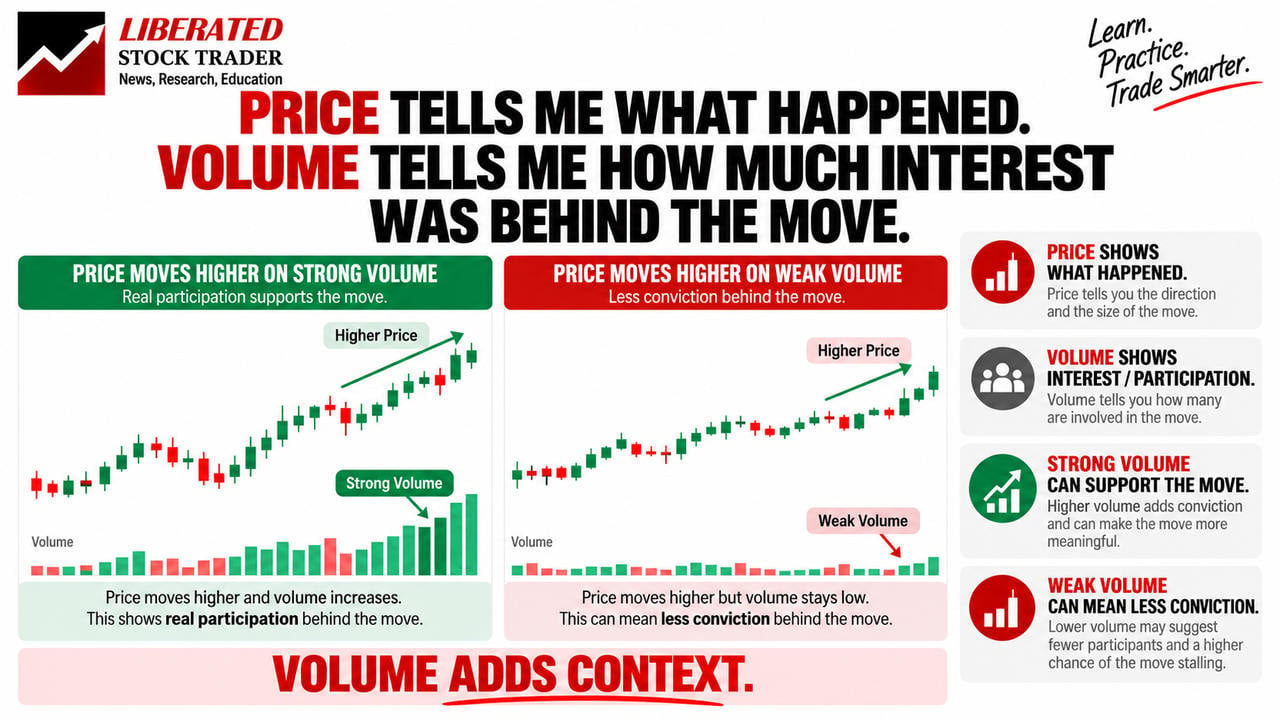
| Price rises | Volume increases | Stronger participation accompanies the advance |
| Price rises | Volume decreases | The advance has relatively less participation |
| Price falls | Volume increases | Strong trading activity accompanies the decline |
| Price falls | Volume decreases | The decline occurs with relatively less activity |
These are observations, not guaranteed trading signals.
For example, a stock can rise on low volume and continue rising.
A high-volume advance can also reverse sharply.
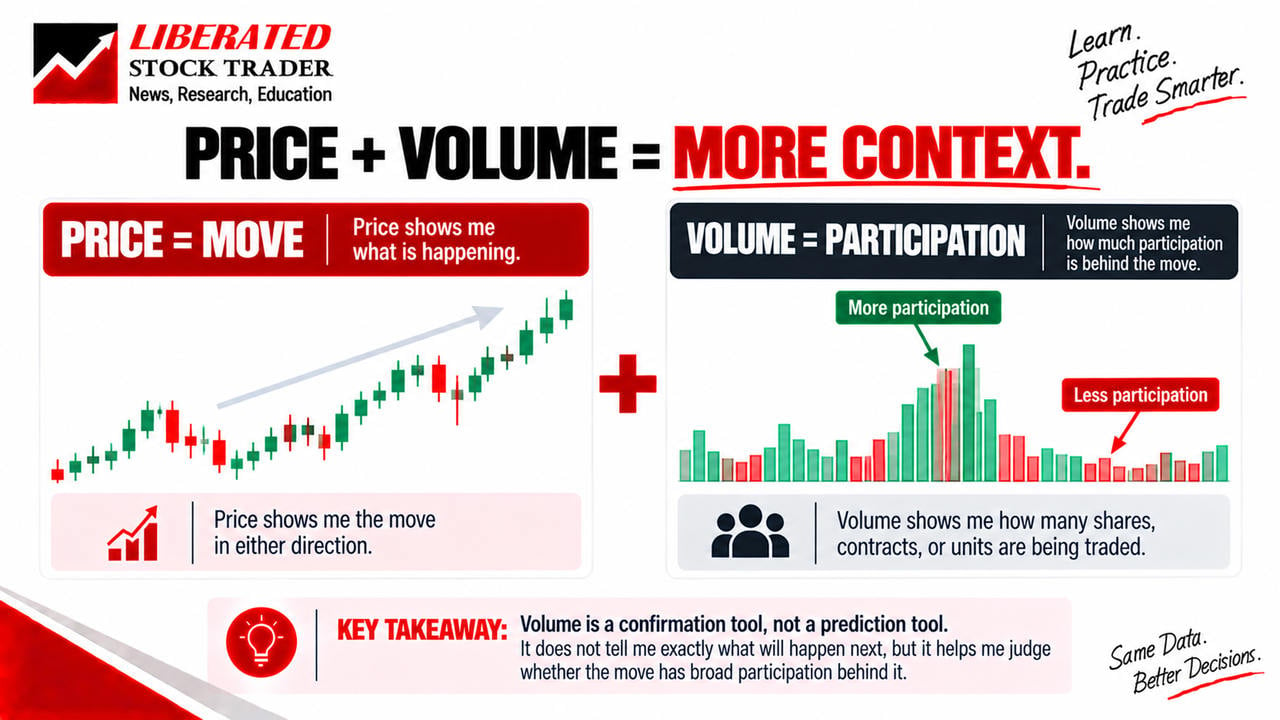
What I gain from volume is extra context.
Price tells me the direction of the move. Volume tells me how much activity accompanied it.
That relationship is what I would practice recognizing.
How Volume Helps Confirm a Price Breakout
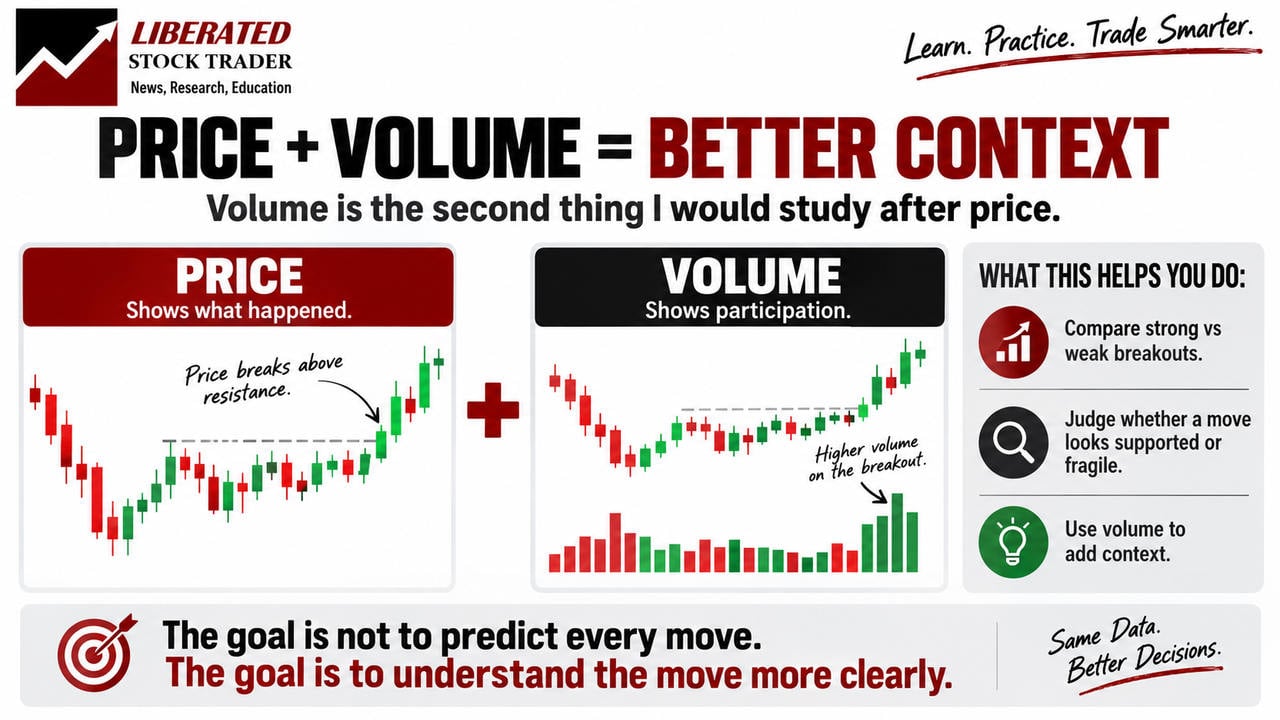
One of the most useful applications of trading volume is analyzing breakouts.
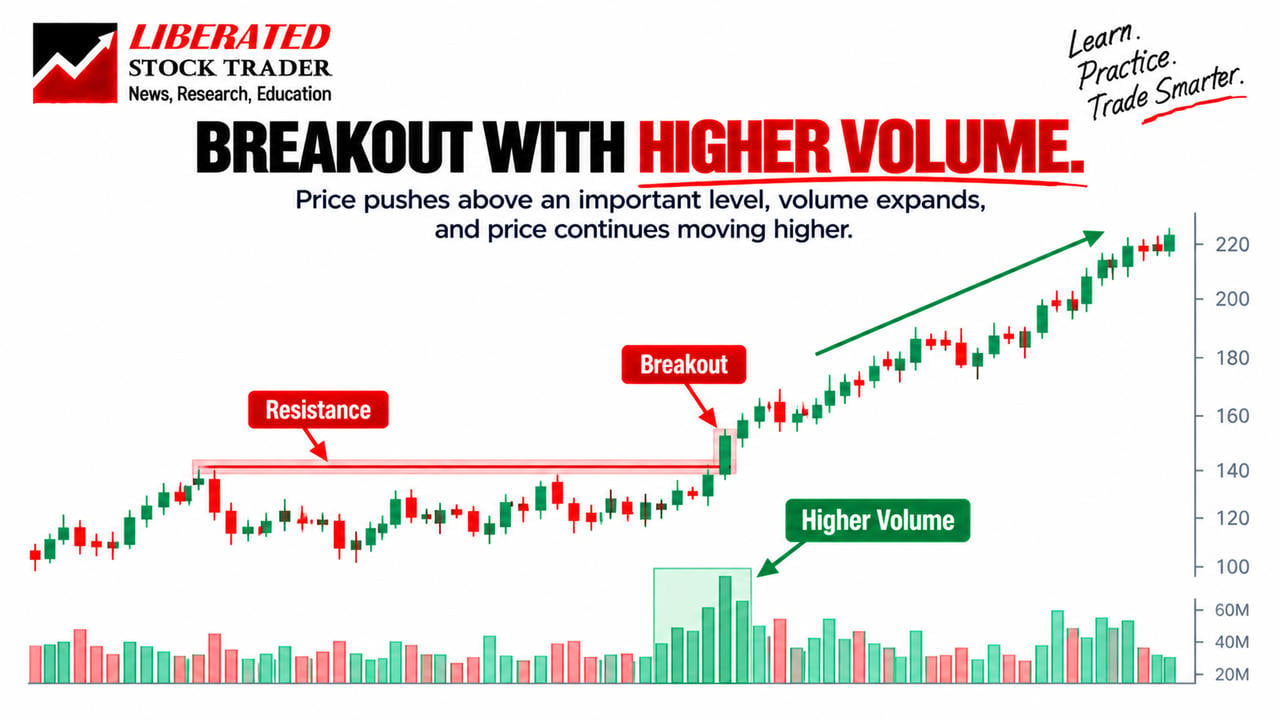
Imagine a stock has been trading between $90 and $100 for several weeks.
Each time price approaches $100, it struggles to move higher.
Then one day, the stock breaks above $100.
That is a price breakout.
But I would immediately look at the volume bars.
If the breakout occurs with substantially higher volume than previous sessions, I know it attracted unusually high trading activity.
That can strengthen the evidence that the breakout is significant.
However, it does not guarantee that price will continue higher.
Some high-volume breakouts fail.
I still need to observe what happens afterward.
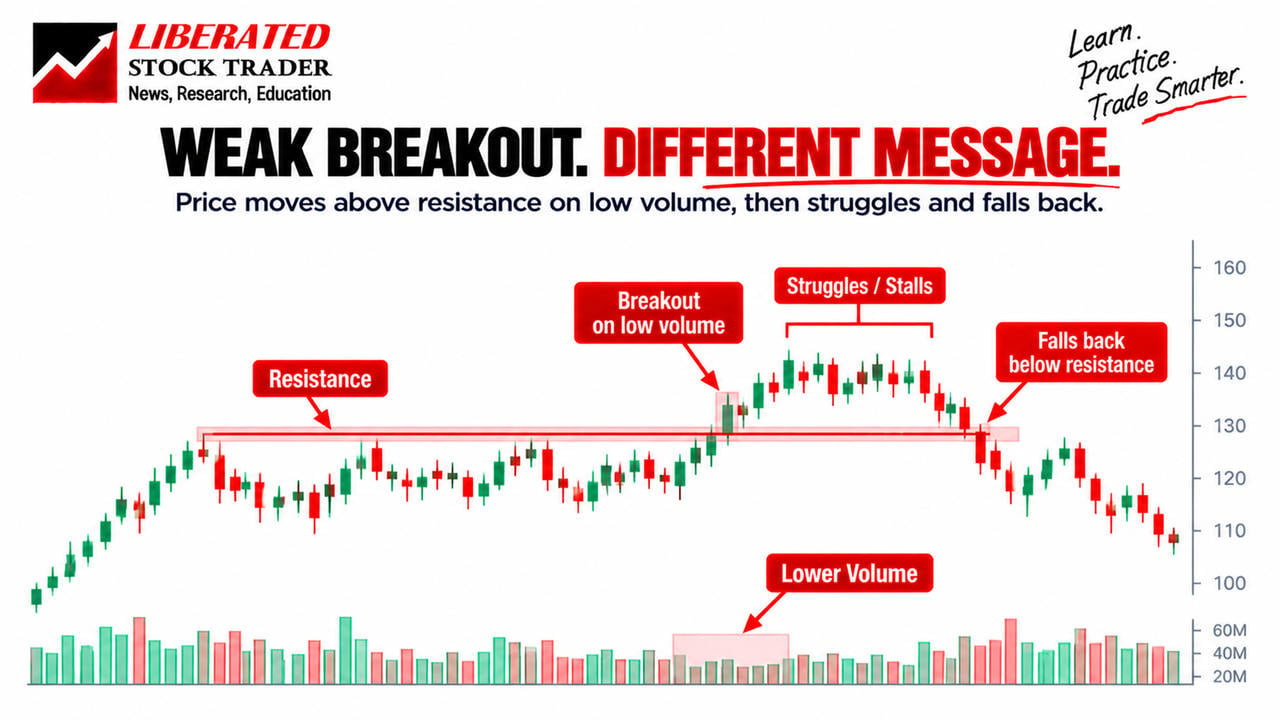
Low-Volume Breakouts: Why I Would Be More Cautious
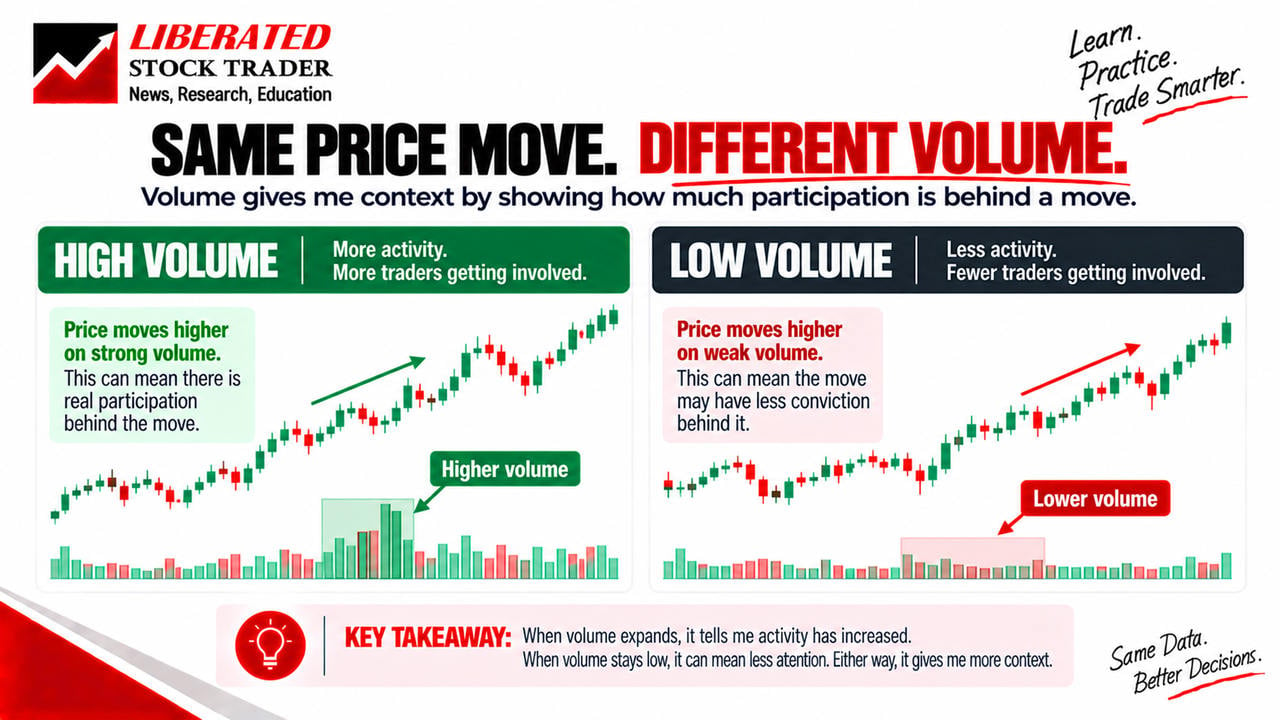
Now imagine the same $100 breakout, but this time trading volume is unusually low.
Price moves above resistance, but relatively little trading activity accompanies the move.
I would not automatically reject the breakout.
However, I would treat it differently from a breakout with strong volume participation.
The low-volume move gives me less evidence of broad trading interest.
I might look for additional confirmation, such as the stock holding above its previous resistance or continuing higher during subsequent sessions.
This is one reason I prefer studying price and volume together.
Two charts can look almost identical at first glance, but the volume tells me that the circumstances are different.
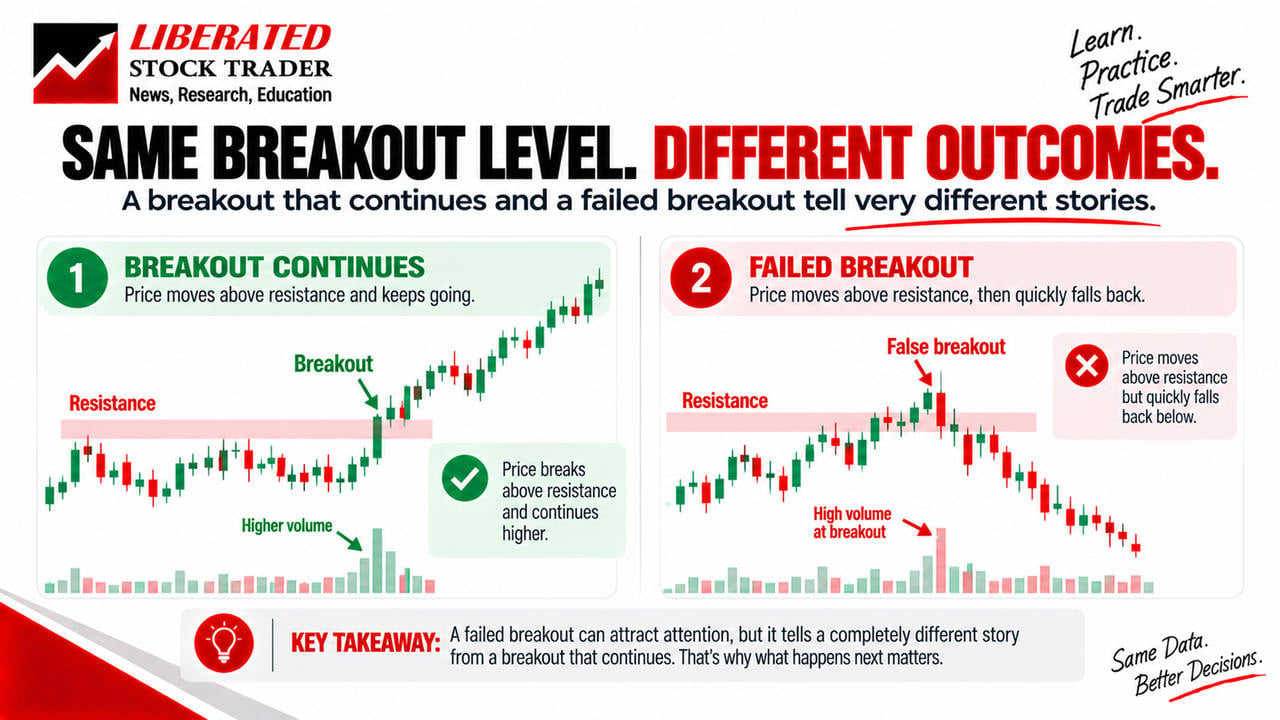
What Volume Can Tell Me About Failed Breakouts
A failed breakout occurs when price moves beyond an important level but cannot sustain the move.
For example, a stock might break above $100, rise briefly to $103, and then fall back below $100.
That tells me the market did not maintain the breakout.
Volume adds another useful detail.
Did the failed breakout occur with very little trading activity?
Or did an unusually high volume spike accompany the reversal?
Both situations can be informative, but they tell different stories.
A low-volume breakout might suggest limited participation.
A sharp reversal on exceptionally high volume might reveal intense trading activity as the market rejected higher prices.
I would be careful not to assume that every volume spike predicts a reversal.
Instead, I would examine the entire sequence: the breakout, the trading volume, and the subsequent price reaction.
Why Volume During Consolidation Is Worth Watching
Not every useful volume observation happens during a dramatic breakout.
Sometimes I find the relationship between price and volume particularly interesting when a stock is moving sideways.
Imagine a stock has risen strongly, then begins trading in a narrow range.
During that consolidation, volume gradually declines.
That can indicate trading activity is becoming quieter while the market pauses.
But it does not tell me whether the next move will be upward or downward.
I would watch what happens when price eventually leaves the range.
Does volume increase as the stock breaks out?
Does the move attract sustained activity?
Or does price briefly escape the range before moving back inside?
Volume helps me evaluate that transition from consolidation into a new move.
What a Volume Spike Means on a Stock Chart
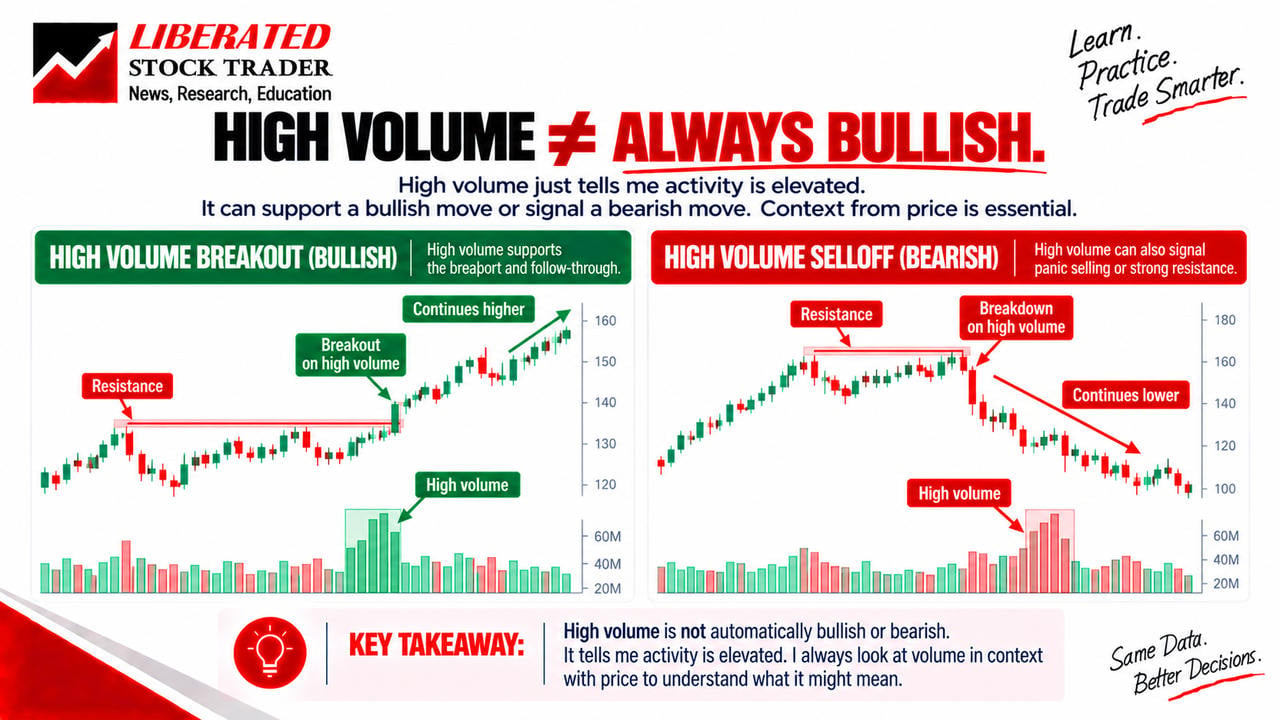
A volume spike is an unusually large increase in trading activity over a short period.
I might see one around an earnings announcement, unexpected company news, or a sharp market move.
My first reaction would not be to buy or sell.
I would ask why activity increased and how price responded.
For example:
- A large upward move with a volume spike shows substantial activity accompanying the advance.
- A sharp decline accompanied by a volume spike indicates heavy trading during the sell-off.
- A volume spike with little net price change can suggest intense two-way trading, with buyers and sellers offsetting one another.
That final example is easy for beginners to overlook.
A very active session does not always produce a large directional price move.
A volume spike draws my attention to the chart, but it does not tell me what to do on its own.
Does Volume Predict Stock Price Movements?
This is where I would be particularly careful.
Volume can help me assess the participation behind price movements, but it cannot reliably predict the next move on its own.
A high-volume rally may continue.
It may consolidate.
Or it may reverse.
The same uncertainty applies to low-volume moves.
I would use volume to support my analysis rather than to replace it.
For example, when I see a breakout, I can compare its volume with previous breakouts and ask whether the move shows stronger or weaker participation.
But before treating that observation as a trading signal, I would need clearly defined rules and evidence that the approach has worked across many historical examples.
That is something I will address later in the series when I cover strategy development and backtesting.
For now, my objective is to observe and understand volume, not pretend that it can predict the future.
Do Beginners Need Advanced Volume Indicators?
No. I would start with ordinary volume bars.
There are plenty of more advanced volume indicators available, including On-Balance Volume (OBV), Volume Profile, VWAP, and Money Flow Index.
Each analyzes trading activity differently.
For instance, On-Balance Volume (OBV) creates a cumulative measure by adding or subtracting volume according to whether price closed higher or lower than the previous session.
Volume Profile takes another approach, showing how much trading activity occurred at different price levels rather than simply displaying volume over time.
Both can be useful.
But I would not start by putting five volume indicators on the same chart.
That adds complexity before I understand the underlying information.
I would first become comfortable recognizing normal, unusual, expanded, and contracted volumes.
Once those concepts make sense, more advanced indicators are easier to evaluate.
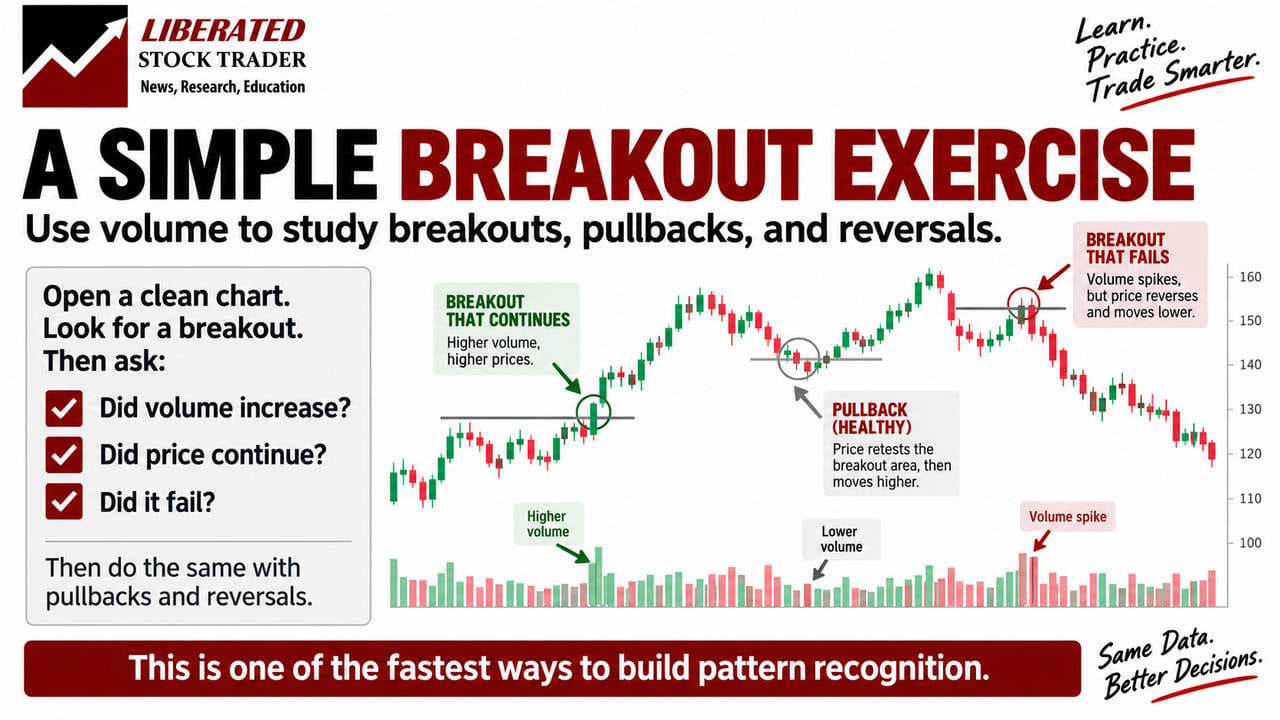
A Simple Trading Volume Exercise for Beginners
If I were learning volume from scratch, I would practice on a stock chart rather than trying to memorize a long list of signals.
Here is the exercise I would use.
I would open a daily chart with candlesticks and ordinary trading volume bars.
Then I would examine at least 20 historical examples and record:
- Price direction: Was the stock moving higher, lower, or sideways?
- Volume level: Was activity relatively high, normal, or low?
- Change in activity: Was volume expanding or contracting?
- Important event: Was there a breakout, decline, reversal, or consolidation?
- What happened next: Did price continue, stall, or reverse?
I would compare successful breakouts with failed breakouts.
I would also compare strong price advances that occurred with high volume against those that occurred with relatively low volume.
Where possible, I would hide future candles and reveal them gradually.
That is important because historical charts can make every successful breakout appear obvious.
I want to practice identifying what I could reasonably have observed at the time.
The goal is to build chart-reading skills, not to convince myself that every volume pattern is a profitable strategy.
Step 2 Summary: Why I Would Learn Volume Before Trading Indicators
If I were starting again, I would learn trading volume immediately after price action.
Price gives me the foundation.
Volume adds context.
Together, they help me understand not only how a stock is moving but also how much trading activity is accompanying that movement.
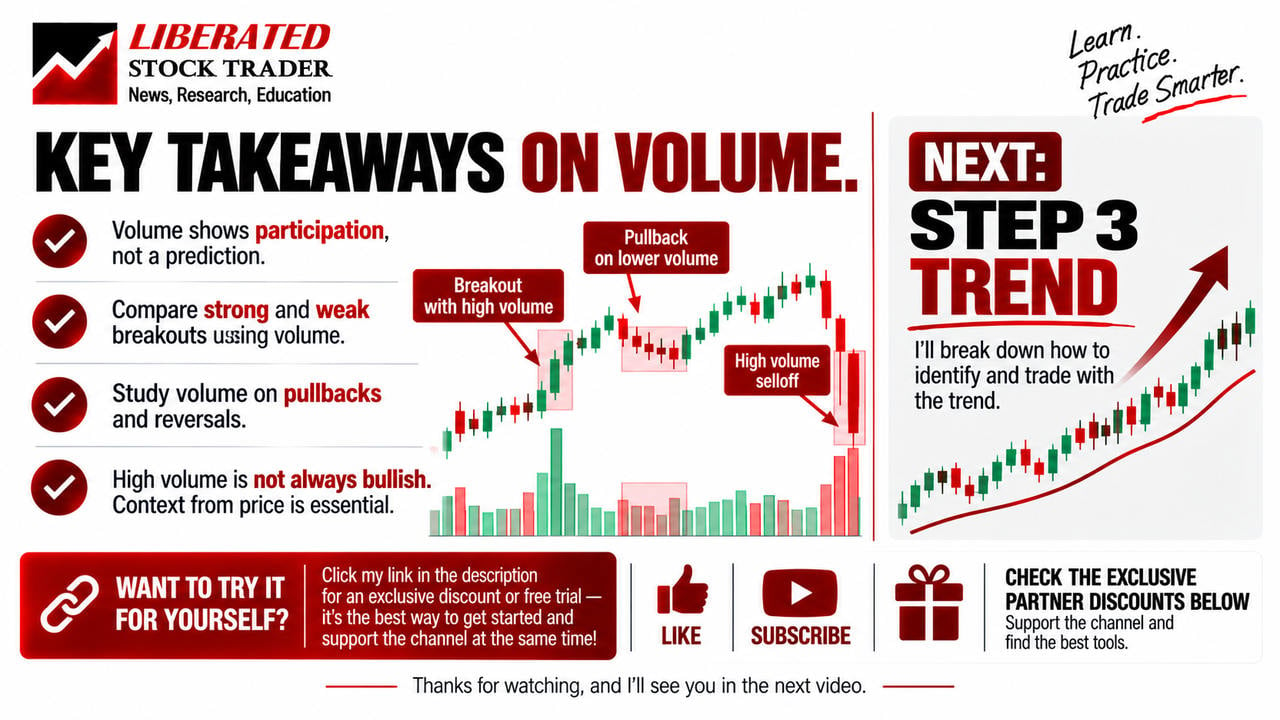
I would focus on four principles:
- Compare volume with the stock’s normal activity.
- Interpret volume alongside price rather than independently.
- Pay attention to volume during breakouts, reversals, and consolidations.
- Avoid treating high volume as an automatic buy signal or low volume as an automatic sell signal.
I would not need complicated indicators to start.
A clean candlestick chart with basic volume bars would be enough.
And once I understood how price and volume interact, I would be ready for the next step: understanding market trends.
What Comes Next? Step 3: Learn Trend Analysis
Now that I can read price action and understand trading volume, the next thing I would learn is how to recognize trends.
Is the market moving higher, lower, or sideways?
Are buyers consistently pushing prices toward new highs?
Or are rallies weakening as sellers take control?
I would learn to answer those questions using price structure before adding complicated trend indicators.
That is Step 3 in my Learn Stock Trading From Scratch series.
If you want to compare stock charting and analysis platforms while learning, you can also try my Smart Trading Tools Finder.
It helps match independently tested platforms to your trading style, markets, budget, and software requirements. Available partner discounts and free trials may also help you evaluate tools before committing to a subscription.
My takeaway: Price tells me what the market did. Volume helps me understand the activity behind that move. Neither guarantees what happens next, but together they give me a better foundation for analyzing stock charts.
Coming Soon: Step 3 — Learn Trend Analysis Using Higher Highs and Higher Lows.
