
If I had to learn trading again from zero, the fourth thing I would study is support and resistance.
Why?
Understanding price, volume, and trend is useful, but I also want to know how the market might react.
Where have buyers stepped in before? Where have sellers repeatedly stopped a rally? And what happens when price breaks through one of those areas?
These are questions I can investigate using support and resistance.
I am Barry Moore, an IFTA Certified Financial Technician (CFTe), and this is Step 4 in my eight-step guide to learning stock trading from scratch.
In the previous lessons, I learned to read price action, interpret trading volume, and recognize trends.
Now I want to understand where price might encounter buying or selling pressure.
But there is one important distinction I would learn immediately: support and resistance are not magical lines that the market must obey.
They are areas of interest, not guarantees.
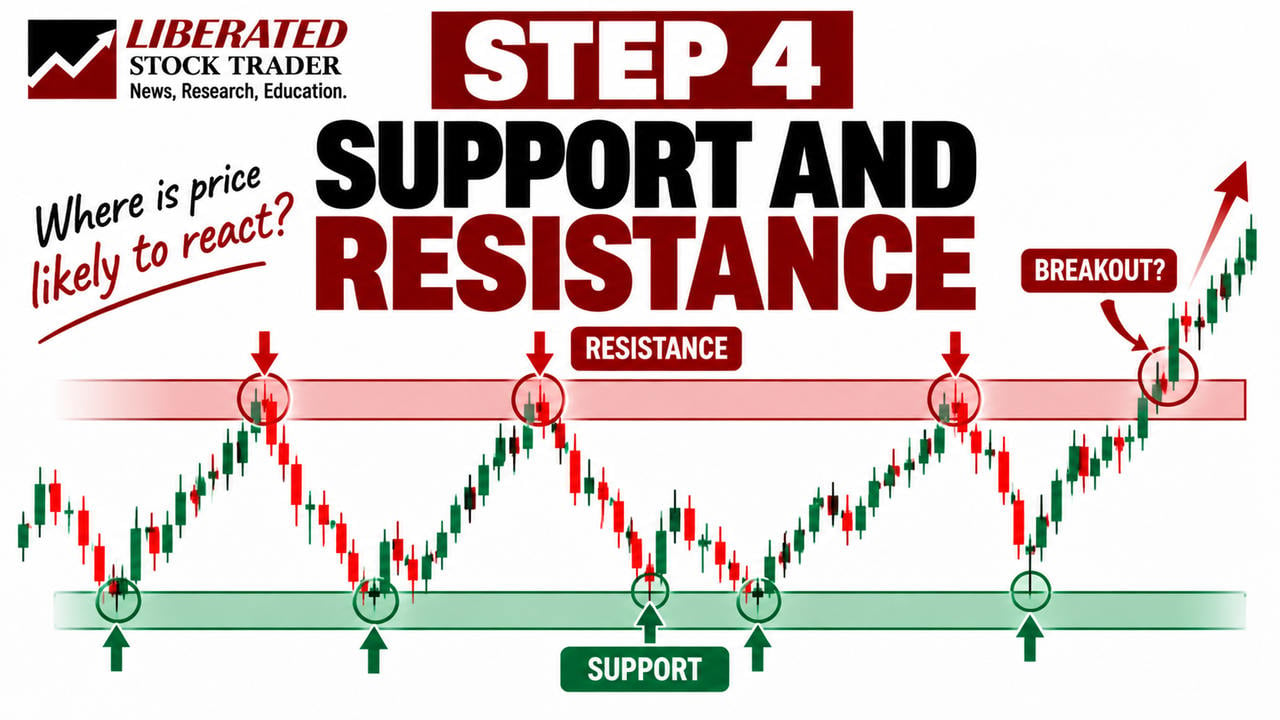
What Are Support and Resistance in Trading?
Support and resistance are price areas where buying or selling activity has previously influenced the market.
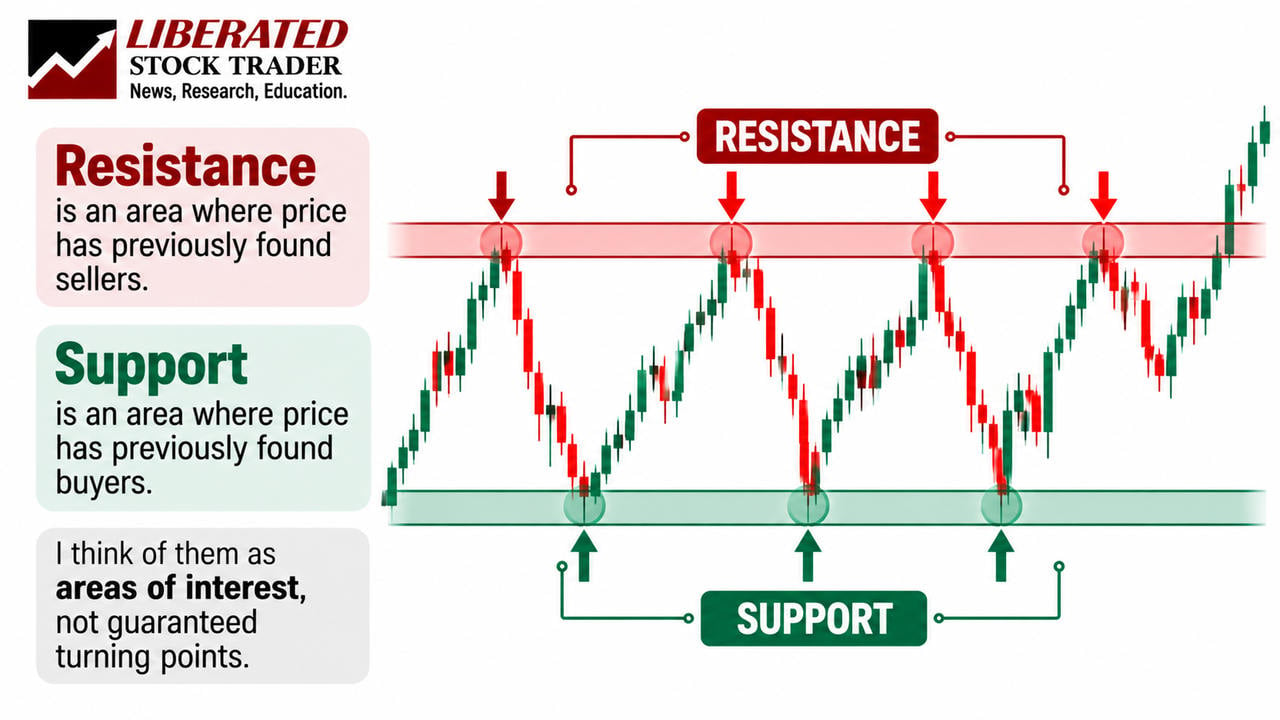
- Support is an area where falling prices have encountered sufficient buying interest to slow, stop, or reverse a decline.
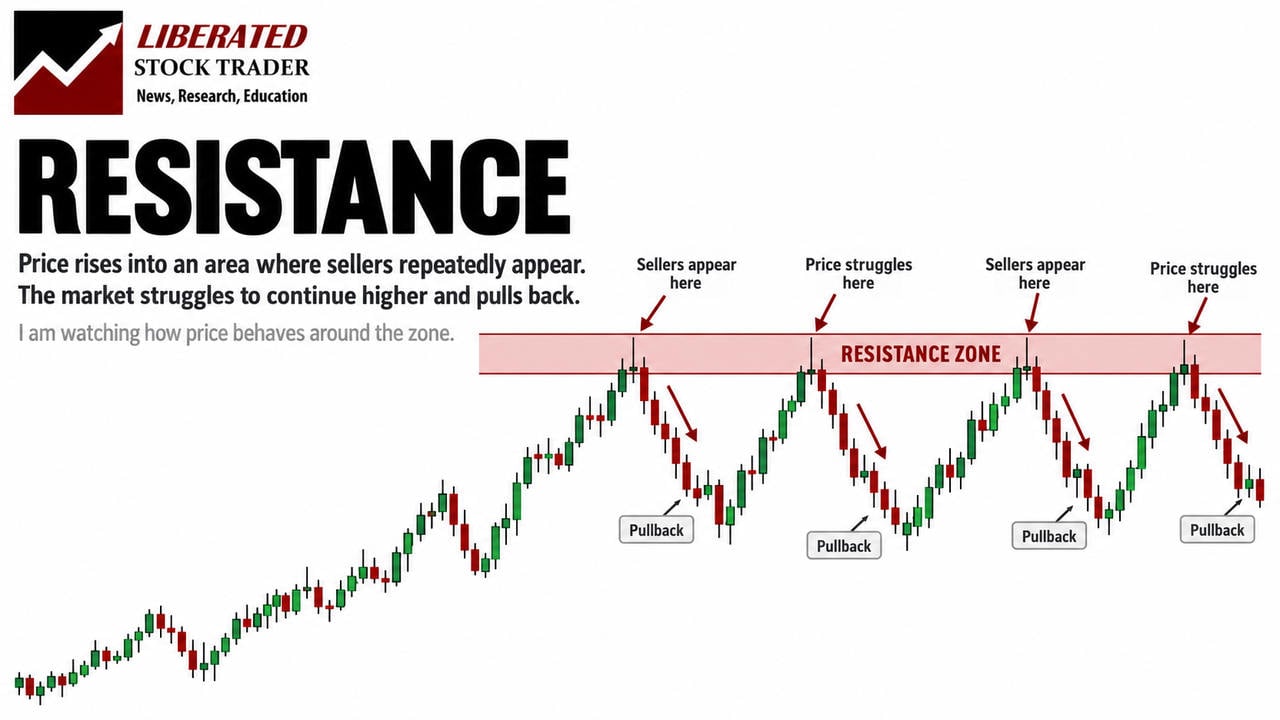
- Resistance is an area where rising prices have encountered sufficient selling pressure to slow, stop, or reverse an advance.
Imagine a stock falling toward $50.
Each time it approaches that price, buyers become more active and the stock rebounds.
I would identify the area around $50 as potential support.
Now imagine the same stock repeatedly rising toward $60 before falling back.
I would identify the area around $60 as potential resistance.
The result is a trading range, with support near the bottom and resistance near the top.
| Feature | Support | Resistance |
|---|---|---|
| Typical location | Below the current price | Above the current price |
| Previous price behavior | Declines slowed or reversed | Rallies slowed or reversed |
| Potential market activity | Buying interest increases | Selling interest increases |
| What can happen next | Bounce or breakdown | Rejection or breakout |
However, these descriptions refer to previous reactions. They do not tell me what must happen when price reaches those areas again.
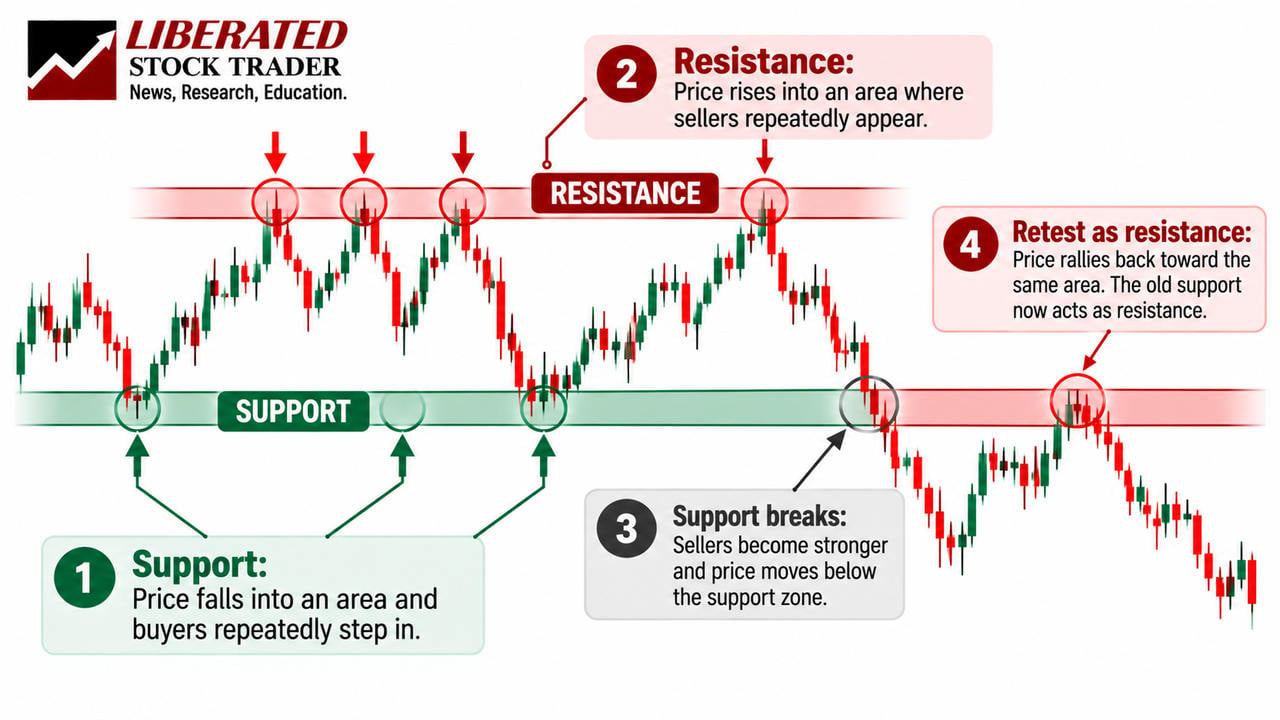
Why I Draw Support and Resistance Zones, Not Exact Lines
One of the biggest mistakes I would avoid is treating support and resistance as exact prices.
Suppose a stock repeatedly reverses around $100.
One reversal occurs at $99.60.
Another occurs at $100.20.
A third reaches $100.80 before falling.
Where should I draw resistance?
I could draw a line at $100, but that would suggest a level of precision that does not really exist.
Instead, I would mark a resistance zone covering the area where previous reactions occurred.
That might be approximately $99.50 to $101.
The exact boundaries depend on the chart.
I would use the same approach for support.
This gives price room to fluctuate without forcing me to interpret every small movement beyond a line as a confirmed breakout.
Markets are noisy. Buyers and sellers do not all place their orders at the same price.
For me, the important information is the area where activity has repeatedly shifted the market’s direction.
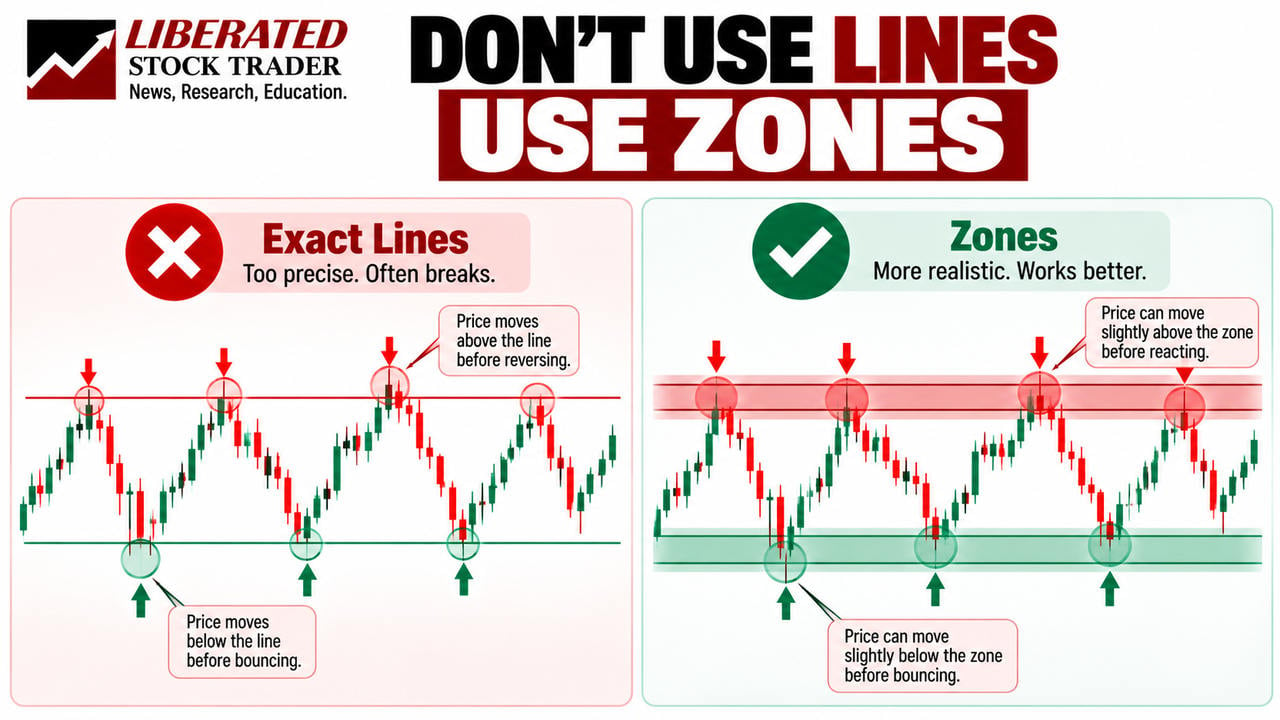
How Support Levels Form on a Stock Chart
Support often becomes visible after price has reacted several times around a similar area.
Imagine a stock declining from $75 to $60.
At $60, the decline stops and the stock rebounds.
A few weeks later, price falls toward $60 again, and buyers step in.
Then it happens a third time.
That repeated behavior tells me the area around $60 has attracted buying interest in the past.
I would mark it as a potential support zone.
The more established the history of price reactions, the more relevant the area may become for my analysis.
But repeated support tests do not necessarily make the level unbreakable.
Every new test occurs under different market conditions. Buying interest can weaken, new sellers can emerge, and important news can change the market’s behavior.
That is why I would describe support as an area to watch rather than a price where I am guaranteed a bounce.
How Resistance Levels Form on a Stock Chart
Resistance develops through a similar process, but on the upside.
Imagine a stock advancing toward $100.
As price approaches that area, selling activity becomes strong enough to interrupt the rally.
The stock falls back.
Later, it approaches $100 again and reverses.
After several reactions, I can see that the area has repeatedly attracted sellers.
That is potential resistance.
However, I would not assume the stock cannot rise above $100.
If demand eventually becomes strong enough to absorb the selling pressure, price may break through the area.
I would also remember that a stock can trade temporarily above resistance before reversing.
That is another reason I prefer zones rather than perfectly horizontal lines.
How to Identify Support and Resistance Using Swing Highs and Lows
So where would I actually draw support and resistance on a chart?
I would start with the most obvious previous swing highs and swing lows.
A swing high is a local peak where price stopped rising and moved lower.
A swing low is a local trough where price stopped falling and moved higher.
These turning points are useful because they show where the balance between buying and selling pressure has previously changed.
How I Would Draw the Zones
First, I would open a clean stock chart.
I would identify two or three obvious previous swing highs occurring around similar prices.
If those peaks were close together, I would mark the surrounding area as potential resistance.
Then I would look for repeated swing lows and mark the corresponding support zone.
I would focus on significant turning points rather than every minor price fluctuation.
Too many support and resistance zones can make a chart almost impossible to interpret.
As a beginner, I would rather identify two or three meaningful areas than draw twenty lines across the screen.
For a more detailed explanation of chart construction and drawing price levels, see my guide to reading stock charts and tutorial on trendlines.
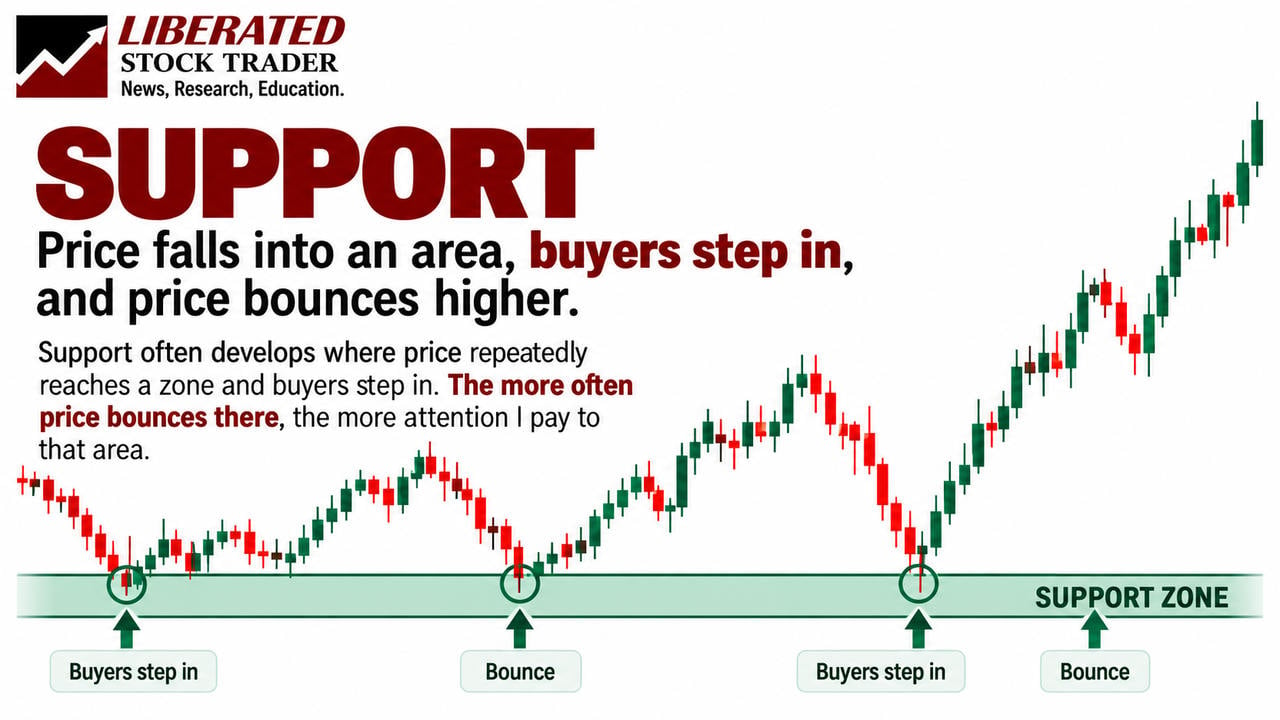
What Happens When a Stock Breaks Below Support?
Support does not always hold.
Imagine a stock repeatedly bouncing from a support zone around $50.
Then selling pressure increases and the price falls decisively below that area.
That is a support breakdown.
The previous pattern of buying interest has failed to prevent the decline.
But the next development can be particularly interesting.
Suppose price recovers toward $50 from below, only to encounter selling pressure and fall again.
The old support area is now behaving as resistance.
This is often called support turning into resistance, or a support-and-resistance role reversal.
I would watch for that reaction rather than assuming every broken support level automatically becomes resistance.
A stock can also reclaim the broken area and continue higher.
The important evidence comes from what price actually does after the breakdown.
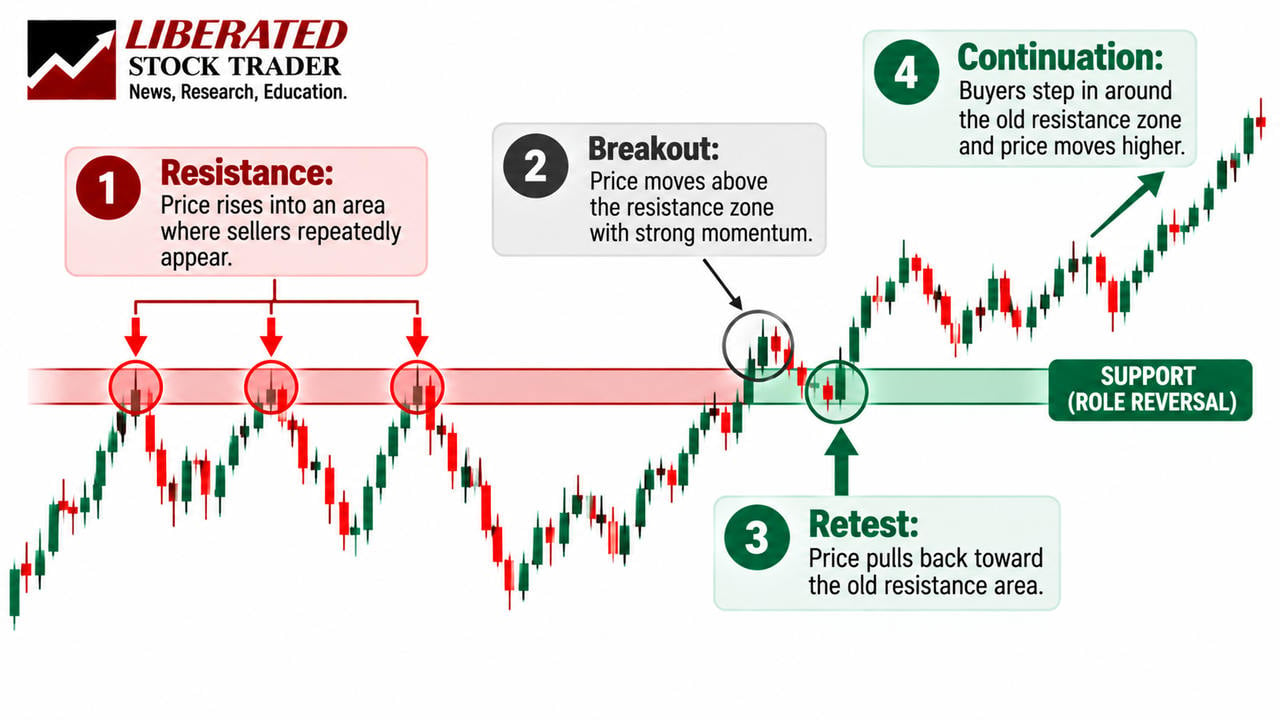
How Resistance Can Become Support After a Breakout
The opposite situation can occur when price breaks above resistance.
Imagine a stock repeatedly failing to move beyond $100.
Eventually, it breaks through that resistance zone and advances to $110.
Later, the price pulls back toward $100.
Instead of falling straight through, buyers become active and the stock rebounds.
The old resistance zone has begun to act as support.
Traders often call this a breakout and retest.
The process has three important stages:
- Price breaks above the previous resistance zone.
- Price returns toward the breakout area.
- Buyers respond, and the area begins behaving as potential support.
But I would be careful with the third stage.
Not every breakout produces a retest. And not every retest holds.
Sometimes the price falls back into the previous trading range, resulting in a failed breakout.
I am looking for evidence of how the market reacts, not assuming the role reversal will occur.
Are Support and Resistance Levels Reliable?
Support and resistance can help me organize a chart, but they cannot guarantee where prices will reverse.
A support zone can hold several times before breaking sharply.
A resistance zone can reject multiple rallies before price eventually moves through it.
The market is constantly responding to changing information, liquidity, and buying and selling activity.
I would therefore avoid statements such as:
“The stock must bounce because it reached support.”
Instead, I would say:
“This is an area where buyers have previously become active. I want to see how price behaves if it returns.”
That is a more useful way to think about technical analysis.
It separates a historical observation from a prediction.
There is also an important difference between recognizing a price level and having a profitable trading strategy.
Even if a stock frequently reacts around support or resistance, I still need rules for entries, exits, risk management, and testing.
I would not risk money simply because a horizontal zone looks convincing.
How to Combine Support and Resistance With Trend Analysis
This is where the first four lessons of my trading series begin to connect.
I now understand price, volume, trend, and support and resistance.
So I would stop looking at price zones in isolation and consider the broader market direction.
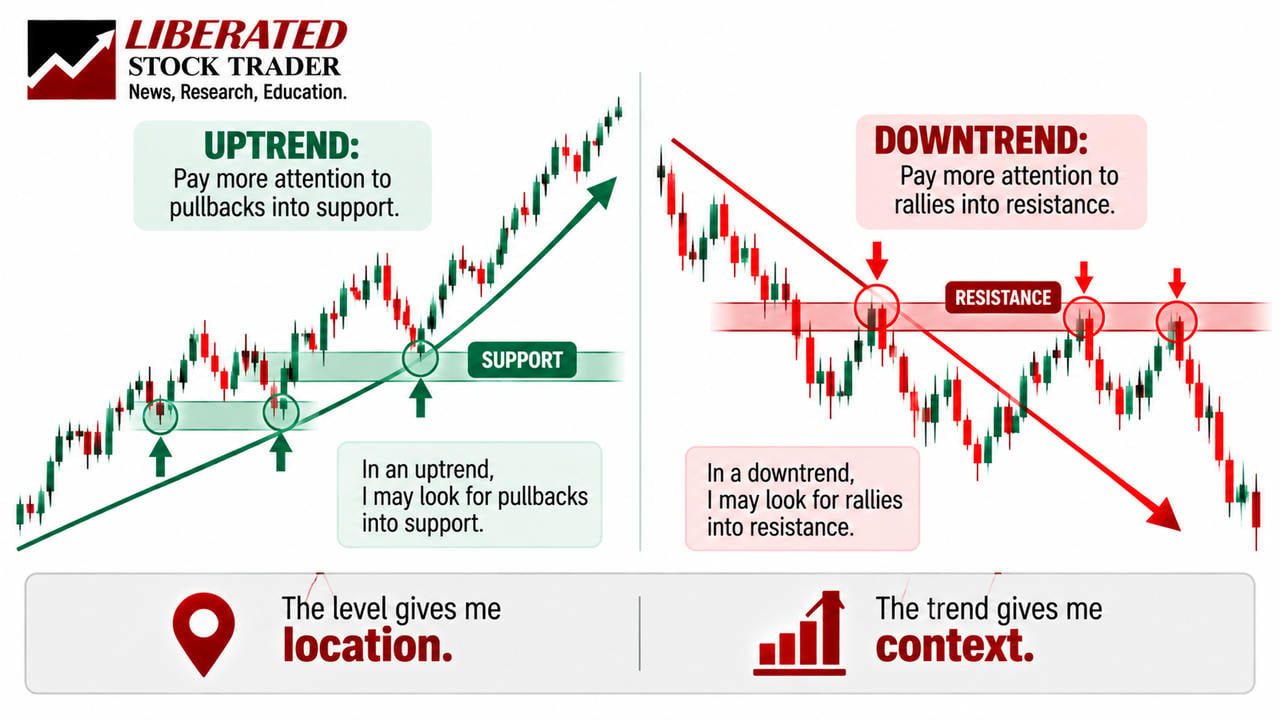
Support During an Uptrend
Imagine a stock making higher highs and higher lows.
It then pulls back toward a previous support area.
If buyers become active and prices begin to recover, that reaction may be consistent with the existing uptrend.
I would still want to see how the price behaves before concluding.
Resistance During a Downtrend
Now imagine a stock making lower highs and lower lows.
It temporarily rallies toward a previous resistance zone.
If sellers return and stock begins to fall again, that reaction may be consistent with the broader downtrend.
In both examples, the trend provides direction while support or resistance provides a location to monitor.
Trend tells me the direction. Support and resistance tell me where to pay attention.
That combination is much more informative than a horizontal line viewed on its own.
What Should I Look for When Price Reaches a Support or Resistance Zone?
Once price approaches an important area, I want to observe its actual behavior.
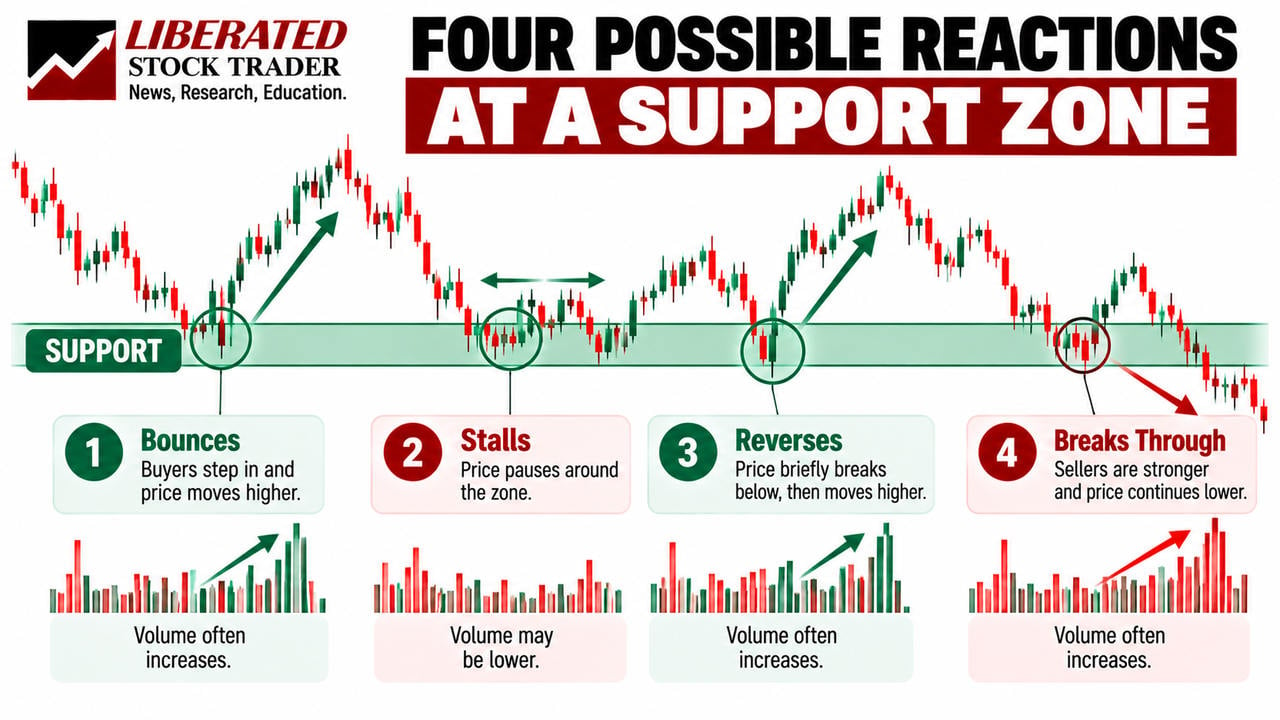
I would ask whether price is slowing down, reversing, consolidating, or breaking through.
For example, near resistance, I might notice several candles struggling to close above the level.
I might see long upper wicks showing that higher prices were reached but not maintained.
Alternatively, price might accelerate through resistance and continue rising.
At support, I might see lower wicks, a series of unsuccessful attempts to move lower, or an eventual breakdown.
Trading volume can provide additional context.
A breakout accompanied by unusually high volume tells me that substantial trading activity occurred as price crossed the zone.
But it still cannot guarantee that the move will continue.
As I explained in Step 2: How to Read Trading Volume, volume gives me another way to evaluate participation behind price movements.
At this stage, I am simply combining the information.
Where is price? How is it behaving? And how much trading activity accompanies the move?
How Support and Resistance Breakouts Change Market Structure
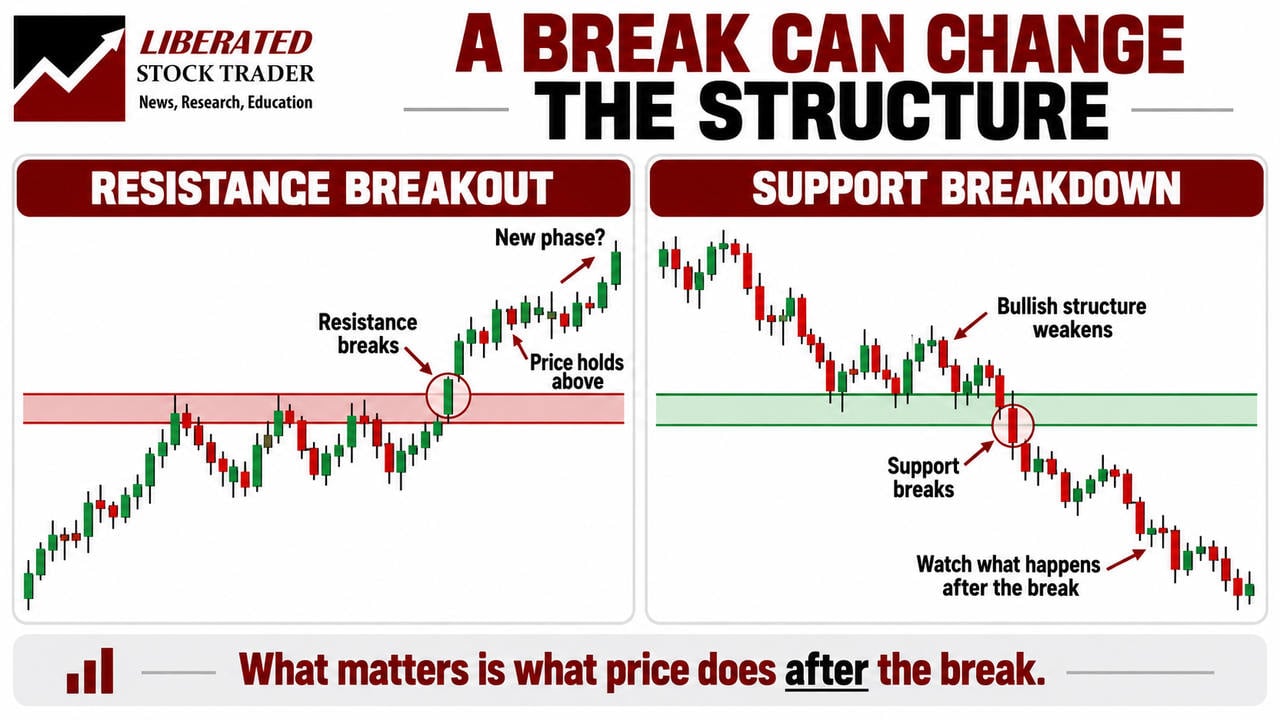
A breakout or breakdown can also change how I interpret the wider chart.
Imagine a stock trading sideways between $90 and $100.
For several weeks, neither buyers nor sellers establish a sustained directional advantage.
Then price breaks above $100 and starts making new highs.
The previous trading range may now be giving way to an emerging uptrend.
Alternatively, price might break below $90 and begin making lower lows.
That could indicate the beginning of a downward move.
However, I would not label every break of a trading range as a confirmed trend.
False breakouts are common, and prices can return to the previous range.
I would look for additional evidence from subsequent price action.
For example, after a bullish breakout, does price maintain higher levels and begin producing higher highs and higher lows?
After a bearish breakdown, does price remain below the previous range and establish lower highs and lower lows?
This brings me back to the market structure covered in Step 3.
Support and resistance help me identify important locations. Breakouts and subsequent price behavior help me understand whether the market structure is changing.
For traders who want to study these formations in greater detail, my rectangle chart pattern guide explains how trading ranges and their breakout levels work.
A Simple Exercise to Practice Drawing Support and Resistance
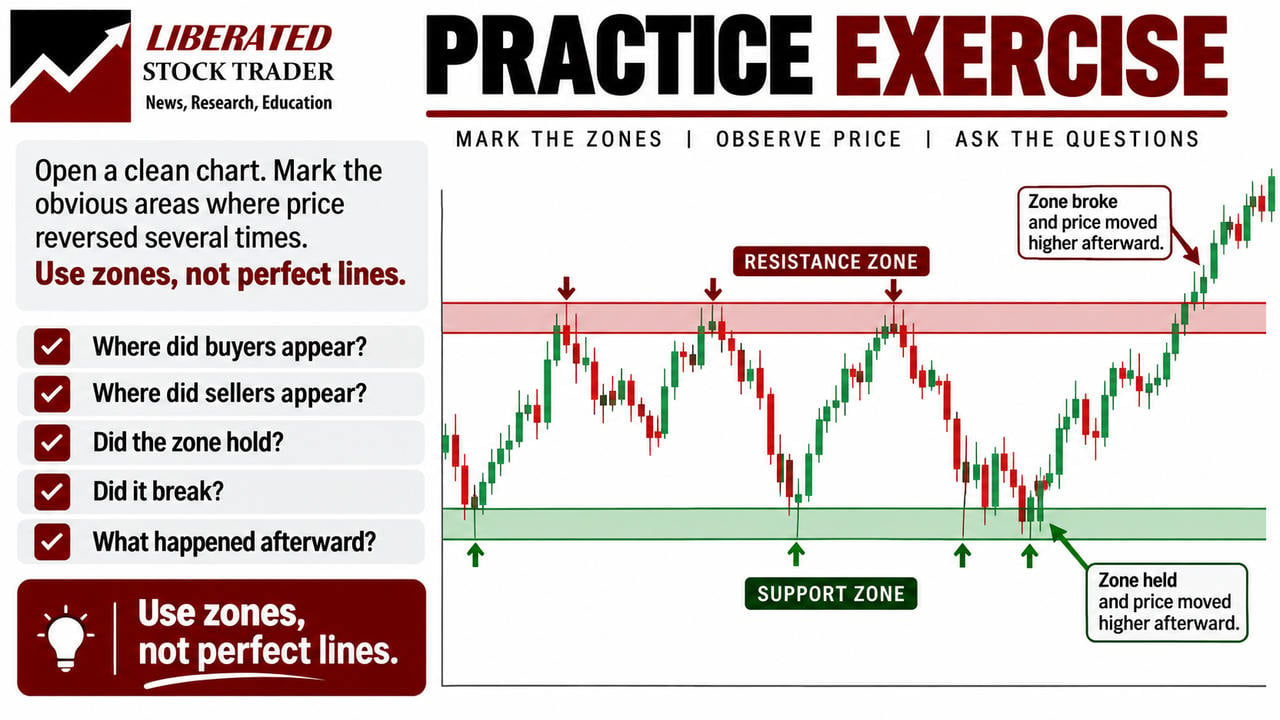
If I were learning support and resistance from scratch, I would practice marking price zones before trying to trade them.
I would open a clean daily candlestick chart and remove unnecessary indicators.
Then I would work through five questions:
- Where are the most obvious previous swing highs?
- Where are the most obvious previous swing lows?
- Which price areas have produced repeated reactions?
- Is the stock currently approaching support, resistance, or neither?
- If price breaks through a zone, what happens afterward?
I would draw the relevant areas using lightly shaded horizontal rectangles rather than trying to identify an exact price.
Then I would move to another historical chart and repeat the exercise.
I might examine 20 or 30 examples covering different stocks and market conditions.
Some should show clear bounces from support.
Others should show resistance rejections, successful breakouts, failed breakouts, and role reversals.
Where possible, I would hide future candles and reveal them gradually.
That helps prevent hindsight from turning every historical price reaction into something that seems obvious.
I want to practice identifying the areas that would have been visible at the time.
My objective is not to prove that every zone works.
It is to become comfortable recognizing where price has previously reacted and describing what happened when the market returned.
Step 4 Summary: Why Support and Resistance Matter
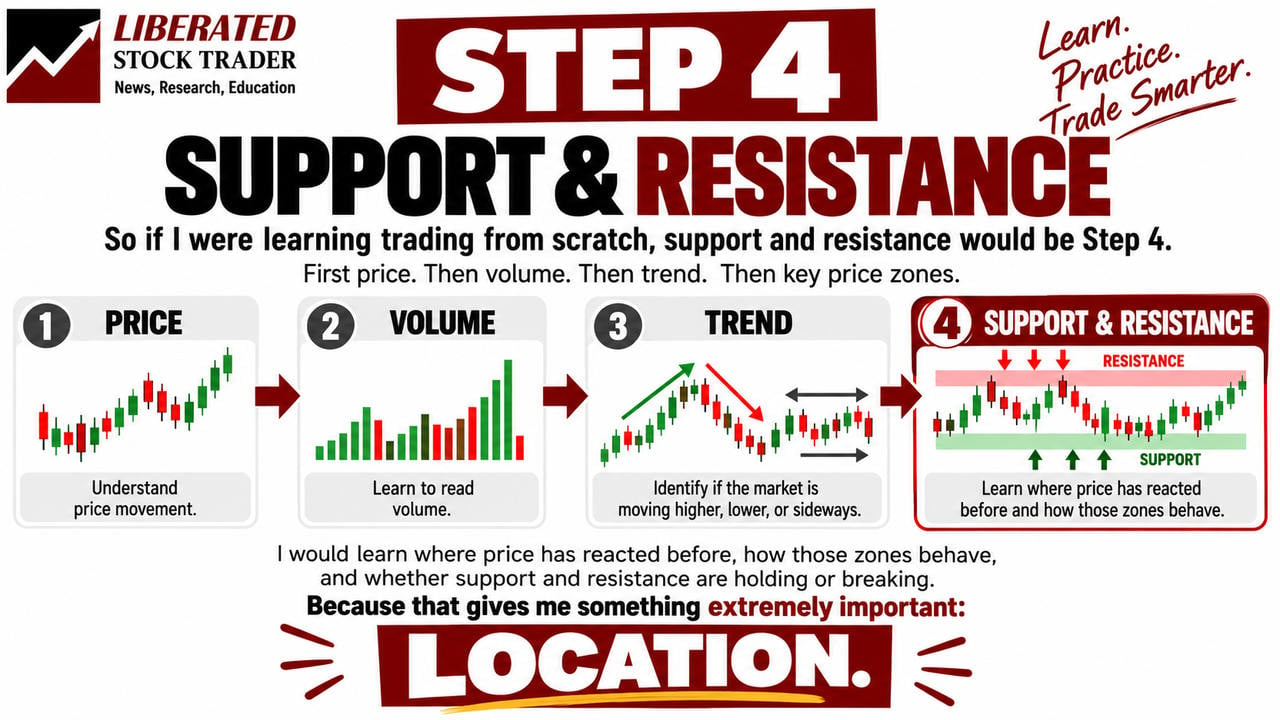
If I were learning trading again, I would make support and resistance the fourth step.
Price gave me the foundation.
Volume added context.
Trend helped me identify the market’s general direction.
Support and resistance now give me important areas to monitor.
I would remember four principles:
- Support and resistance are zones, not exact prices.
- Previous swing highs and lows help reveal where buyers and sellers have reacted.
- Broken support may become resistance, while broken resistance may become support.
- A price reaction or breakout is evidence to evaluate, not a guarantee of what happens next.
I would keep the chart simple.
A few meaningful zones, combined with price action, volume, and trend, are enough to begin understanding how these concepts interact.
There is no need to cover the chart with dozens of lines.
And there is no need to buy advanced charting software before learning to recognize these areas manually.
What Comes Next? Step 5: Learn Risk Management
Now that I understand the first four building blocks of technical analysis, there is one important subject I would learn before constructing a trading strategy.
Risk management.
Because identifying an attractive support zone does not tell me how much money I should risk.
And even a convincing breakout can fail.
Before entering a trade, I want to know where my idea would be invalidated, where I would exit, and how large my position should be.
That is why risk management comes before strategy development in my learning process.
If you want to practice drawing support and resistance zones, you can also use my Smart Trading Tools Finder to compare charting platforms based on your trading style, markets, budget, and required features.
You will also find available partner discounts and free trials to help you evaluate suitable tools.

My takeaway: Support and resistance do not tell me where the market must go. They help me identify where price has reacted before—and where I should pay closer attention to what happens next.
Coming Soon: Step 5 — Learn Risk Management, Stop Losses, and Position Sizing.
