
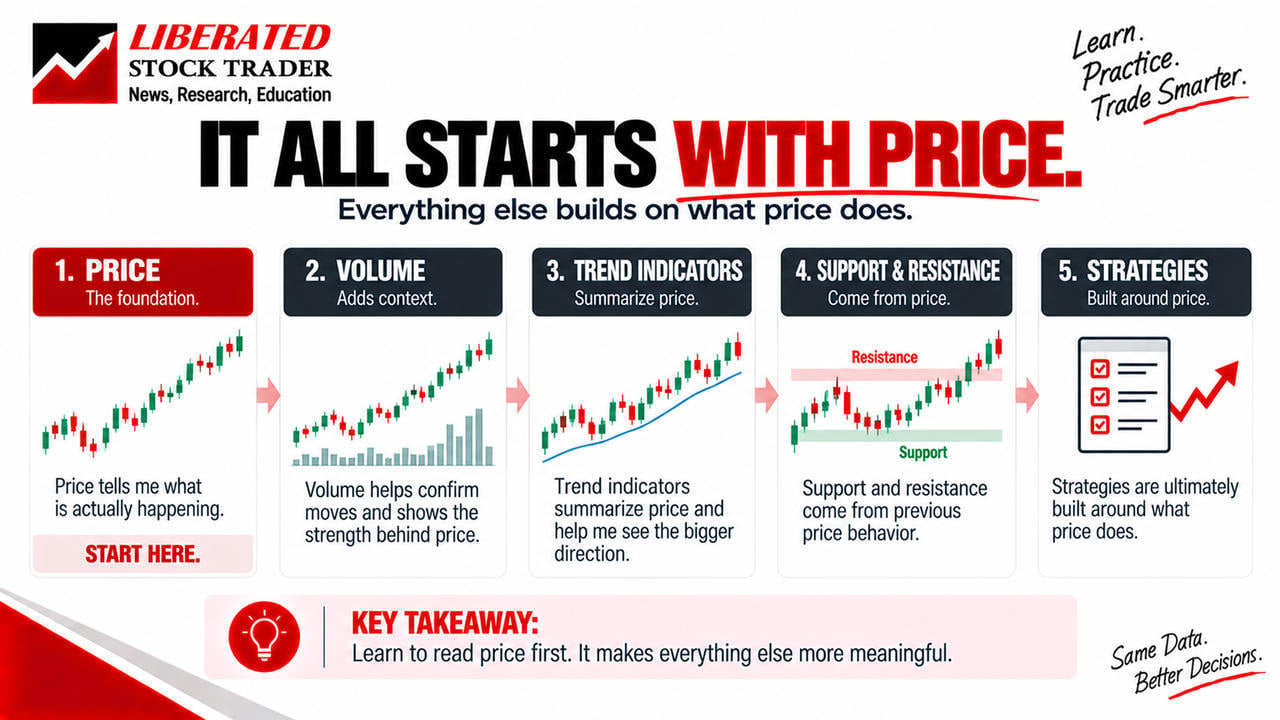
If I had to learn stock trading again from zero, I would not start with complicated indicators, AI trading tools, or expensive software.
I would start with price.
Why? Because everything else I use in technical analysis begins with understanding what a stock’s price is actually doing.
Is it moving higher? Is it falling? Is it slowing down? Are buyers becoming more aggressive, or are sellers taking control?
A stock chart can help me answer those questions before I add anything else.
In this guide, I’ll explain how to read stock price action, understand candlestick charts, identify changes in momentum, and recognize common price behaviors such as consolidations and breakouts.
The goal is not to predict every move. It is to learn how to read what the market is showing me.
My Price Action Trading Video
What Is Price Action in Stock Trading?
Price action is the movement of a security’s price over time. By studying that movement on a chart, I can see how buying and selling pressure has influenced the market.
For example, a stock might climb steadily for several days, pause while buyers and sellers reach a temporary balance, and then either continue higher or reverse direction.
Those movements give me information about market behavior.
Price action trading is an approach that uses price movements, chart structures, and sometimes candlestick patterns to inform trading decisions.
Some traders use almost no indicators. Others combine price action with tools such as moving averages, volume, or momentum indicators.
Personally, I would learn to read price before relying heavily on indicators.
That way, when I eventually add an indicator, I can understand what it is measuring rather than simply reacting to a colored line.
How to Read a Stock Chart for Beginners
Before I try to identify trading opportunities, I need to understand the basic structure of a stock chart.
Most charts show two essential things:
- Time: The horizontal axis shows when price movement occurred.
- Price: The vertical axis shows the stock’s value at each point in time.
If I select a daily chart, each candle represents one trading day. On an hourly chart, each candle represents one hour.
The timeframe changes how much detail I see, but the underlying principle remains the same: I am looking at how prices change over time.
Line Charts vs. Candlestick Charts
A line chart is useful when I want a quick overview of whether a stock is rising or falling. It generally connects closing prices, making the broader direction easy to recognize.
But if I want to understand what happened inside each trading period, I prefer candlestick charts.
They show more information, particularly how far prices moved, where trading began, and where the period finished.
How to Read Candlestick Charts
Candlestick charts are one of the first technical analysis tools I would learn.
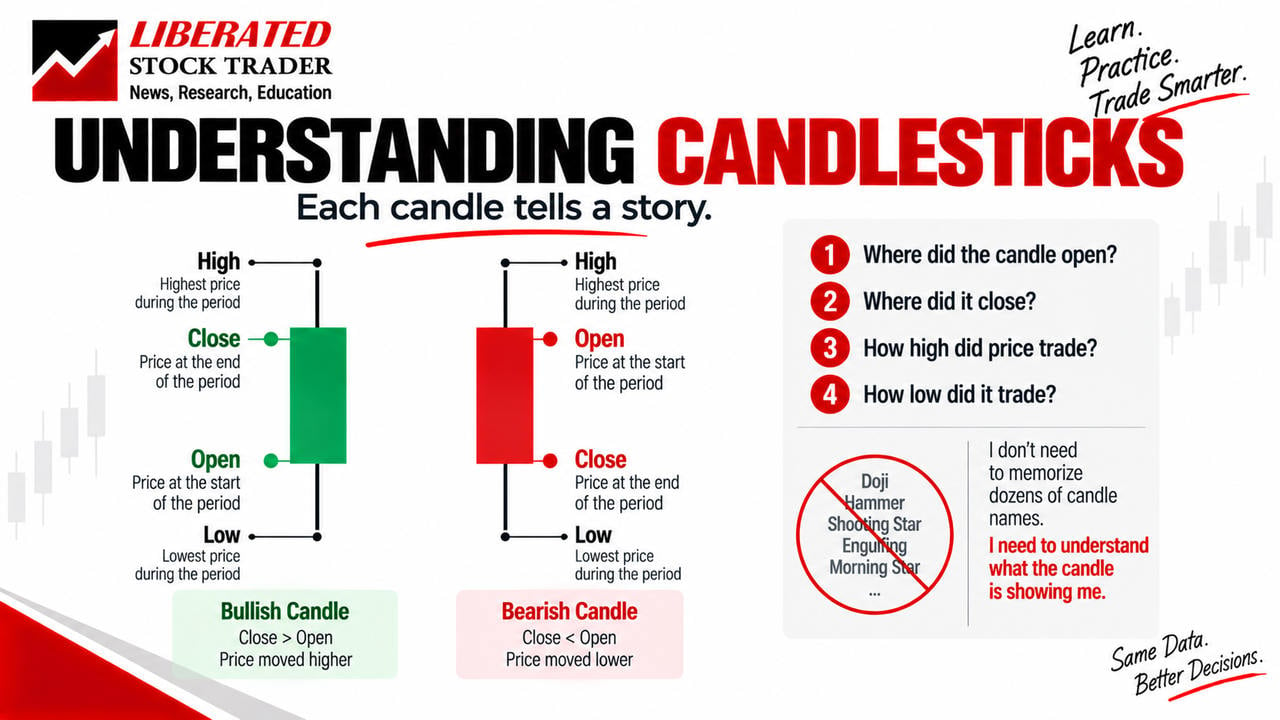
A single candlestick gives me four important prices:
- Open: Where the price started during that period.
- High: The highest price reached.
- Low: The lowest price reached.
- Close: Where the price finished.
Together, these are commonly called OHLC data.
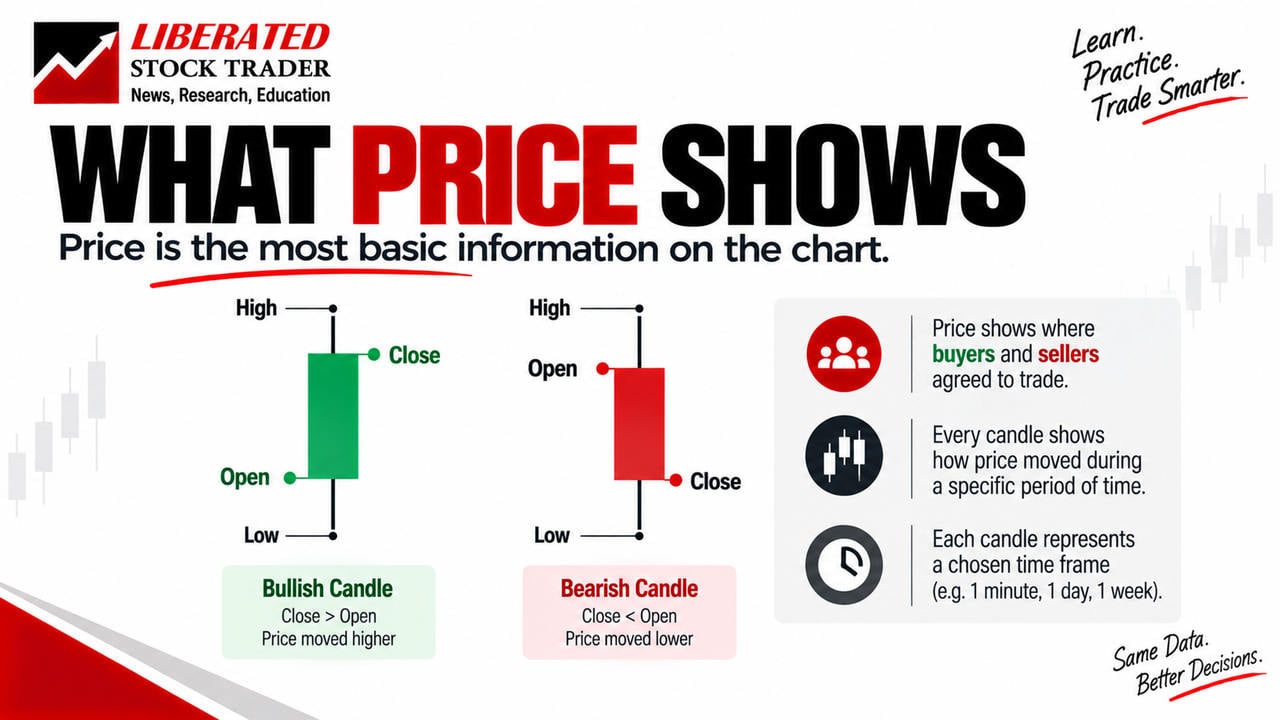
The thick part of the candle is the real body. The thin lines extending above or below it are called wicks or shadows.
On a typical chart, a green candle means the closing price was above the opening price. A red candle means the closing price was below the opening price.
However, these colors are configurable. What matters is the relationship between the open and close.
What Does a Large Candlestick Mean?
A large candle body tells me that price moved significantly between the open and close.
A large green candle can indicate strong upward movement during that period. A large red candle can indicate strong downward movement.
But I would never assume that one large candle guarantees the next move.
I always want to understand what happened before it.
What Candlestick Wicks Tell Me About Price Rejection
The candle body is useful, but I also pay attention to its wicks.
Imagine a stock climbs sharply during the day, but sellers push it back down before the close.
That produces a long upper wick.
It tells me the stock traded at higher prices but could not maintain them through the end of the period.
Now imagine the reverse.
The stock falls sharply, but buyers step in and push the price back upward. That produces a long lower wick.
These movements can indicate rejection of particular price levels.
However, I would not automatically interpret every long wick as a reversal signal.
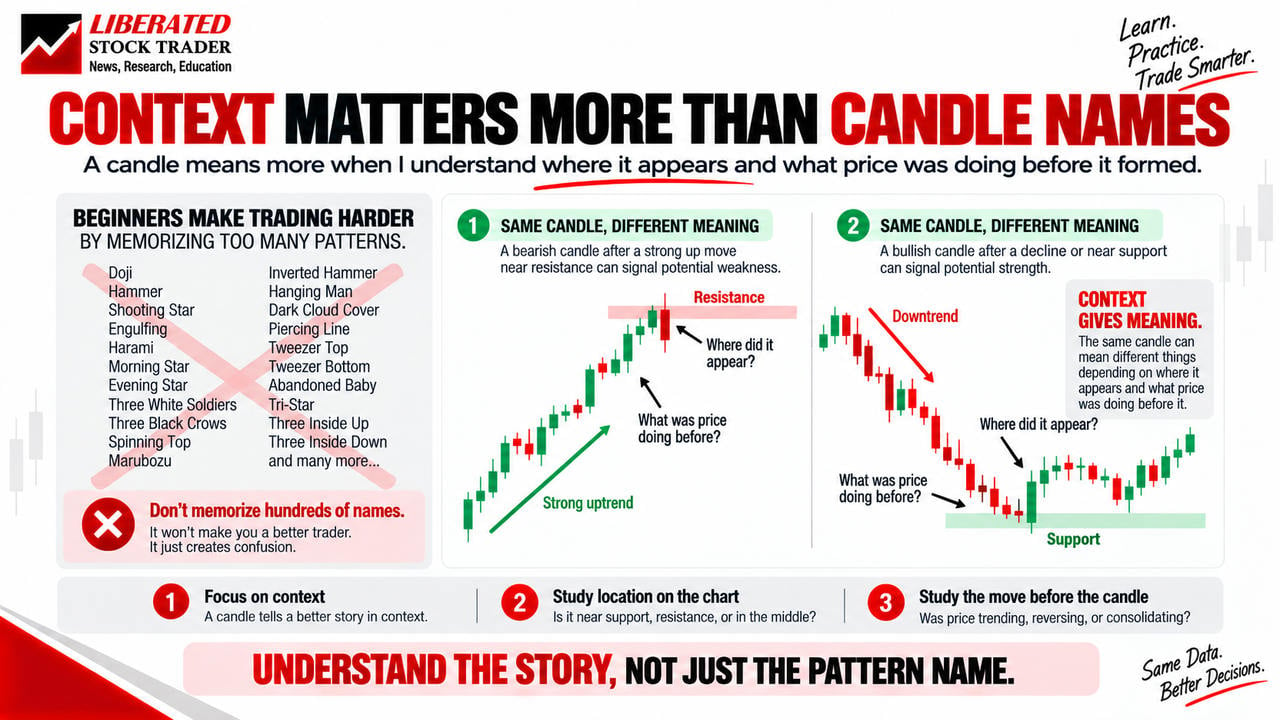
A wick becomes more meaningful when I consider the surrounding price action, nearby support and resistance, and the behavior of subsequent candles.
How to Identify Price Momentum and Acceleration
Once I understand individual candlesticks, I would stop looking at them in isolation.
Instead, I would study sequences of candles.
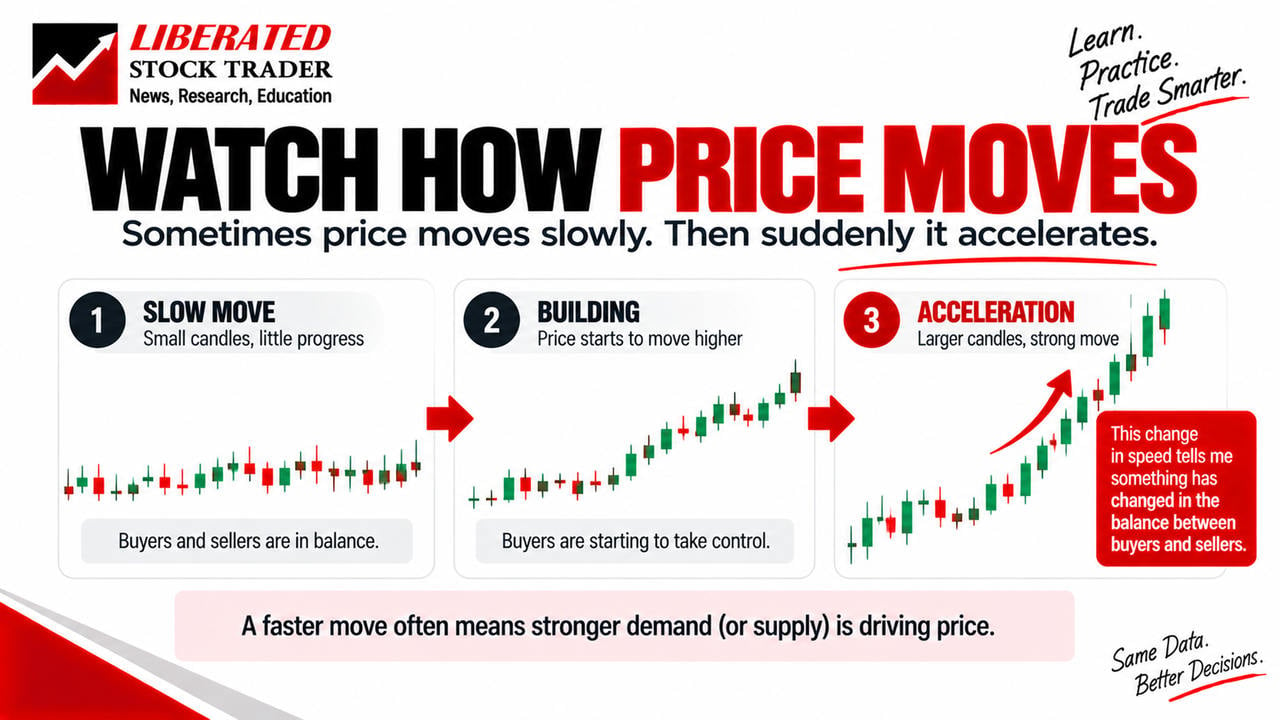
One of the first things I look for is whether price movement is accelerating.
For example, imagine a stock begins moving higher with small candles. Then the candles become larger, and price starts covering more distance over the same period.
That can indicate increasing upward momentum.
The same thing can happen in reverse when selling pressure intensifies.
I might notice several large downward candles, shorter upward recoveries, and prices falling faster than before.
These observations help me understand how market behavior is changing.
But acceleration is not automatically a good entry signal. A strong move may already be extended, and chasing it can expose me to an unfavorable entry price.
How to Recognize Consolidation on a Stock Chart
Markets do not move continuously in one direction.
Sometimes price moves sideways for an extended period.
This is called consolidation.
During consolidation, buyers and sellers are temporarily balancing one another, keeping prices within a relatively defined range.
I often see consolidation after a strong upward or downward move.
For example, a stock might rise from $80 to $100, then spend several days trading between $97 and $101.
Instead of assuming that the stock has lost all momentum, I would ask whether the market is pausing before another move or beginning to change direction.
Consolidation alone does not tell me the answer.
But it does give me clear boundaries to monitor.
How to Identify a Stock Price Breakout
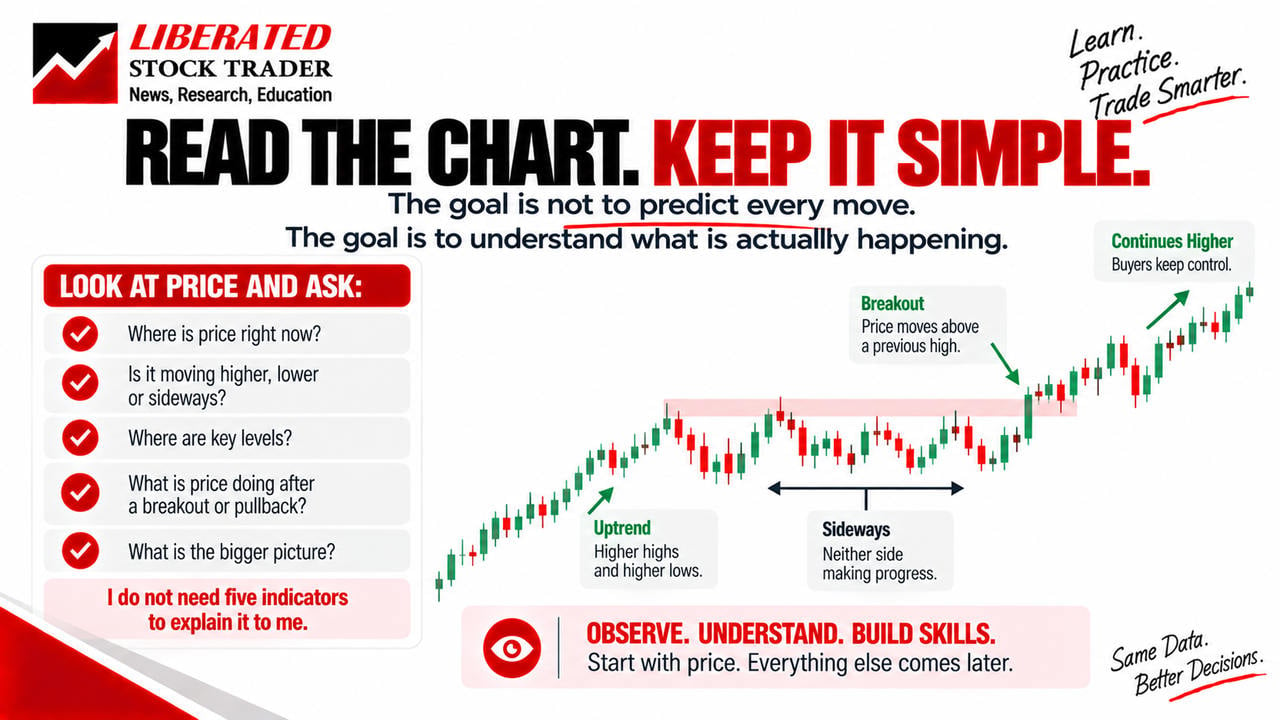
A breakout occurs when price moves beyond an identifiable boundary, such as the upper edge of a consolidation range or a previous swing high.
Suppose a stock repeatedly struggles to move above $100.
Then price moves through that area.
That is a potential breakout.
The important question is what happens afterward.
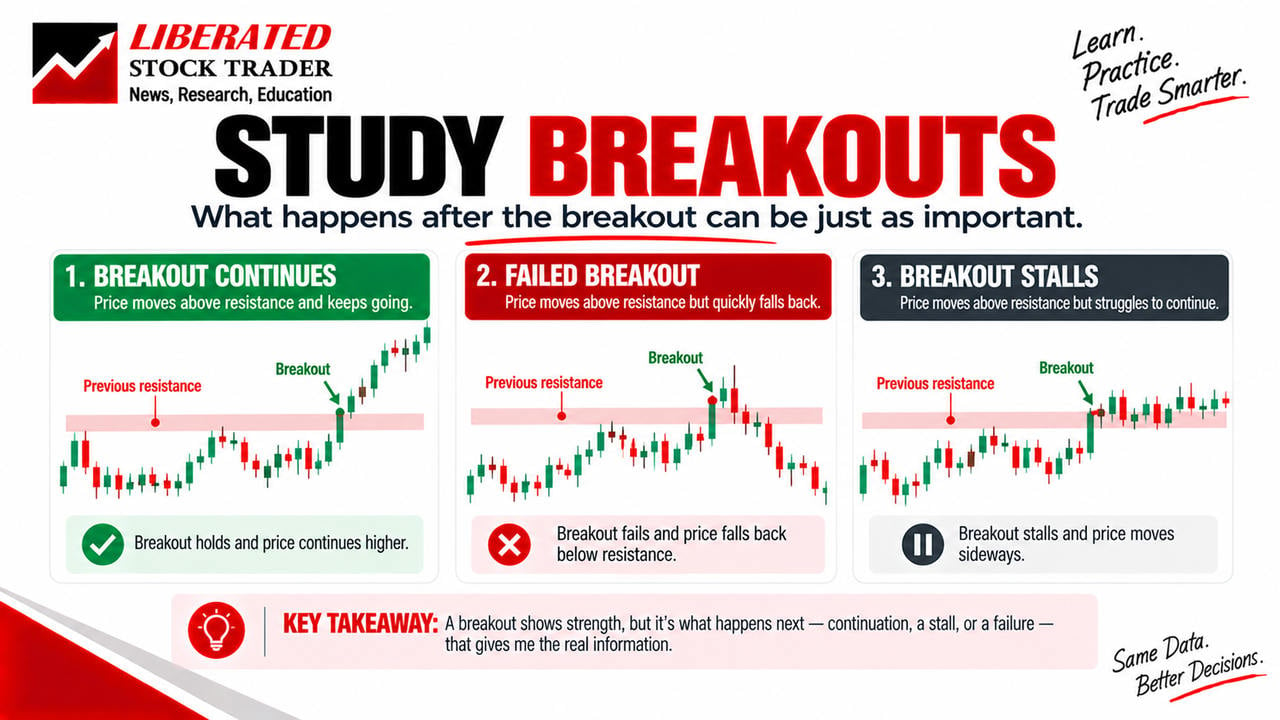
Does the stock continue moving higher? Does it maintain prices above the previous range? Or does it quickly fall back inside?
I would not consider every breakout equally convincing.
I would examine the size of the move, the preceding price structure, subsequent price behavior, and eventually trading volume.
Why Breakout Context Matters
A breakout after an orderly consolidation can have characteristics different from those of one following a chaotic, volatile price decline.
That is why I want to understand the entire sequence rather than trading a single candle.
A breakout is an event on the chart, not a guarantee that a new trend has begun.
[IMAGE 8 — Price breakout. Stock moving above a clearly marked consolidation boundary, with the breakout candle highlighted.]
What Is a Failed Breakout?
Failed breakouts are another important price behavior to recognize.
Imagine a stock moves above resistance, briefly attracting buyers who expect a continued rally.
But instead of advancing, it falls back below the breakout level.
That is a failed upside breakout.
The initial move looked promising, but the market did not sustain it.
Failed breakouts are useful to study because they illustrate why a price signal should not be treated as certain.
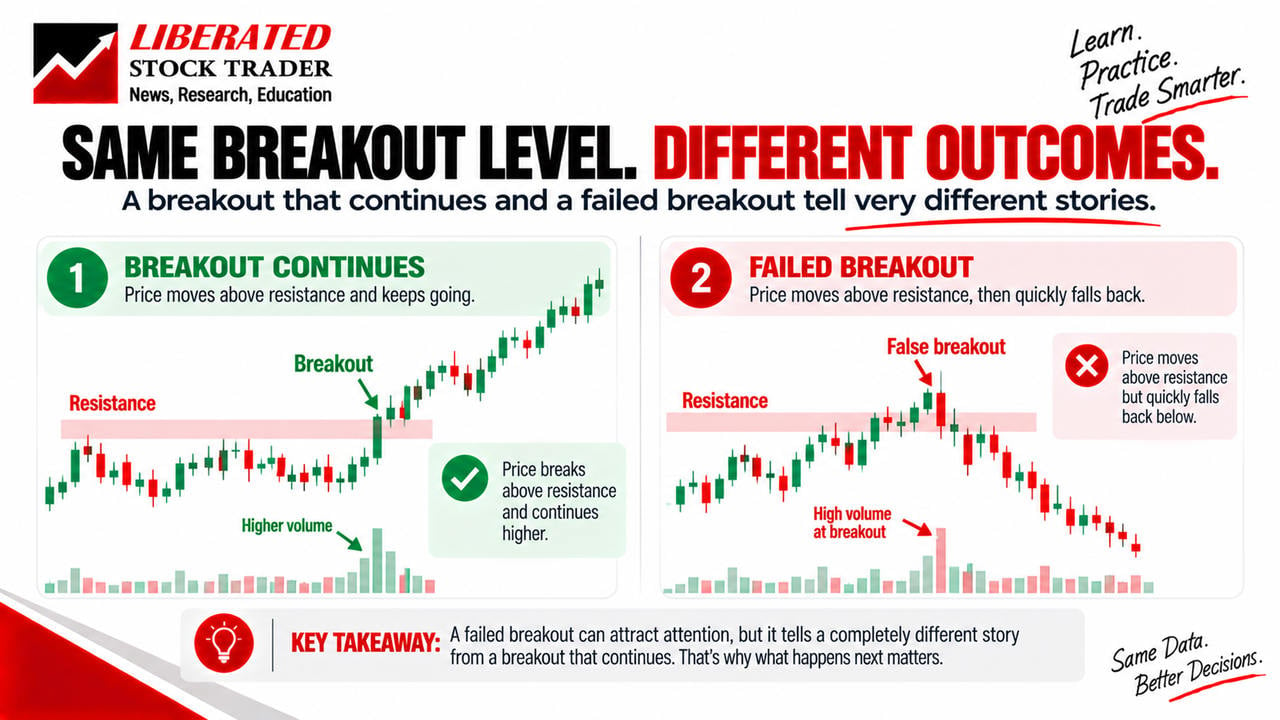
I would compare successful and failed breakouts to identify the differences between them.
Did the successful breakout hold above the previous range? Did the failed breakout reverse quickly? Was the breakout candle unusually extended?
There is no single rule that perfectly distinguishes them.
But comparing these examples improves my ability to recognize uncertainty before entering a trade.
How to Read Market Structure Using Swing Highs and Lows
Now that I understand candles, momentum, consolidation, and breakouts, I can begin examining the broader price structure.
A swing high is a local peak where price stops rising and turns lower.
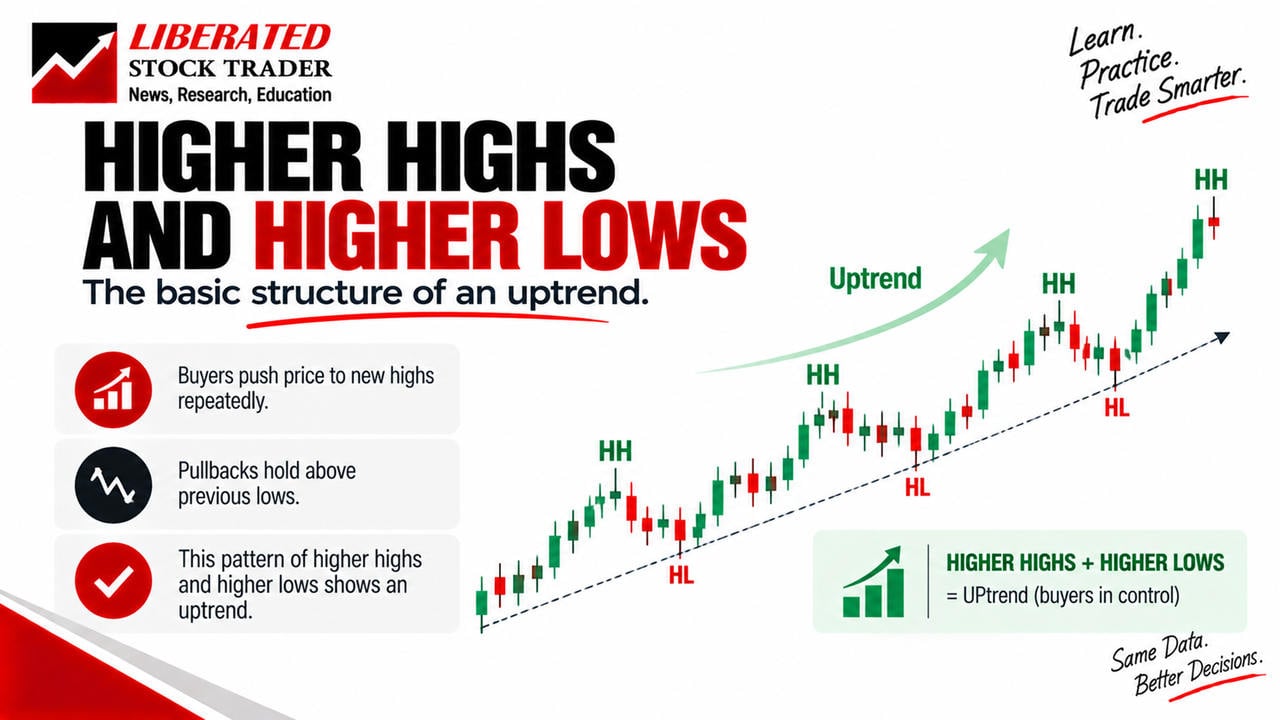
A swing low is a local trough where price stops falling and turns higher.
These turning points help me organize what otherwise might look like random price movement.
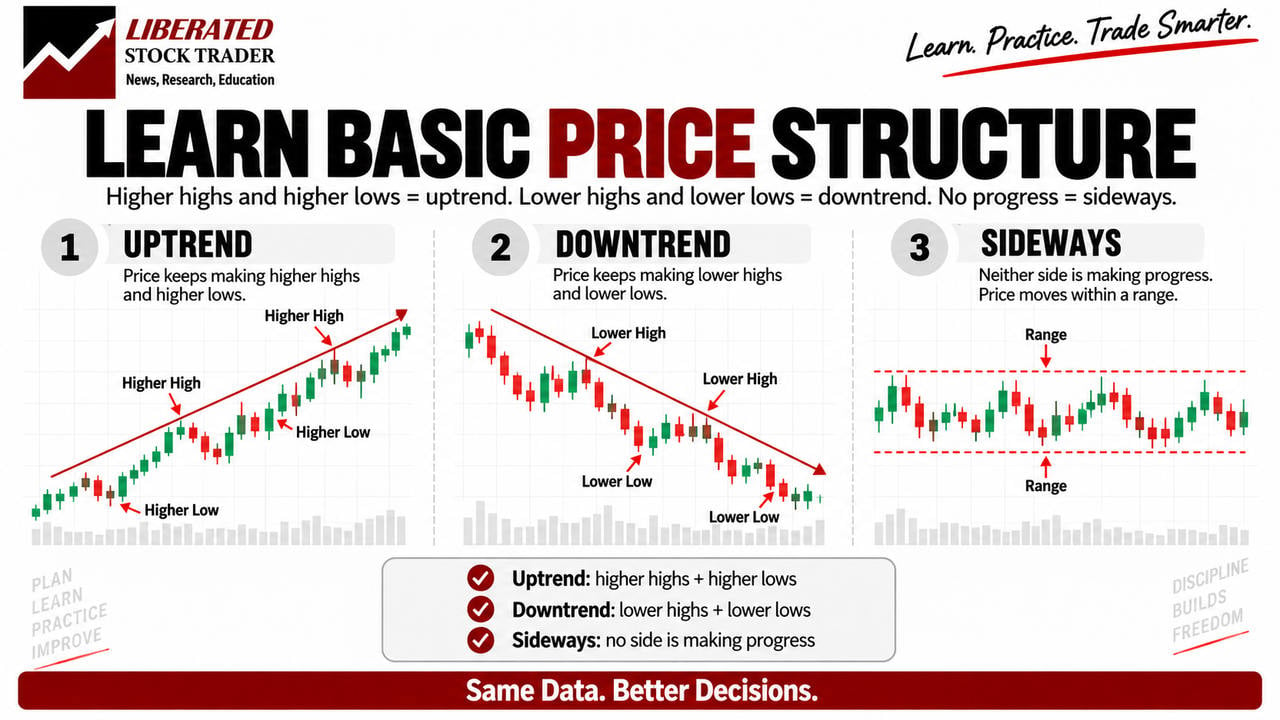
If a stock makes successive higher swing highs and higher swing lows, it is showing characteristics of an uptrend.
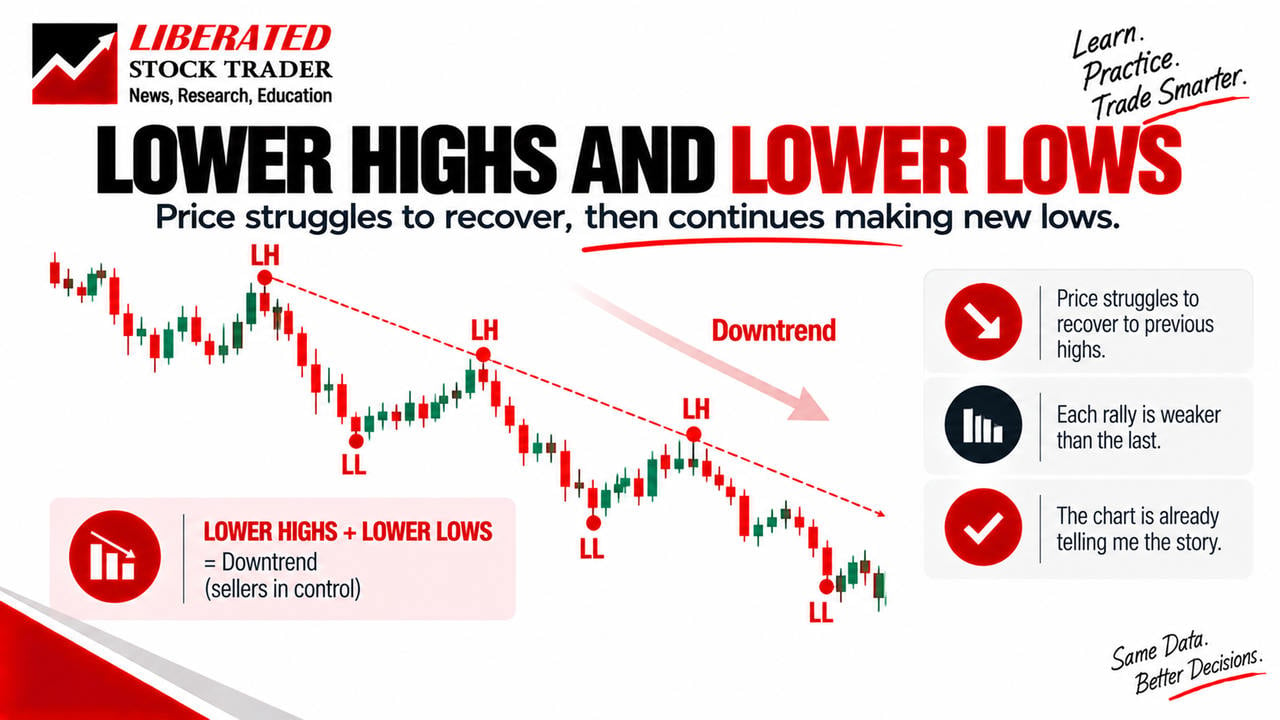
If it makes lower swing highs and lower swing lows, it is showing characteristics of a downtrend.
When those sequences become inconsistent, the stock may be moving sideways or transitioning between market conditions.
I would not need to label every tiny price movement. I would begin with the most obvious turning points.
How to Tell Whether Price Is Rising, Falling, or Moving Sideways
One of the simplest habits I would develop is to classify a chart before making any trading decision.
I would ask:
Is price generally moving higher, lower, or sideways?
In an uptrend, I typically expect to see higher highs and higher lows.
In a downtrend, I look for lower highs and lower lows.
In a sideways market, price frequently moves between boundaries without establishing a sustained direction.
Of course, real charts are rarely perfect.
An uptrend can experience sharp declines, and a downtrend can produce powerful rallies.
A single countertrend move does not automatically invalidate the wider structure.
The goal is to understand the dominant movement, not to force every chart into a perfect pattern.
I’ll examine trend analysis in more detail in Step 3 of this series. For now, recognizing the three basic market conditions is enough.
Why One Candlestick Is Not Enough to Make a Trading Decision
One mistake to avoid as a beginner is placing too much importance on a single candle.
A large green candle might look exciting.
A long lower wick might suggest buyers have returned.
A breakout candle might appear to signal the start of a major move.
But none of those observations tells me everything I need to know.
I would ask what happened before the signal and what happened afterward.
For example, a strong green candle forming after several weeks of falling prices may be an ordinary rebound rather than the start of a sustained uptrend.
Similarly, a candle breaking through resistance might be less convincing if price immediately falls back below that level.
Context changes how I interpret the same candlestick.
That is one of the most important lessons I would learn before adding indicators or developing a trading strategy.
A Simple Price Action Exercise for Beginners
At this stage, I would focus less on finding profitable trades and more on learning to describe price behavior objectively.
Here is an exercise I would use.
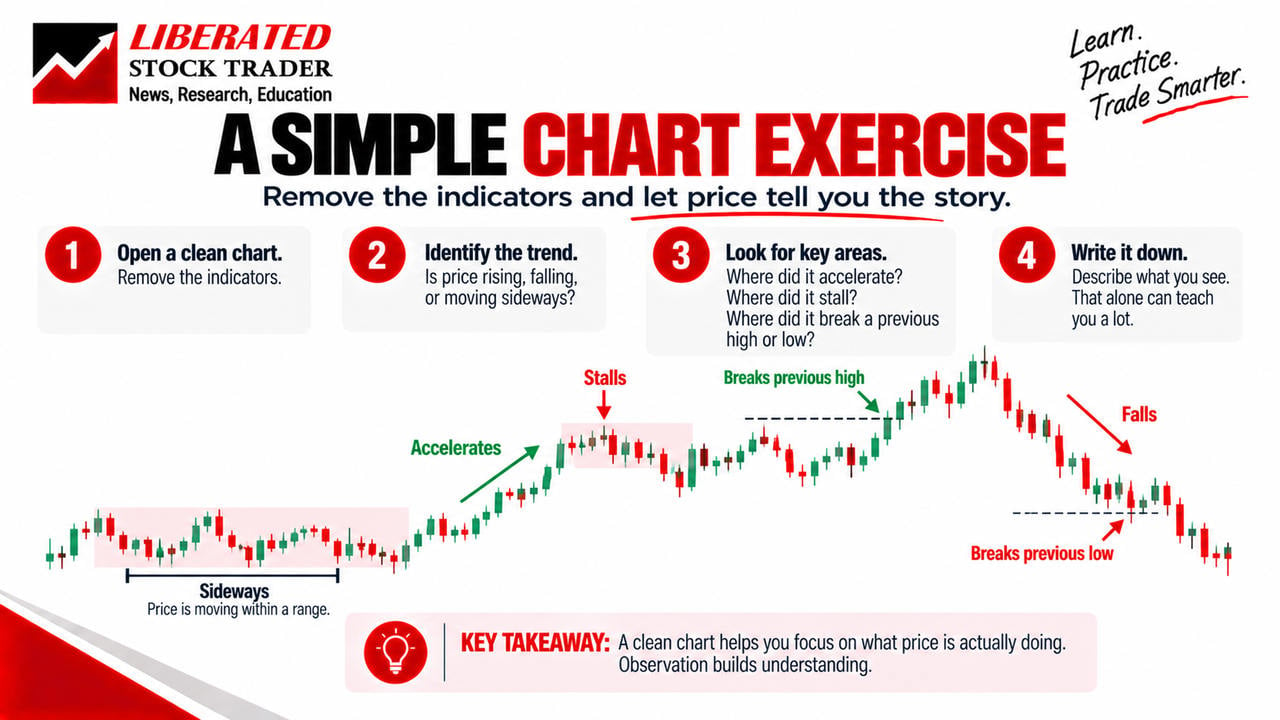
I would open a clean daily stock chart with no indicators and work through five questions:
- Is the overall price moving higher, lower, or sideways?
- Where are the most obvious recent swing highs and swing lows?
- Are the candles showing acceleration, slowing momentum, or consolidation?
- Has price broken through an important previous level?
- What happened after the breakout or price rejection?
I would then move to another chart and repeat the process.
I might examine 20 or 30 historical examples, including stocks that rose, stalled, and stayed sideways.
Most importantly, I would try not to judge the chart using information that was unavailable at the time.
One way to practice this is to hide the later candles and reveal them gradually.
That prevents hindsight from making every price movement look obvious.
The exercise is successful when I can explain what the chart is doing without relying on a collection of complicated indicators.
What I Would Learn Before Moving Beyond Price Action
If I were starting trading from scratch, I would not try to master dozens of candlestick patterns immediately.
I would concentrate on understanding a few essential ideas:
- How to read the open, high, low, and close of a candlestick.
- How candle sequences show changing price behavior.
- How to recognize acceleration and consolidation.
- How to distinguish a breakout from a failed breakout.
- How to identify important swing highs and lows.
- How to classify the overall price structure.
I would also remind myself that reading price action is not the same as having a profitable trading strategy.
Price analysis helps me understand what has happened and develop possible scenarios. It does not, by itself, establish when to enter, where to place a stop-loss, or whether a strategy has a positive expectancy.
Those questions come later.
My objective at Step 1 is simpler: become comfortable reading the language of a stock chart.
What Comes Next? Step 2: Learn Trading Volume
Once I can read price, the next thing I would study is trading volume.
Why?
Because price tells me what happened, while volume adds information about how much trading activity accompanied the move.
Two stocks can show similar breakouts but very different volume patterns.
Learning to interpret that difference is the next part of the process.
From there, I would move through trend analysis, support and resistance, risk management, strategy development, backtesting, and finally choosing trading software.
I would deliberately leave the software until the end.
Once I know how I intend to trade, I can make a more informed decision about what tools I need.
If you want to explore charting platforms, stock screeners, or backtesting tools, try my Smart Trading Tools Finder.
It helps you narrow down independently tested platforms based on your trading style, markets, budget, and required features. You’ll also find partner links offering available discounts and free trials.
My takeaway: If I were learning trading again, I would start by understanding price rather than trying to predict it. Everything else builds on that foundation.
Next: Step 2 — Learn Trading Volume to Confirm Price Moves and Breakouts.
